Tài liệu Ten Principles of Economics - Part 12 docx
Bạn đang xem bản rút gọn của tài liệu. Xem và tải ngay bản đầy đủ của tài liệu tại đây (269.2 KB, 10 trang )
CHAPTER 5 ELASTICITY AND ITS APPLICATION 115
1. For each of the following pairs of goods, which good
would you expect to have more elastic demand
and why?
a. required textbooks or mystery novels
b. Beethoven recordings or classical music recordings
in general
c. heating oil during the next six months or heating oil
during the next five years
d. root beer or water
2. Suppose that business travelers and vacationers have
the following demand for airline tickets from New York
to Boston:
Q
UANTITY
D
EMANDED
Q
UANTITY
D
EMANDED
P
RICE
(
BUSINESS TRAVELERS
)(
VACATIONERS
)
$150 2,100 1,000
200 2,000 800
250 1,900 600
300 1,800 400
a. As the price of tickets rises from $200 to $250, what
is the price elasticity of demand for (i) business
travelers and (ii) vacationers? (Use the midpoint
method in your calculations.)
b. Why might vacationers have a different elasticity
than business travelers?
3. Suppose that your demand schedule for compact discs
is as follows:
Q
UANTITY
D
EMANDED
Q
UANTITY
D
EMANDED
P
RICE
(
INCOME
؍ $10,000) (
INCOME
؍ $12,000)
$ 8 40 50
10 32 45
12 24 30
14 16 20
16 8 12
a. Use the midpoint method to calculate your price
elasticity of demand as the price of compact discs
increases from $8 to $10 if (i) your income is
$10,000, and (ii) your income is $12,000.
b. Calculate your income elasticity of demand as your
income increases from $10,000 to $12,000 if (i) the
price is $12, and (ii) the price is $16.
4. Emily has decided always to spend one-third of her
income on clothing.
a. What is her income elasticity of clothing demand?
b. What is her price elasticity of clothing demand?
c. If Emily’s tastes change and she decides to spend
only one-fourth of her income on clothing, how
does her demand curve change? What are her
income elasticity and price elasticity now?
5. The New York Times reported (Feb. 17, 1996, p. 25) that
subway ridership declined after a fare increase: “There
were nearly four million fewer riders in December 1995,
the first full month after the price of a token increased
25 cents to $1.50, than in the previous December, a 4.3
percent decline.”
a. Use these data to estimate the price elasticity of
demand for subway rides.
b. According to your estimate, what happens to the
Transit Authority’s revenue when the fare rises?
c. Why might your estimate of the elasticity be
unreliable?
6. Two drivers—Tom and Jerry—each drive up to a gas
station. Before looking at the price, each places an order.
Tom says, “I’d like 10 gallons of gas.” Jerry says, “I’d
like $10 worth of gas.” What is each driver’s price
elasticity of demand?
7. Economists have observed that spending on restaurant
meals declines more during economic downturns than
does spending on food to be eaten at home. How might
the concept of elasticity help to explain this
phenomenon?
8. Consider public policy aimed at smoking.
a. Studies indicate that the price elasticity of demand
for cigarettes is about 0.4. If a pack of cigarettes
currently costs $2 and the government wants to
reduce smoking by 20 percent, by how much
should it increase the price?
b. If the government permanently increases the
price of cigarettes, will the policy have a larger
effect on smoking one year from now or five years
from now?
c. Studies also find that teenagers have a higher price
elasticity than do adults. Why might this be true?
9. Would you expect the price elasticity of demand to be
larger in the market for all ice cream or the market for
vanilla ice cream? Would you expect the price elasticity
of supply to be larger in the market for all ice cream or
the market for vanilla ice cream? Be sure to explain your
answers.
10. Pharmaceutical drugs have an inelastic demand, and
computers have an elastic demand. Suppose that
Problems and Applications
116 PART TWO SUPPLY AND DEMAND I: HOW MARKETS WORK
technological advance doubles the supply of both
products (that is, the quantity supplied at each price is
twice what it was).
a. What happens to the equilibrium price and
quantity in each market?
b. Which product experiences a larger change in
price?
c. Which product experiences a larger change in
quantity?
d. What happens to total consumer spending on each
product?
11. Beachfront resorts have an inelastic supply, and
automobiles have an elastic supply. Suppose that a rise
in population doubles the demand for both products
(that is, the quantity demanded at each price is twice
what it was).
a. What happens to the equilibrium price and
quantity in each market?
b. Which product experiences a larger change in
price?
c. Which product experiences a larger change in
quantity?
d. What happens to total consumer spending on each
product?
12. Several years ago, flooding along the Missouri and
Mississippi rivers destroyed thousands of acres of
wheat.
a. Farmers whose crops were destroyed by the floods
were much worse off, but farmers whose crops
were not destroyed benefited from the floods.
Why?
b. What information would you need about the
market for wheat in order to assess whether
farmers as a group were hurt or helped by the
floods?
13. Explain why the following might be true: A drought
around the world raises the total revenue that farmers
receive from the sale of grain, but a drought only in
Kansas reduces the total revenue that Kansas farmers
receive.
14. Because better weather makes farmland more
productive, farmland in regions with good weather
conditions is more expensive than farmland in regions
with bad weather conditions. Over time, however, as
advances in technology have made all farmland more
productive, the price of farmland (adjusted for overall
inflation) has fallen. Use the concept of elasticity to
explain why productivity and farmland prices are
positively related across space but negatively related
over time.
IN THIS CHAPTER
YOU WILL . . .
See how the burden
of a tax is split
between buyers
and sellers
Consider how a tax
on a good affects
the price of the
good and the
quantity sold
Examine the effects
of government
policies that place
a ceiling on prices
Examine the effects
of government
policies that put a
floor under prices
Learn that taxes
levied on buyers
and taxes levied on
sellers are
equivalent
Economists have two roles. As scientists, they develop and test theories to explain
the world around them. As policy advisers, they use their theories to help change
the world for the better. The focus of the preceding two chapters has been scien-
tific. We have seen how supply and demand determine the price of a good and the
quantity of the good sold. We have also seen how various events shift supply and
demand and thereby change the equilibrium price and quantity.
This chapter offers our first look at policy. Here we analyze various types of
government policy using only the tools of supply and demand. As you will see,
the analysis yields some surprising insights. Policies often have effects that their
architects did not intend or anticipate.
We begin by considering policies that directly control prices. For example, rent-
control laws dictate a maximum rent that landlords may charge tenants. Minimum-
wage laws dictate the lowest wage that firms may pay workers. Price controls are
SUPPLY, DEMAND, AND
GOVERNMENT POLICIES
117
118 PART TWO SUPPLY AND DEMAND I: HOW MARKETS WORK
usually enacted when policymakers believe that the market price of a good or ser-
vice is unfair to buyers or sellers. Yet, as we will see, these policies can generate in-
equities of their own.
After our discussion of price controls, we next consider the impact of taxes.
Policymakers use taxes both to influence market outcomes and to raise revenue for
public purposes. Although the prevalence of taxes in our economy is obvious,
their effects are not. For example, when the government levies a tax on the amount
that firms pay their workers, do the firms or the workers bear the burden of the
tax? The answer is not at all clear—until we apply the powerful tools of supply
and demand.
CONTROLS ON PRICES
To see how price controls affect market outcomes, let’s look once again at the mar-
ket for ice cream. As we saw in Chapter 4, if ice cream is sold in a competitive mar-
ket free of government regulation, the price of ice cream adjusts to balance supply
and demand: At the equilibrium price, the quantity of ice cream that buyers want
to buy exactly equals the quantity that sellers want to sell. To be concrete, suppose
the equilibrium price is $3 per cone.
Not everyone may be happy with the outcome of this free-market process.
Let’s say the American Association of Ice Cream Eaters complains that the $3 price
is too high for everyone to enjoy a cone a day (their recommended diet). Mean-
while, the National Organization of Ice Cream Makers complains that the $3
price—the result of “cutthroat competition”—is depressing the incomes of its
members. Each of these groups lobbies the government to pass laws that alter the
market outcome by directly controlling prices.
Of course, because buyers of any good always want a lower price while sellers
want a higher price, the interests of the two groups conflict. If the Ice Cream Eaters
are successful in their lobbying, the government imposes a legal maximum on the
price at which ice cream can be sold. Because the price is not allowed to rise above
this level, the legislated maximum is called a price ceiling. By contrast, if the Ice
Cream Makers are successful, the government imposes a legal minimum on the
price. Because the price cannot fall below this level, the legislated minimum is
called a price floor. Let us consider the effects of these policies in turn.
HOW PRICE CEILINGS AFFECT MARKET OUTCOMES
When the government, moved by the complaints of the Ice Cream Eaters, imposes
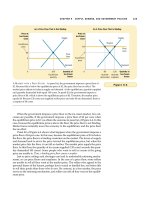
a price ceiling on the market for ice cream, two outcomes are possible. In panel (a)
of Figure 6-1, the government imposes a price ceiling of $4 per cone. In this case,
because the price that balances supply and demand ($3) is below the ceiling, the
price ceiling is not binding. Market forces naturally move the economy to the equi-
librium, and the price ceiling has no effect.
Panel (b) of Figure 6-1 shows the other, more interesting, possibility. In this case,
the government imposes a price ceiling of $2 per cone. Because the equilibrium
price of $3 is above the price ceiling, the ceiling is a binding constraint on the market.
price ceiling
a legal maximum on the price at
which a good can be sold
price floor
a legal minimum on the price at
which a good can be sold
CHAPTER 6 SUPPLY, DEMAND, AND GOVERNMENT POLICIES 119
The forces of supply and demand tend to move the price toward the equilibrium
price, but when the market price hits the ceiling, it can rise no further. Thus, the
market price equals the price ceiling. At this price, the quantity of ice cream de-
manded (125 cones in the figure) exceeds the quantity supplied (75 cones). There is
a shortage of ice cream, so some people who want to buy ice cream at the going
price are unable to.
When a shortage of ice cream develops because of this price ceiling, some
mechanism for rationing ice cream will naturally develop. The mechanism could
be long lines: Buyers who are willing to arrive early and wait in line get a cone,
while those unwilling to wait do not. Alternatively, sellers could ration ice cream
according to their own personal biases, selling it only to friends, relatives, or mem-
bers of their own racial or ethnic group. Notice that even though the price ceiling
was motivated by a desire to help buyers of ice cream, not all buyers benefit from
the policy. Some buyers do get to pay a lower price, although they may have to
wait in line to do so, but other buyers cannot get any ice cream at all.
This example in the market for ice cream shows a general result: When the gov-
ernment imposes a binding price ceiling on a competitive market, a shortage of the good
arises, and sellers must ration the scarce goods among the large number of potential buyers.
The rationing mechanisms that develop under price ceilings are rarely desirable.
Long lines are inefficient, because they waste buyers’ time. Discrimination accord-
ing to seller bias is both inefficient (because the good does not go to the buyer who
values it most highly) and potentially unfair. By contrast, the rationing mechanism
(a) A Price Ceiling That Is Not Binding
$4
3
Quantity of
Ice-Cream
Cones
0
Price of
Ice-Cream
Cone
100
Equilibrium
quantity
(b) A Price Ceiling That Is Binding
$3
Quantity of
Ice-Cream
Cones
0
Price of
Ice-Cream
Cone
2
Price
ceiling
Demand
Supply
Price
ceiling
Shortage
75
Quantity
supplied
125
Quantity
demanded
Equilibrium
price
Equilibrium
price
Demand
Supply
Figure 6-1
AM
ARKET WITH A
P
RICE
C
EILING
. In panel (a), the government imposes a price ceiling
of $4. Because the price ceiling is above the equilibrium price of $3, the price ceiling has no
effect, and the market can reach the equilibrium of supply and demand. In this
equilibrium, quantity supplied and quantity demanded both equal 100 cones. In panel (b),
the government imposes a price ceiling of $2. Because the price ceiling is below the
equilibrium price of $3, the market price equals $2. At this price, 125 cones are demanded
and only 75 are supplied, so there is a shortage of 50 cones.
