Tài liệu INVESTING IN REITs: choosing reits and watching them grow ppt
Bạn đang xem bản rút gọn của tài liệu. Xem và tải ngay bản đầy đủ của tài liệu tại đây (716.12 KB, 70 trang )
choosing
REITs and
Watching Them
Grow
P A R T
C H A P T E R
REITs:
HOW THEY GROW
S O U R C E : B P T H E S A N S - P L A I N 5 / 1 2 S M A L L C A P S T R A C K 5 0
I
ncreases in the value of a company are, of course, the driv-
ing force behind increases in its stock price over time. There
are a number of ways to measure increases in company value,
but measuring and valuing streams of income and cash flows is
perhaps the most commonly used metric in the world of equi
-
ties. And it is the only metric presently sanctioned by today’s
accounting rules, as a company’s assets must be carried on its
books at historical cost, less depreciation, not at current fair
market value.
As a result, rising earnings are a key driving force for a company’s
share price. Steadily rising earnings normally indicate not only that
a REIT is generating higher income from its properties, but may
also suggest that it is making favorable acquisitions or completing
profitable developments. Furthermore, higher income is generally
a precursor of dividend growth. In short, a growing stream of cash
flow means, over time, higher share prices, increased dividends,
and higher asset values. Value can be created in a REIT by invest
-
ment activities that don’t show up in current income or cash flow,
but these latter metrics are most easily quantifiable.
T H E S I G N I F I C A N C E O F F F O A N D A F F O
Investors in common stock use net income as a key measure of
profitability, but the custom in REIT world is to use funds from
operations (FFO). The historical preference for FFO rather than
net income relates to the concept of depreciation. The Securities
and Exchange Commission (SEC), under federal securities laws,
requires that all publicly traded companies file audited financial
statements. On a financial statement, the term net income has a
meaning clearly defined under generally accepted accounting prin
-
ciples (GAAP). Since most REITs are publicly traded companies,
net income and net income per share can therefore always be found
on a REIT’s audited financial statement. For a REIT, however, these
net income figures are less meaningful as a measure of operating
success than they are for other types of companies. The reason is
that, in accounting, real estate depreciation is always treated as an
expense, but in the real world, not only have most well-maintained
quality properties retained their value over the years, but many have
appreciated substantially. This is generally due to a combination
142
I N V E S T I N G I N R E I T S
143
R E I T S : H O W T H E Y G R O W
S O U R C E : B P T H E S A N S - P L A I N 5 / 1 2 S M A L L C A P S T R A C K 5 0
of increasing land values (on which the structure is built), steadily
rising rental and operating income, property upgrades, and higher
costs of construction for new competing properties. Thus a REIT’s
net income under GAAP, reflecting a large depreciation expense,
has been determined by most REIT investors to be less meaningful
a measure of REIT cash flows than FFO, which adds back real estate
depreciation to net income.
Using FFO enables both REITs and their investors to partially cor-
rect the depreciation distortion, either by looking at net income before
the deduction of the depreciation expense or adding back depreciation
expense to reported net income.
When using FFO, there are other adjustments that should be
made as well, such as subtracting from net income any income
recorded from the sale of properties. The reason for this is that
the REIT can’t have it both ways: In figuring FFO, it cannot
ignore
depreciation, which reduces the property cost on the balance
sheet, and then include the capital gain from selling the prop
-
erty above the price at which it has been carried. Furthermore,
GAAP net income is normally determined after “straight-lining,”
or smoothing out contractual rental income over the term of the
lease. This is another accounting convention, but, in real life, rental
income on a multiyear property lease is not smoothed out, and it
F U N D S F R O M O P E R A T I O N S ( F F O )
HISTORICALLY, FFO HAS been defined in different ways by different
REITs, which has only exacerbated the confusion. To address this prob
-
lem, NAREIT (National Association of Real Estate Investment Trusts)
has attempted to standardize the definition of FFO. In 1999, NAREIT
refined its definition of FFO as used by REITs to mean net income com
-
puted in accordance with GAAP, excluding gains (or losses) from sales
of property, plus depreciation and amortization, and after adjustments
for unconsolidated partnerships and joint ventures. Adjustments for
unconsolidated partnerships and joint ventures should be calculated
to reflect funds from operations on the same basis.
144
I N V E S T I N G I N R E I T S
S O U R C E : B P T H E S A N S - P L A I N 5 / 1 2 S M A L L C A P S T R A C K 5 0
often starts low but rises from year to year. For this reason, many
investors, when examining FFO, adjust reported rent revenue to
reflect current contractual rent revenue.
Although most REITs and their investors believe the concept
of FFO is more useful as a device to measure profitability than net
income, it is nevertheless flawed. For one thing, most commercial
property will slowly decline in value year after year, due to wear and
obsolescence, and structural improvements are generally necessary
if that property value is to be retained (e.g., a new roof, or better
lighting). Merely adding back depreciation, then, to net income,
when determining FFO, can provide a distorted and overly rosy
picture of operating results and cash flows.
The very term depreciation allows yet another opportunity for
distortion when it comes to items that might be considered part of
general maintenance, such as, for example, an apartment building’s
carpeting or curtains, even dishwashers. The costs of such items
often might not be expensed for accounting purposes; instead,
they might be capitalized and depreciated over their useful lives.
But, because the depreciation of such items is a real expense, when
such “real estate” depreciation is added back to arrive at FFO, the
FFO will be artificially inflated and thus give a misleading picture
of a REIT’s cash flow. Practically speaking, carpeting and related
items, to use our example, really do depreciate over time, and their
replacement in a building does not significantly increase the prop
-
erty’s value. These are real and recurring expenses.
Additionally, leasing commissions paid to leasing agents when
renting offices or other properties are usually capitalized, then
amortized over the term of the lease. These commission amortiza
-
tions, when added to net income as a means of deriving FFO, will
similarly inflate that figure. The same can also be said about tenant
improvement allowances, such as those provided to office and mall
tenants. Usually, these are so specific to the needs of a particular ten
-
ant that they do not increase the long-term value of the property.
Short-term capital expenditures cannot be considered property-
enhancing capital improvements, no matter how they are accounted for,
and they should be subtracted from FFO to give an accurate picture of a
REIT’s operating performance.
145
R E I T S : H O W T H E Y G R O W
S O U R C E : B P T H E S A N S - P L A I N 5 / 1 2 S M A L L C A P S T R A C K 5 0
Unfortunately, not all REITs capitalize and expense similar items
in similar ways when announcing their FFOs each quarter. Also, some
include investment write-offs and gains from property sales in FFO,
while others do not. With only FFO as a gauge, investors and analysts
are still lacking consistency in terms of the way adjustments to net
income are reflected. Furthermore, there is no uniform standard
to account for recurring capital expenditures that do not improve a
property or extend its life, such as expenditures for carpeting and
drapes, leasing commissions, and tenant improvements.
The term born of this need is adjusted funds from operations
(AFFO), which was coined by Green Street Advisors, Inc., a leading
REIT research firm.
Although FFO as a valuation tool is more useful to REIT investors
than net income under GAAP, NAREIT maintains that “FFO was
never intended to be used as a measure of the cash generated by
a REIT, nor of its dividend-paying capacity.” Adjusted funds from
operations, on the other hand, is a much better measure of a REIT’s
operating performance and is a more effective tool to measure free
cash generation and the ability to pay dividends. Unfortunately,
AFFO is normally not specifically reported by a REIT, and the inves
-
tor or analyst must calculate it on his or her own by reviewing the
financial statements and related footnotes and schedules. And, even
when AFFO is disclosed, different REITs define it differently. The
following is an oversimplified, but perhaps useful, way of looking at
this methodology.
Revenues, including capital gains, minus:
◆
Operating expenses and write-offs
◆
Depreciation and amortization
◆
Interest expense
◆
General and administrative expense = NET INCOME
A D J U S T E D F U N D S F R O M O P E R A T I O N S ( A F F O )
AFFO IS THE FFO as used by the REIT, adjusted for expenditures that,
though capitalized, do not really enhance the value of a property, and
is adjusted further by eliminating straight-lining of rents.
146
I N V E S T I N G I N R E I T S
S O U R C E : B P T H E S A N S - P L A I N 5 / 1 2 S M A L L C A P S T R A C K 5 0
Net Income minus:
◆
Capital gain from real estate sales
plus:
◆
Real estate depreciation = FFO
FFO minus:
◆
Recurring capital expenditures
◆
Amortization of tenant improvements
◆
Amortization of leasing commissions
◆
Adjustment for rent straight-lining = AFFO
The problem encountered by investors in using FFO and its deriv-
atives was discussed by George L. Yungmann and David M. Taube,
vice president, financial standards, and director, financial standards,
respectively, of NAREIT, in an article appearing in the May/June
2001 issue of
Real Estate Portfolio. They note, “A single metric may
not appropriately satisfy the need for both a supplemental earnings
measure and a cash flow measure.” They suggest using a term such as
adjusted net income (which is GAAP net income prior to extraordinary
items, effects of accounting changes, results of discontinued opera
-
tions, and other unusual nonrecurring items) as a supplemental earn
-
ings measurement. Each REIT would then be free to supplement this
“ANI” figure by reporting a cash flow measure such as FFO, AFFO, or
other terms sometimes used by REITs and analysts such as cash avail
-
able for distribution (CAD) or funds available for distribution (FAD).
Of course, when comparing the earnings and FFO figures
reported by two different REIT organizations, it’s important to
compare apples to apples, in other words, we don’t want to com
-
pare the P/FFO ratio of one REIT to the P/AFFO ratio of another,
and we should try to apply similar FFO or AFFO definitions to the
REITs being compared.
In valuing a REIT, although net income should not be ignored,
AFFO (when properly calculated) is the most accurate means for deter
-
mining a REIT’s free cash flow.
Thus, some analysts and investors, when determining AFFO,
look at the actual capital expenditures incurred by a REIT during a
147
R E I T S : H O W T H E Y G R O W
S O U R C E : B P T H E S A N S - P L A I N 5 / 1 2 S M A L L C A P S T R A C K 5 0
reporting period, while others apply a long-term average to smooth
periods of unusually high or low capital expenditures. There is no
“right” or “wrong” approach but, again, it’s important for the inves
-
tor to compare apples to apples.
Now that we have established the differences between these
important terms, we will use, in the balance of this chapter, either
FFO (funds from operations) or AFFO (adjusted funds from opera
-
tions), keeping in mind that virtually all REITs report the former,
although it is less meaningful to investors.
When we discuss the price/earnings ratio of a REIT’s common
stock, we will use either the P/FFO ratio or the P/AFFO ratio, with
the understanding that, although we are trying to be as consistent
as possible, sometimes true consistency is not attainable, and we
must therefore be aware of how these supplements to net income
reporting under GAAP are calculated by or for each REIT.
T H E D Y N A M I C S O F F F O G R O W T H
What makes REIT shares so attractive, compared with other high-
yield investments like bonds and preferred stocks (and, to a less
-
er extent, utility stocks), is their significant capital appreciation
potential and steadily increasing dividends. If a REIT didn’t have
the ability to increase its FFO and its dividend, its shares would
be viewed as not much different from a bond, and they would be
bought only for their yield. Because of the greater risk, of course,
the yields on the stocks of growth-challenged REITs would nor
-
mally be higher than those of most bonds and preferreds, and
their prices would correlate with the fluctuations of long-term
interest rates and investors’ perceptions of these REITs’ ability to
continue paying dividends.
FFO should not be looked upon as a static figure, and it is up to
management to continue to seek methods of increasing it.
We can sometimes find REITs that do trade as bond surrogates
because of investor perception that they have very little growth
potential. Some of these pseudo-bonds can be of high quality
because of the stability of their stream of rental income, while oth
-
ers can be compared to junk bonds because of their high yields but
148
I N V E S T I N G I N R E I T S
S O U R C E : B P T H E S A N S - P L A I N 5 / 1 2 S M A L L C A P S T R A C K 5 0
uncertain flow of rental revenues. These “junk-bond” REITs may be
traded, sometimes profitably, by bottom fishers and speculators, but
such yield chasers are playing a dangerous game.
Long-term investors should be looking at REITs with dividends
that are not just safe but also have good long-term growth pros
-
pects. Wouldn’t you rather own a REIT that pays a current return
of 4 percent and grows 6 percent every year than one that pays
7 percent and doesn’t grow at all?
Sometimes it’s possible to get the best of both worlds—a 7 per
-
cent yield and 3–4 percent annual growth. But, with REITs, as with
everything else in the investment world, there’s usually no such
thing as a free lunch. A REIT that yields more than 7 percent often
suggests that investors perceive very low growth or that the shares
are particularly risky.
All right, then, how does a REIT generate growth in FFO, and
what should you look for? First of all, it is very important to look at
FFO growth on a per-share basis. It does the shareholder no good
if FFO grows rapidly because the REIT has issued large amounts
of new shares. Such “prosperity” is meaningless—like a govern
-
ment printing more money in times of inflation. Remember, also,
that REITs, by definition, must pay their shareholders at least 90
percent of their taxable net income each year but, as a practical
matter, most REITs pay out considerably more than this, as depre
-
ciation expense is also normally taken into account when setting the
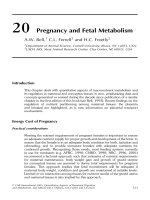
F F O G R O W T H
Internal
Growth
External
Growth
FFO
Growth
FFO
Growth
REITs 07.3 3rd ed.
�
Rental Increases
�
Percentage Rent,
Rent Bumps, etc.
�
Tenant
Upgrades
�
Property
Refurbishments
�
Sale &
Reinvestment
�
Acquisitions
�
Development &
Expansion
�
Nonrental Revenue
S
ources
+
+
+
+
+
+
+
+
+
+
+
+
+
+
+
+
+
+
+
+
+
+
+
++
=
=
=
=
=
=
=
=
=
=
=
=
=
=
=
=
=
=
=
=
=
=
=
==
149
R E I T S : H O W T H E Y G R O W
S O U R C E : B P T H E S A N S - P L A I N 5 / 1 2 S M A L L C A P S T R A C K 5 0
dividend rate. So, if REITs want to achieve external growth through
acquisitions or new developments, where is the cash going to come
from? They will sometimes go to the capital markets, which means
selling more shares, and such new capital is not always available—
and can, at times, be very expensive in terms of dilution to net asset
values. While it is indeed true that REITs can generate cash from
the sale of existing assets, retention of a modest portion of their free
cash flows, and the formation of joint ventures, raising capital exter
-
nally has traditionally been a very important driver of above-average
FFO growth. All of this means that internal growth—which can be
accomplished without having to raise more equity or to take on addi
-
tional debt—is very important to a REIT and its shareholders.
FFO can grow two ways: externally—by acquisitions, develop-
ments, and the creation of ancillary revenue streams, and internally—
through a REIT’s existing assets and resources.
REIT investors and analysts need to understand exactly how
much of a REIT’s growth is being achieved internally and how
much is being achieved externally. External growth, through new
developments, acquisitions, and the creation of ancillary revenue
streams, may not always be possible, because of a lack of available,
high-quality properties at attractive prices, inability to raise capi
-
tal, or the high cost of such capital. Internal growth, on the other
hand, since it is “organically” generated through a REIT’s existing
resources, is more under management’s control (though it is sub
-
ject to real estate market dynamics).
I N T E R N A L G R O W T H
Internal growth is growth via an improvement in profits at the
property level, through increased rental revenues (higher rents
and occupancy rates) and reduced expenses at one or more of the
specific properties owned by the REIT. Controlling corporate over
-
head expenses is also important. Since it is not dependent on acqui
-
sitions, development, or outside capital, it is the most stable and
reliable source of FFO growth.
Before we examine the specific sources of REITs’ internal growth,
however, we should review one of the terms that analysts use in
150
I N V E S T I N G I N R E I T S
S O U R C E : B P T H E S A N S - P L A I N 5 / 1 2 S M A L L C A P S T R A C K 5 0
reference to internal growth. The term is same-store sales (or, a relat-
ed term, same-store net operating income)—a concept taken from
retail but also used in nonretail REIT sectors. In a retail operation,
same-store sales refers to sales from stores open for at least one year,
and excludes sales from stores that have closed or from new stores,
since new stores characteristically have high sales growth.
Although the term same-store sales was originally a retail con-
cept, it, and its companion, same-store net operating income, have been
borrowed for use by other, nonretail REIT sectors to refer to growth that
is internal, rather than from new development or acquisition.
Once you consider what the same-store concept means in retail,
you can see how it might be applied to various REIT sectors. Most
REITs report to their shareholders on a quarterly basis same-store
rental revenue increases (and net operating income, or NOI, on
a same-store basis). Same-store rental revenues (which include
changes in occupancy), reduced by related expenses, determines
same-store NOI growth, which presents a good picture of how well
the REIT is doing with its existing properties as compared to the
similar prior period.
Property owners, including REITs, use different tools to generate
growth on a same-store basis. These tools include rental revenue
increases, ancillary property revenues, upgrading the tenant roll,
and upgrading—or even expanding—the property. Those REITs
that are more aggressive and creative in their use of these tools are
more likely to achieve, over time, higher internal growth rates. Of
course, the strategic location of the properties, and their quality,
are also highly important.
RENTAL REVE NUE INCR EAS ES
The most obvious type of internal growth, the ability to raise
rental rates and revenue, regardless of property sector, is probably a
REIT’s most important determinant of internal growth.
Rental rates can be increased over time if a property is desirable
to tenants, and higher occupancy rates can lead to even higher
151
R E I T S : H O W T H E Y G R O W
S O U R C E : B P T H E S A N S - P L A I N 5 / 1 2 S M A L L C A P S T R A C K 5 0
rental revenues. Nevertheless, raising rents is not always possible,
and there are periods in virtually every sector’s cycle when such
revenues actually fall rather than rise. Anyone who owned office
buildings in the early 1990s or in the first few years of the twenty-
first century knows there’s no guarantee the rent can be raised—or
even maintained at the same level—when the lease comes up for
renewal. Even if the rent is raised slightly, if the tenant receives
huge tenant improvement allowances as an inducement to lease
the space, the lease may still not be very profitable. In addition, unit
rent increases can be wiped out by high vacancy rates, rental con
-
cessions, and heavy marketing and advertising costs. These prob
-
lems were faced, most recently, from 2001 to 2004 in most property
sectors, when high vacancy rates put the tenants in the driver’s seat
in negotiating rents on new leases. Many factors, such as supply and
demand for a particular property or property sector (including, of
course, location and obsolescence), the current economic climate,
and the condition of (and amenities offered by) a property can
enhance or restrict rental revenue increases. During recessions, of
course, vacancy is likely to rise. When occupancy slippage occurs,
owners have difficulty raising, and sometimes even maintaining,
rents until the economy recovers.
Most retail shopping center owners have been able to raise rental
rates at a healthy rate, even during the difficult real estate markets of
2001–2004, as leases have come up for renewal—despite the steady
pace of retailer bankruptcies, the challenges from Wal-Mart and
others, and the threat coming from the rise of e-commerce. In malls,
tenants have signed new, more expensive leases to replace the leases
signed during prior years when sales volumes were significantly
lower than they are now. In the long run, however, rent increases
will generally not be able to outpace the rise in same-store tenant
sales, as tenant occupancy costs as a percentage of sales have been
quite consistent over the years. Rental rate increases have been a
bit more difficult for neighborhood shopping center and outlet
center owners, due to heavy competition and the in-roads made by
Wal-Mart and its wanna-bes, and there is no guarantee, of course,
that retail real estate owners will always be able to increase rents.
The apartment sector had been in equilibrium for many years,
with demand offsetting new supply, but poor job growth in the early
152
I N V E S T I N G I N R E I T S
S O U R C E : B P T H E S A N S - P L A I N 5 / 1 2 S M A L L C A P S T R A C K 5 0
years of the twenty-first century, coupled with low interest rates that
encouraged new construction and stoked demand for single-family
housing, put renters in control. Apartment occupancy rates and net
operating income declined, but started to grow again beginning in
the latter part of 2004. Investors in this sector should expect long-
term internal growth roughly in line with inflation.
Office rents suffered during the period of massive overbuild
-
ing in the late 1980s and early 1990s, but the cycle bottomed out
earlier than most had anticipated. Rent growth was strong from
the mid-1990s through 2000, but then rents declined substantially
from 2001 through 2004, and most observers don’t expect mean
-
ingful rent growth until at least 2006 in most markets. The cycle for
industrial properties was similar, although less pronounced. Rents
declined more significantly in some of the erstwhile hot high-tech
markets.
Self-storage facilities have enjoyed steady rental growth since
the early 1990s, although growth slowed substantially from 2001 to
2004. Their popularity, coupled with only moderate building over
the last few years, has enabled owners of these facilities to increase
rents frequently, and, even with a slowdown in the pace of rent
increases, should still be able to do reasonably well over time.
Hotel owners fared well during the strong economic recovery
that began in earnest in 1993, seeing big jumps in room rates (and
even, in most cases, occupancy rates). But from 2001 to 2004, both
rents and occupancy slipped badly—as would be expected during
a very weak economy, especially in the business sector, exacerbated
by the September 11 terrorist attacks. This property sector hit bot
-
tom in 2004, and revenue and income growth were accelerating
throughout 2005.
Health care REITs enjoy the protection of long-term leases, which
also offer a bit of upside based upon revenues generated by the
operator. The key here, as we saw in the late 1990s, is the finan
-
cial strength of the lessees; defaulting tenants are often not easily
replaced at the same or higher rents. Base rents for these facilities
should remain fairly stable. The assisted-living market, however, will
be somewhat more volatile, as barriers to entry are lower.
Although it may be an oversimplification, most real estate observ
-
ers seem to think that owners of well-maintained properties in
153
R E I T S : H O W T H E Y G R O W
S O U R C E : B P T H E S A N S - P L A I N 5 / 1 2 S M A L L C A P S T R A C K 5 0
markets where supply and demand are in balance will, over time,
continue to get rental revenue increases at least equal to inflation.
We are talking here only about broad-based industry trends; some
REITs will get better rental increases upon lease renewal than oth
-
ers, based upon many factors related to supply and demand for spe
-
cific properties in specific locations, as well as property quality and
location. Management’s leasing capabilities are also very important.
Trying to determine
which REITs and their properties have better
than average potential rental revenue and NOI growth is one of the
challenges—and some of the fun—of REIT investing.
H O W T O B U I L D R I S I N G
F F O I N T O T H E L E A S E
Many property owners have been able to obtain above-average
increases in rental revenues by using methods that focus on ten
-
ants’ needs and their financial ability to pay higher effective rental
rates. These methods include percentage rent, rent bumps, and
expense sharing and recovery.
PERCEN TAG E REN T
“Percentage-rent” clauses in retail-store leases enable the property
owner to participate in store revenues if such revenues exceed
certain preset levels.
A retail lease’s percentage-rent clause might be structured so
that if the store’s sales exceed, for example, $5 million for any
calendar year, the lessee must pay the landlord 3 percent of the
excess, in the form of additional rent. The extent to which les
-
sees will agree to this revenue sharing depends on the property
location, the market demand for the space, the base rent, and the
property owner’s reputation for maintaining and even upgrading
shopping centers to make them continually attractive to shoppers.
This concept has been carried over into the health care sector,
where REITs have structured most of their leases (and even their
mortgages when the REIT provides mortgage financing) so that
the owner shares in same-store revenue growth above certain mini
-
mum levels. In some cases, the rent increases are capped at prede
-
termined levels.
154
I N V E S T I N G I N R E I T S
S O U R C E : B P T H E S A N S - P L A I N 5 / 1 2 S M A L L C A P S T R A C K 5 0
RENT B UMPS
“Rent bumps” are contractual lease clauses that provide for built-in
rent increases periodically. These are sometimes negotiated at fixed
dollar amounts and sometimes based upon an index of inflation
such as the Consumer Price Index. Office and industrial-property
owners who enter into long-term leases are often able to structure
the lease so that the base rent increases every few years, thus provid
-
ing built-in same-store NOI growth. The rent-bump provision is also
popular with owners of health care facilities, who use them in leases
with their health care operators, and with retailers, who use them to
match leasing costs with projected longer-term revenues from the
stores’ operations.
EXPENS E SHA RIN G
“Expense sharing” or “cost recovery” is a way in which owners have
persuaded their lessees to share expenses that at one time were borne
by the landlord, and have included “cost-sharing” or common area
maintenance (CAM) recovery clauses in their leases to offset rising
property maintenance, and even improvement, expenses.
In the case of office buildings, the lessees might pay their pro
rata portion of the increased operating expenses, including higher
insurance, property taxes, and on-site management costs. Similarly,
retail owners have, over the last several years, been able to obtain
reimbursement from their lessees for certain common-area mainte
-
nance operating expenses, such as janitorial services, security, and
even advertising and promotion.
Many savvy apartment community owners have put separate elec
-
tric and water meters, or even separate heating units, into their
apartments, with a twofold benefit. The owner is protected from
rising energy costs, and the tenant is encouraged to save energy.
Cost-sharing lease clauses improve NOI, and thereby FFO, while
tending to smooth out fluctuations in operating expenses from year
to year. The degree to which they can be used depends on a prop
-
erty’s supply/demand situation and location, as well as the property
owner’s ability to justify them to the lessee. The large mall REITs,
such as Simon Property Group, may, on the basis of their size and
reputation for creative marketing, be able to get lease provisions a
weaker mall owner could not.
155
R E I T S : H O W T H E Y G R O W
S O U R C E : B P T H E S A N S - P L A I N 5 / 1 2 S M A L L C A P S T R A C K 5 0
O T H E R W A Y S T O G E N E R A T E
I N T E R N A L G R O W T H
There are two principal ways to improve a property in order to cap-
ture higher rental rates: One is by upgrading the tenant mix; the
other is by upgrading the property, through renovation or refur
-
bishment. Both can be effective.
TENANT UPGR ADE S
Upgrading the tenant mix is largely a retail opportunity, and cre-
ative owners of retail properties have been able to increase rental
revenues significantly by replacing mediocre tenants with attrac
-
tive new ones. Retailers who offer innovative products at attractive
prices generate higher customer traffic and boost sales at both the
store and the shopping center, and successful tenants can afford
higher rents.
This ability to upgrade tenants is what distinguishes a truly innova
-
tive retail property owner from the rest. Kimco Realty, which boasts
one of the most respected management teams in the retail REIT
sector, maintains a huge database of tenants that might improve its
centers’ profitability. This resource, along with the strong relation
-
ship Kimco has with high-quality national and regional retailers,
allows it to upgrade its tenant base within an existing retail center
on a continual basis. Regency Centers, another retail REIT, has
been following a similar strategy, establishing long-term relation
-
ships with strong national and regional retailers. In the factory out
-
let center niche, Chelsea Property Group, which was acquired by
Simon in 2004, has been a leader in replacing poorly performing
tenants with those who can draw big crowds, enhancing the value
of the property and providing higher rent to the property owner.
Most mall owners have, for many years, been following this formula
as well, and are always looking for opportunities to replace or down
-
size weaker tenants. For them, when a Montgomery Ward’s goes
out of business, or a May’s store closes, it is not a problem but an
opportunity.
Tenant upgrades are even more important during weak retailing
periods. Late in 1995 and into 1996, many retailers, having been
squeezed by sluggish consumer demand and inroads made upon
156
I N V E S T I N G I N R E I T S
S O U R C E : B P T H E S A N S - P L A I N 5 / 1 2 S M A L L C A P S T R A C K 5 0
them by Wal-Mart and other discount stores, filed for bankruptcy.
A similar situation prevailed from 2001 to 2003. Those mall owners
who replaced poorly performing apparel stores with restaurants
and other unique retailing concepts prospered; those who did not
encountered flat-to-declining mall revenues, vacancy increases,
and declining or stagnating rental rates upon lease renewal. A
good and productive mix of tenants is just as important as a good
location.
PROPER TY REF URB ISHMENT S
Refurbishment is a skill that separates the innovative property owner
from the passive one. This ability can turn a tired mall, neighbor
-
hood shopping center, office building—even an apartment com
-
munity—into a vibrant, upscale property likely to attract new ten
-
ants and customers.
Successfully refurbishing a property has several benefits. The
upgraded and beautified property attracts a more stable tenant base
and commands higher rents and, for retail properties, more shop
-
pers. The returns to the REIT property owner on such investments
can often be almost embarrassingly high.
Federal Realty, another well-regarded retail REIT, has been gen
-
erating outstanding returns from turning tired retail properties into
more exciting, upscale, open-air shopping complexes. Acadia Realty,
a smaller retail REIT, has been doing very innovative refurbishments.
In the apartment sector, Home Properties and United Dominion,
among others, have been buying apartment buildings with deferred
maintenance problems or with significant upgrade potential at attrac
-
tive prices, then successfully upgrading and refurbishing them with
new window treatments and upgraded kitchens. Alexandria Real
Estate, which focuses on the office/laboratory niche of the office
market and provides space for pharmaceutical and biotech compa
-
nies, has been expanding its redevelopment strategy and is believed
to be earning returns in excess of 12 percent on such projects. The
lesson here for investors is that REITs with innovative management
can create value for their shareholders through imaginative refur
-
bishing and tenant-upgrade strategies.
157
R E I T S : H O W T H E Y G R O W
S O U R C E : B P T H E S A N S - P L A I N 5 / 1 2 S M A L L C A P S T R A C K 5 0
SALE A ND R EIN VESTMEN T
Sometimes investment returns can be improved by selling properties
with modest future rental growth prospects, and then reinvesting the
proceeds elsewhere, including acquisition of properties which are
likely to generate higher returns, new development projects, or even
stock repurchases, preferred stock redemptions, and debt repay
-
ment. REITs should “clean house” from time to time and consider
which properties to keep and which to sell, using the capital from
the sale for reinvestment in more promising properties. This may
still be considered internal growth, since new projects are financed
by the sale of existing properties and does not require new capital.
Truly entrepreneurial managements are always looking to
improve investment returns, and sale and reinvestment is one con
-
servative and highly effective strategy. As noted in Chapter 6, this
practice has become popular with REIT organizations ever since
the capital markets slammed shut on them in mid-1998, and is now
referred to as a “capital recycling” strategy.
For example, a property might be sold at a 7.5 percent cap rate,
with a prospective long-term return of 8.5 percent annually, and
the net proceeds invested in another (perhaps underperforming)
property that, with a modest investment of capital and upgraded
tenant services, might provide a long-term average annual return
of 10–11 percent or more within a year or two. Funds reinvested
in well-conceived and well-executed development projects can be
equally profitable, as we’ll discuss below. Sometimes a REIT will
decide to exit an entire market if it doesn’t like its long-term pros
-
pects, and will sell all its properties located there. This approach to
value creation does not require significant use of a REIT’s capital
resources, since the capital to acquire new properties or to develop
them is created through the sale of existing properties.
Again, as with tenant upgrading and property refurbishing, capi
-
tal recycling is something to watch for. Most REIT managements are
always alert for new opportunities and should have no emotional
attachments to a property just because their REIT has owned it for a
while or because it’s performed well in the past. For example, just in
the apartment sector, Archstone-Smith, Avalon Bay, Camden, Equity
Residential, Post Properties, and United Dominion have all been
substantial sellers of mature assets in recent years. There may be a
158
I N V E S T I N G I N R E I T S
S O U R C E : B P T H E S A N S - P L A I N 5 / 1 2 S M A L L C A P S T R A C K 5 0
short-term cost in terms of temporary earnings dilution, as higher-
quality assets usually trade at lower entry yields than the lower-qual
-
ity assets disposed of and as the sale proceeds are used temporarily
to pay down debt, but the long-term benefits of this strategy will be
substantial if executed with good judgment and intelligence.
CONCEP TS OF NOI AND I RR
Before we leave this discussion, let’s fill in our knowledge—and
help us prepare for what follows—with a couple of very impor
-
tant concepts in real estate, net operating income and internal
rate of return. The term net operating income (NOI) is normally
used to measure the net cash generated by an income-producing
property. Thus, NOI can be defined as recurring rental and other
income from a property, less all operating expenses attributable
to that property. Operating expenses will include, for example,
real estate taxes, insurance, utility costs, property management,
and, sometimes, recurring reserves for replacement. They do
not include items such as a REIT’s corporate overhead, interest
expense, value-enhancing capital expenditures, or depreciation
expense. Therefore, the term attempts to define how much cash
is generated from the ownership and leasing of a commercial
property. Investors might expect NOI on a typical commercial
real estate asset to grow about 2–3 percent annually, roughly in
line with inflation, during most economic periods.
The term internal rate of return (IRR) helps the real estate investor
to calculate his or her investment returns, including both returns
on investment and returns of investment. It is used to express the
percentage rate of return from all future cash receipts, balanced
against all cash contributions, so that when each receipt and each
contribution is discounted to net present value, the sum is equal to
zero when added together. To put it more simply, it’s the rate of
return that an investor expects when making the investment, or,
with hindsight, the rate of return obtained from the investment.
For example, if the real estate investor requires a 10 percent return
on his or her investment, he or she won’t buy the offered property
if the net present value of all future cash receipts from that prop
-
erty, including gain or loss on its eventual sale, isn’t likely to equal
or exceed 10 percent. Of course, this requires some sharp-penciled
159
R E I T S : H O W T H E Y G R O W
S O U R C E : B P T H E S A N S - P L A I N 5 / 1 2 S M A L L C A P S T R A C K 5 0
calculations (these days, done with Excel spreadsheets!), including
many assumptions concerning occupancy and rental rates, property
expenses, growth in net operating income, and what the property
will be worth when sold at some assumed future date.
One of the reasons that so many real estate investors lost a bundle
of money in the early 1990s is that the IRR assumptions they made
when buying commercial real estate in the late 1980s were wildly
optimistic. Perhaps the
real value of IRR calculations for potential
acquisition opportunities is not the resulting percentage derived
from a single mathematical exercise. Rather, the value is that they
let the prospective property buyer test the sensitivity of percentage
returns under differing sets of performance assumptions,
that is,
“To what extent will my prospective IRR return be reduced if my
occupancy rate averages 90 percent rather than 93 percent in years
three, four, and five following the investment?”
As we’ve seen here, REITs’ internal-growth opportunities are as
numerous as their property types. In the hands of shrewd manage
-
ment, these options can be maximized so that results pay off for
both the REIT and its investors. However, internal growth isn’t the
only way REITs can expand revenues, funds from operations, and
dividend-paying capacity. There is another.
E X T E R N A L G R O W T H
Let’s assume, for purposes of discussion, that a high-quality REIT
can obtain annual rental revenue increases slightly better than the
rate of inflation, say 3 percent, and that expenses and overhead
growth can be held to less than 3 percent. Let’s assume further that
with modest, fixed-rate debt leverage, such a REIT can increase its
per share FFO by 4.5 percent in a typical year. Finally, let’s assume
that the well-managed REIT can achieve another 0.5 percent annu
-
al growth through tenant upgrades, refurbishments, and other
internal means. How do we get from this 5 percent FFO growth
to the 6–8 percent pace some REITs have been able to achieve for
a number of years? The answer is through external growth, a pro
-
cess by which a real estate organization, such as a REIT, acquires
or develops additional properties or engages in additional business
activities that generate profits for the organization’s owners. Let’s
look at the ways in which this can occur.
160
I N V E S T I N G I N R E I T S
S O U R C E : B P T H E S A N S - P L A I N 5 / 1 2 S M A L L C A P S T R A C K 5 0
External growth can be generated through attractive property
acquisitions, development and expansion, and activities such as joint
ventures and other real estate businesses.
ACQUISITION OPPORTUNITIES
The concept of acquiring additional properties at attractive initial
yields and with substantial NOI growth potential has been applied
successfully for many years by such well-known REITs as AMB
Property, Equity Residential, Home Properties, Macerich Corp.,
Simon Property Group, United Dominion Realty, Washington
REIT, Weingarten Realty, and many others.
For example, a REIT might raise $100 million through a com
-
bination of selling additional shares and medium-term promissory
notes, which, allowing for the dilution from the newly issued shares
and the interest costs on the debt, might have a weighted average
cost of capital of 8 percent. It would then use the proceeds to buy
properties that, including both their initial yields and the addi
-
tional growth from rent increases and some capital appreciation
over time, might generate internal rates of return of 10 percent.
The net result of such transactions would be a pickup of 200 basis
points over the REIT’s average cost of capital. We must keep in
mind, however, that near-term FFO “accretion” (obtaining initial
yields on a new investment that will increase per share FFO over
the near term) is much less important to investors than being able
to find and acquire properties able to deliver longer-term internal
A C Q U I S I T I O N S
THE EXTENT OF A REIT’s acquisition opportunities is dependent upon
many factors, including a REIT’s access to the capital markets and the
cost of such capital, the strength of its balance sheet, levels of retained
earnings, and the prevailing cap rates and prospective IRRs on the type
of property it wants to acquire. We would like the acquired properties
to have meaningful NOI growth potential, which, together with the
initial yield, will provide internal rates of return equal to, or ideally in
excess of, the REIT’s true weighted average cost of capital.
161
R E I T S : H O W T H E Y G R O W
S O U R C E : B P T H E S A N S - P L A I N 5 / 1 2 S M A L L C A P S T R A C K 5 0
rates of return that equal or exceed the REIT’s true cost of capital.
And this, at certain times, can be very difficult, making acquisitions
problematical.
Acquisition opportunities are rarely available to a REIT that can
-
not raise either equity capital (perhaps because of undesirable prior
company performance, an unproven track record, or a history of
poor capital allocation by management) or debt capital (when its
balance sheet is already heavily leveraged). Furthermore, investors
do not want their company to sell new equity if doing so would cause
dilution to FFO or to estimated net asset values (NAV) of the com
-
pany. Dilutive acquisitions are not popular with REIT investors.
The early 1990s were a golden acquisition era for apartment
REITs, which may be why so many of them went public during
that time. The most seasoned apartment REIT at that time, United
Dominion, could raise equity capital at a nominal cost of 7 per
-
cent, and debt capital at 8 percent. It could then acquire apartment
properties at well below replacement cost in the aftermath of the
real estate depression of the late 1980s that provided it with entry
yields of 11 percent or more and internal rates of return that were
even higher. (The sellers were troubled partnerships, overlever
-
aged owners, banks owning repossessed properties, or the Resolu
-
tion Trust Corporation.)
At first glance it may seem odd that properties could become
available at such cheap prices and high investment returns, but if a
type of property in a particular location has few willing buyers but
lots of anxious sellers, the purchase price will be low in relationship
to the anticipated cash flow from the property, and internal rates of
return to the property buyer will be extraordinary. At the bottom
of property cycles we often see such supply/demand imbalances,
since, with abundant foreclosures, not only are owners anxious to
cut their losses, but property refinancings are unavailable, and con
-
fidence levels are low. This is not, however, always the case; in the
early years of the twenty-first century, despite very weak real estate
markets, owners were able to refinance assets at low interest rates,
few of them were overburdened with debt, and there were lots of
willing buyers for underperforming properties.
The extent of acquisition opportunities for REITs thus depends
upon real estate pricing and prospects from time to time, includ
-
162
I N V E S T I N G I N R E I T S
S O U R C E : B P T H E S A N S - P L A I N 5 / 1 2 S M A L L C A P S T R A C K 5 0
ing the prevalence or absence of competing buyers, as well as each
REIT’s cost of capital—both equity and debt. Attractive acquisi
-
tion prospects will be few when real estate prices are high and thus
offer poor returns relative to historic norms; this often results from
an abundance of potential buyers all waiting to snap up the next
property coming onto the market, as well as overly rosy forecasts for
rental growth. This situation has been prevalent during the last ten
years, when finding great acquisitions has been difficult. Most REIT
investors want their REIT to find the unusual acquisition opportu
-
nity at a bargain price—they believe that little value can be created
when a REIT pays simply a fair price for an asset (unless it can man
-
age it much more efficiently than anyone else or earn a substantially
higher return through a joint venture strategy).
Even if reasonably attractive opportunities are available, the
REIT cannot take advantage of them if its cost of capital exceeds
the likely returns. To use an excessively pessimistic example, let’s
assume that investors expect 15 percent returns from their invest
-
ment in a particularly fast-growing REIT (we’ll call it Gazelle REIT),
and that Gazelle REIT wants to buy a package of quality properties
that is expected to deliver an internal rate of return of 10 percent.
T H E C O S T O F E Q U I T Y C A P I T A L
THE COST OF equity capital is often a misunderstood concept. What
does it really cost a REIT and its shareholders to issue more shares?
There are several ways to calculate such cost of equity capital. “Nom
-
inal” cost of equity capital refers to the fact that a REIT’s current earn
-
ings (FFO or AFFO) and its net assets must be allocated among a larger
number of common shares, while “true” or “long-term” cost of equity
capital considers such dilution over longer time periods and gives cre
-
dence to shareholders’ total return expectations on their invested capi
-
tal. What’s important for investors, however, is that they focus not just
on the initial accretion to FFO from an acquisition, but also upon the
longer-term internal rate of return (IRR) expectation from an acquired
property, and they should compare expected total returns against an
estimated weighted average cost of capital. (For more information on
cost of equity capital, see Appendix E.)