Numerical investigation of force transmission in granular media using discrete element method
Bạn đang xem bản rút gọn của tài liệu. Xem và tải ngay bản đầy đủ của tài liệu tại đây (12.92 MB, 19 trang )
Vietnam Journal of Mechanics, VAST, Vol. 42, No. 2 (2020), pp. 153 – 171
DOI: />
NUMERICAL INVESTIGATION OF
FORCE TRANSMISSION IN GRANULAR MEDIA USING
DISCRETE ELEMENT METHOD
Thong Chung Nguyen1 , Lu Minh Le1 , Hai-Bang Ly2 , Tien-Thinh Le3,∗
1
Vietnam National University of Agriculture, Hanoi, Vietnam
2
University of Transport Technology, Hanoi, Vietnam
3
Duy Tan University, Da Nang, Vietnam
∗
E-mail:
Received: 19 January 2020 / Published online: 10 May 2020
Abstract. In this paper, a numerical Discrete Element Method (DEM) model was calibrated to investigate the transmission of force in granular media. To this aim, DEM simulation was performed for reproducing the behavior of a given granular material under
uniform compression. The DEM model was validated by comparing the obtained shear
stress/normal stress ratio with results published in the available literature. The network
of contact forces was then computed, showing the arrangement of the material microstructure under applied loading. The number and distribution of the contacts force were also
examined statistically, showing that the macroscopic behavior of the granular medium
highly depended on the force chain network. The DEM model could be useful in exploring the mechanical response of granular materials under different loadings and boundary
conditions.
Keywords: granular mechanics, discrete element method, force chain, compression test.
1. INTRODUCTION
A granular medium is composed of separate particles that move without dependence and interact with other particles via contact points [1]. Typical granular materials
could be found in civil engineering, such as geotechnical engineering, mining or energy
production, chemical, pharmaceutical, and agricultural industries [2–4]. Research and
development of machinery/device for processing granular materials have been considerably increased over the past ten years, requiring above all a good knowledge of interactions between particulate systems itself and with machine parts [5]. For instance, the
coefficient of friction has been introduced, measured to characterize the dissipation of energy when the particles collide [6]. These particulate interactions have been investigated
for many years using analytical, semi-analytical, or experimental approaches [3,7,8]. Despite all the efforts, it is not always possible to carry out a large number of configurations
c 2020 Vietnam Academy of Science and Technology
154
Thong Chung Nguyen, Lu Minh Le, Hai-Bang Ly, Tien-Thinh Le
taking into account all the possible parameters [6]. Moreover, experimental works might
not have the required ability to investigate the local interactions, particularly in terms of
transmission of stress, collapse of force chain under deformation and so on [9]. It clearly
showed that a more robust manner is thus required for better understanding and characterizing the mechanical properties of granular materials [10].
From a numerical simulation point of view, the mechanics of granular media can be
modeled by either continuum [11–13] or discrete [14–16] approaches. More precisely, in
a discrete approach, the Discrete Element Method (DEM) has been primarily employed
to simulate granular materials [10, 17]. As an example, Than et al. [18] have developed
a DEM model for investigating the plastic response of wet granular material under compression. Also, based on DEM technique, Xie et al. [19] have pointed out the influence of
interlayer on the strength and deformation of layered rock specimens in uniaxial tests. In
another study, Tran et al. [2] have employed DEM algorithm to simulate the behavior of
concrete under triaxial loading. Xu et al. [20] have proposed a comparison between DEM
simulation and experiments while investigating the mechanical behavior of sea ice. Lommen et al. [17] have studied the relationship between particle stiffness and bulk material
behavior in a numerical simulation context. Furthermore, the combination of DEM and
other numerical techniques has been performed by Dratt and Katterfeld [21]. The authors
have combined DEM with Finite Element Method (FEM) for investigating the dynamic
deformation of machine parts in contact with particle flow. Besides, Zhou et al. [22] have
combined DEM with Computational Fluid Dynamics (CFD) for modeling granular flow
in hydraulic conveyor. So far, studies involving DEM technique could strongly improve
the investigation of mechanical properties of particulate systems by enabling an access to
the local behavior in a granular media. Such numerical simulation technique could also
save time and cost compared with complex experiments in the design and development
of machinery involving particulate systems.
In this study, DEM model was developed for investigating the transmission of stress
in granular media under the compression force. To this aim, the following steps were
adopted as a methodology. First, a set of DEM parameters for the granular media was
collected in the available literature, involving dimensional, gravimetric, mechanical, and
interaction properties. Precisely, the DEM parameters were the size distribution, shape,
mass density, Young’s modulus, Poisson’s ratio, shear modulus, coefficient of static friction, coefficient of rolling friction and coefficient of restitution. In a second step, a compression test was designed and performed using DEM simulations. Simultaneously, local mechanical information of particles was recorded, including the stress, force chain
transmission and so on. The obtained results allowed exploring the ability of DEM technique in a mechanical context. Moreover, the features of DEM method were exposed to
monitoring and analyzing the displacements and forces of all particles in the considered
granular media.
Numerical investigation of force transmission in granular media using discrete element method
155
2. MATERIALS AND METHODS
2.1. Brief introduction to DEM
DEM was developed based on the simulation of the motion of separate particles in
a granular medium [23]. Such motion is determined by solving Newton’s translational
and rotational equations of motion for individual particles. The translational equation of
motion is given as below [24]
mi
dvi
=
dt
∑ Fij + mi g ,
(1)
j
where mi is the mass of particle i, vi is the velocity, t is the time, Fij is the force of contact
acting on the particle i from the particle j, and g is the gravity. The rotational equation of
the motion is expressed as follow [23]
Ii
dωi
=
dt
∑ Tij ,
(2)
j
where Ii is the moment of inertia, ω i is the angular velocity, and Tij is the torque acting on
the particle i from the particle j. In a DEM model, the contact force is commonly modeled
by spring, dashpot, and frictional slider [25, 26]. One of the most used contact models is
the Hertz–Mindlin model [27], involving various parameters such as Young’s modulus,
Poisson’s ratio, shear modulus, coefficient of static friction, coefficient of rolling friction
and coefficient of restitution [28]. These coefficients, relating the relationships between
particle/particle and particle/wall, were introduced to characterize the loss of energy
when the particles interact. Based on this principle, DEM simulation could reflect the
interactions occurring inside the granular media [18]. Underlying assumptions of DEM
model include isotropy and elasticity of the considered particles.
On the other hand, the spherical element is the fundamental element in a DEM
model. The description of DEM model is well documented in Lommen et al. [17] and
Xie et al. [19]. One of the first applications of DEM was carried out by Cundall and Strack
for investigating the mechanics of rock and soil [1]. Recently, the fast growth of computational capacity makes it more and more practical to employ numerical methods for solving engineering problems [16]. To date, many works using DEM technique for investigating the mechanical properties of granular materials have been published [2,20,29–31].
2.2. Description of compression test
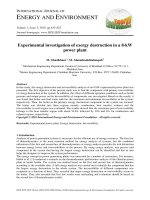
The compression test used in this study is schematized in Fig. 1. Granular material
with characteristics introduced in Tab. 1 was filled into a box container of 400 × 100 ×
300 mm. The initial height of the granular medium was 280 mm, exhibiting more than
47.000 particles. At the top of the container, a compression plate is placed. The latter
can move freely along the vertical direction (z-axis). A confinement force is exerted to
the compression plate, which compresses the granular medium uniformly under a constant loading. Such compression force is a constant normal one applying to the particles,
Nguyen Chung Thong, Le Minh Lu, Ly Hai Bang and Le Tien Thinh
3
On the other hand, the spherical element is the fundamental element in a DEM model. The
description of DEM model is well documented in Lommen et al. [17] and Xie et al. [19]. One of the first
applications of DEM was carried out by Cundall and Strack for investigating the mechanics of rock and
soil [1]. Recently, the fast growth of computational capacity makes it more and more practical to employ
numerical methods for solving engineering problems [16]. To date, many works using DEM technique
for investigating the mechanical properties of granular materials have been published [2,20,29–31].
2.2. Description of compression test
156
Thong test
Chung
Nguyen,
MinhisLe,schematized
Hai-Bang Ly,
Le
The compression
used
in thisLustudy
inTien-Thinh
Fig. 1. Granular
material with
characteristics introduced in Table 1 was filled into a box container of 400x100x300 mm. The initial
height of the granular medium was 280 mm, exhibiting more than 47.000 particles. At the top of the
whereas the
forcea compression
acting onplate
theis upper
part
x-direction
perpendicular
to the norcontainer,
placed. The
latterin
canthe
move
freely along theisvertical
direction (z-axis).
confinement
is exerted to
the compression
plate,awhich
compresses
granular
medium
mal force,Awhich
wasforce
previously
mentioned.
Such
design
of thethe
test
allows
characterizuniformly under a constant loading. Such compression force is a constant normal one applying to the
ing the transmission
oftheforce
theongranular
medium
locally,
under compression
particles, whereas
force in
acting
the upper part
in the x-direction
is perpendicular
to the normal using a
force,
which
was
previously
mentioned.
Such
a
design
of
the
test
allows
characterizing
the
transmission
numerical DEM approach.
of force in the granular medium locally, under compression using a numerical DEM approach.
Fig. 1. Design
of compression
instudy.
this study
Fig. 1. Design
of compression testtest
in this
2.3. DEM input parameters
In this
study, the mechanical behavior of agricultural granular materials was investigated, such as
2.3. DEM input
parameters
dry soybean grains (Glycine max variety, moisture content lower than 10%) to develop and design the
In thisseeding
study,
the The
mechanical
behavior
of agricultural
granular
materials
was invesmachine.
microscopic parameters
of soybean
particles are commonly
represented
based on
four categories,
in the following.
tigated, such
as dry assoybean
grains (Glycine max variety, moisture content lower than
The first
includes
such as
the true
density. The second
category of soy10%) to develop
andcategory
design
the gravimetric
seeding properties
machine.
The
microscopic
parameters
includes dimensional properties, especially size (i.e., equivalent diameter) and shape. The third category
bean particles
are
commonly
represented
basedYoung’s
on four
categories,
as in
the
includes
mechanical
properties,
such as shear modulus,
modulus,
and Poisson’s
ratio.
Thefollowing.
last
category
includes the
interaction properties,
such asproperties
friction (coefficient
of static
friction
particle/particle
The first
category
includes
gravimetric
such
as the
true
density. The secand particle/wall,
coefficient of rolling
friction particle/particle
and particle/wall),
restitutiondiameter)
ond category
includes dimensional
properties,
especially size
(i.e., equivalent
(coefficient of restitution particle/particle, and particle/wall). It should be noticed that the calibration of
and shape. The third category includes mechanical properties, such as shear modulus,
Young’s modulus, and Poisson’s ratio. The last category includes the interaction properties, such as friction (coefficient of static friction particle/particle and particle/wall,
coefficient of rolling friction particle/particle and particle/wall), restitution (coefficient
of restitution particle/particle, and particle/wall). It should be noticed that the calibration of all microscopic parameters for soybean grains is not an easy task 32]. Thus, in this
study, the microscopic parameters (i.e., DEM input parameters) of particles were taken
from the available literature of Ghodki et al. [32], as it was reported for the same variety
of soybean. Moreover, Ghodki et al. [32] have admitted a single sphere modeling for the
shape of particles, which allowed reducing the computational time considerably compared to multi-spheres or superquadric approaches [33]. It should be noticed that such
single sphere modeling was selected based on the shape characterization of the considered particles [32].
In this study, the LIGGGHTS R code (stand for Open Source Discrete Element Method
Particle Simulation) was used for the DEM simulations [34]. A no-cohesion nonlinear
Hertz–Mindlin model was used for simulating the contact between particle-particle and
Numerical investigation of force transmission in granular media using discrete element method
157
particle-wall, as recommended by various works, such as Raji et al. [25], or Horabik et
al. [35]. Tab. 1 indicates the details of DEM simulation performed in this study, including
the DEM input parameters collected from the available literature [32]. The simulations
Table 1. Parameters of DEM simulations in this study
Parameter
Description and value
Unit
Sliding friction: Hertz-Mindlin
Contact model
Rolling friction: constant directional torque
Cohesion: none
m/s2
Gravity
9.81
Particle shape model
Spherical
Time step
1e-5
s
Particle size
6.24
mm
True density of particles
1220
kg/m3
Young’s modulus of particles
50
MPa
Poisson’s ratio of particles
0.26
Shear modulus of particles
19.84
MPa
Young’s modulus of wall
3000
MPa
Poisson’s ratio of wall
0.37
Shear modulus of wall
1095
Coefficient of static friction particle/particle
0.26
Coefficient of static friction particle/wall
0.30
Coefficient of restitution particle/particle
0.17
Coefficient of restitution particle/wall
0.35
Coefficient of rolling friction particle/particle
0.08
Coefficient of rolling friction particle/wall
0.08
Length of container
400
mm
Width of container
100
mm
Number of particles
47362
Initial fill height
280
mm
Final height
200
mm
Mesh of wall
Triangular type (STL)
Number of elements (container and plate)
15604
Element area
Average: 7.06e-5
m2
Minimum angle
Average: 54.15
˚
Aspect ratio
Average: 1.05
Velocity of compression plate
10−1
MPa
m/s
158
Chung Nguyen, Lu Minh Le, Hai-Bang Ly, Tien-Thinh Le
NguyenThong
Chung
Thong, Le Minh Lu, Ly Hai Bang and Le Tien Thinh
5
were performed
using
a(container
Lenovo
Intel
5 of
Chung
Thong,
LeThinkPad
Minh
Lu, Lu,
Ly L420
Hai
Bang
andCore
Le Tien
Thinh
Chung
Thong,
Le Minh
Ly Hai
Bang
and
Lei5-2520M
Tien
Thinh 2.50 GHz, 58 Gb
NumberNguyen
of Nguyen
elements
and
plate)
15604
RAM, whereas the post-treatments were performed by using Matlab R2018a 2[36] and
Element area
Average: 7.06e-5
m
Paraview 5.4.1 [37].
Number
of elements
(container
and and
plate)
Number
ofangle
elements
(container
plate) 15604
15604
Minimum
Average: 54.15
°
In order to ensure the relevance of the selected set of DEM input 2parameters,
in2
Element
area
Average:
7.06e-5
m
Element
area
Average:
7.06e-5
m
ratio1, size characterization and siloAverage:
1.05tests were performed. More
dicatedAspect
in Tab.
discharge
Minimum
Average:
54.15
Minimum
angle
° °
Velocity
ofangle
compression
plate allowedAverage:
10-154.15
m/s of parprecisely,
the size
characterization
obtaining
a particle size distribution
Aspect
Average:
Aspect
ratioratio
Average:
1.051.05
ticles (for generating particle diameter in DEM
simulations), whereas the silo discharge
Velocity
of compression
Velocity
of compression
plateplate
10-110-1
m/sm/s
test allowed checking the efficiency of friction coefficients (i.e., static and rolling frictions
In order to ensure the relevance of the selected set of DEM input parameters, indicated in Table
particle/particle). Brief details of these two investigations are following.
1, size characterization and silo discharge tests were performed. More precisely, the size characterization
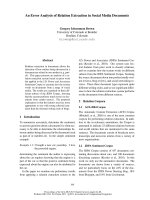
The
of
particles
was
using
aparticle
home-made
imaging
Insize
order
to ensure
the relevance
of the
selected
setconducted
of DEM
input
parameters,
indicated
in Table
In order
to characterization
ensure
relevance
the
selected
of
DEM
input
parameters,
indicated
in Table
allowed
obtaining
a the
particle
size of
distribution
ofset
particles
(for
generating
diameter
in DEM
2 silo
1,
size
characterization
and
discharge
tests
were
performed.
More
precisely,
the
size
characterization
1,
size
characterization
and
silo
discharge
tests
were
performed.
More
precisely,
the
size
characterization
platform
(4.42
MP/cm
pixel
density
Fujifilm
X-E2S
camera
with
a
Fujinon
XF18-55mm
simulations), whereas the silo discharge test allowed checking the efficiency of friction coefficients (i.e.,
allowed
obtaining
a particle
size
distribution
of an
particles
(for
generating
particle
diameter
in mm
DEM(recallowed
obtaining
a frictions
particle
size
distribution
of Brief
particles
(forof
generating
diameter
inper
DEM
F2.8-4
R
OIS
lens),
allowed
obtaining
image
resolution
of 16
pixels
static
andLM
rolling
particle/particle).
details
these
twoparticle
investigations
are
following.
simulations),
whereas
the silo
discharge
allowed
checking
the efficiency
of friction
coefficients
simulations),
whereas
the silo
discharge
test test
allowed
checking
the efficiency
of friction
coefficients
(i.e.,(i.e.,
ommended
forcharacterization
characterizing
particles
greater
than
3 two
mm
in size are
[38]).
Soybean
grains
static
and
rolling
frictions
particle/particle).
Brief
details
of these
are
following.
sizefrictions
of particles
was
conducted
using
ainvestigations
home-made
imaging
platform (4.42
static
andThe
rolling
particle/particle).
Brief
details
of these
two
investigations
following.
were
randomly
selected
for
capturing
images
(about
900
grains
were
tested).
Fig.
2(a)
MP/cm²
pixel
density
Fujifilm
camera
with using
a Fujinon
XF18-55mm
F2.8-4
R LM
OIS lens),
The
size
characterization
ofX-E2S
particles
was
conducted
using
a home-made
imaging
platform
(4.42
Thethe
size
characterization
of particles
was
conducted
a home-made
imaging
platform
(4.42
shows
raw
image,
whereas
Fig.
2(b)
presents
the
processed
binary
image
indicating
allowed
obtaining
an
image
resolution
of 16
pixels
mm
(recommended
for
particles
MP/cm²
pixel
density
Fujifilm
X-E2S
camera
with
aper
Fujinon
XF18-55mm
F2.8-4
R LM
lens),
MP/cm²
pixel
density
Fujifilm
X-E2S
camera
with
a Fujinon
XF18-55mm
F2.8-4
R characterizing
LM
OISOIS
lens),
the
equivalent
diameter
of
each
particle.
The
equivalent
diameter
was
computed
based
greater
than
3
mm
in
size
[39]).
Soybean
grains
were
randomly
selected
for
capturing
images
(about
allowed
obtaining
an image
resolution
of pixels
16 pixels
(recommended
characterizing
particles
allowed
obtaining
an image
resolution
of 16
per per
mmmm
(recommended
for for
characterizing
particles
on
the
obtained
area
of
the
particle.
Using
900
equivalent
diameters,
the
particle
size
dis900
grains
were
tested).
Fig.
2a
shows
the
raw
image,
whereas
Fig.
2b
presents
the
processed
greater
than
3
mm
in
size
[39]).
Soybean
grains
were
randomly
selected
for
capturing
images
(about
greater than 3 mm in size [39]). Soybean grains were randomly selected for capturing images (about binary
image
indicating
thein
equivalent
each
particle.
The
equivalent
diameter
was computed
tribution
is shown
Fig.
exhibiting
an
average
ofFig.
6.33
and
a standard
deviation
900
grains
were
tested).
Fig.
2a diameter
shows
image,
whereas
2bmm
presents
processed
binarybased
900
grains
were
tested).
Fig.
2a 2(c),
shows
the the
rawofraw
image,
whereas
Fig.
2b presents
the the
processed
binary
the
obtained
area
of the
particle.
900
equivalent
diameters,
thewas
particle
size based
distribution
image
indicating
the
equivalent
diameter
of each
particle.
The
equivalent
diameter
was
computed
based inis
image
indicating
theis
equivalent
diameter
ofUsing
each
particle.
Thediameter
equivalent
diameter
computed
ofon
0.46
mm.
It
seen
that
the
average
particle
obtained
by
image
analysis
on
the
obtained
area
of
the
particle.
Using
900
equivalent
diameters,
the
particle
size
distribution
issoyshown
in
Fig.
2c,
exhibiting
an
average
of
6.33
mm
and
a
standard
deviation
of
0.46
mm.
It
is
that
on
the
obtained
area
of
the
particle.
Using
900
equivalent
diameters,
the
particle
size
distribution
is seen
this study was very close to the result obtained by Ghodki et al. [32] for the same
shown
in Fig.
2c, exhibiting
an average
of by
6.33
mm
a standard
deviation
ofwas
0.46
mm.
Itseen
is seen
that result
shown
in Fig.
2c,particle
exhibiting
an average
of 6.33
mm
andand
aanalysis
standard
deviation
of 0.46
mm.
It isclose
thatthe
the
average
diameter
obtained
image
in
this
study
very
to
bean
variety
(i.e., 6.24
mm).obtained
Finally,bythe
particle
size
distribution
was
used
for
generating
the
average
particle
diameter
image
analysis
in this
study
was
very
close
tothe
the
result size
theobtained
average
particle
diameter
by image
analysis
in
this
study
was
very
close
to the
result
by
Ghodki
et al. obtained
[33] for the
same
soybean
variety
(i.e.,
6.24
mm).
Finally,
particle
particle
diameter
in
DEM
simulations.
obtained
by Ghodki
al. [33]
for the
same
soybean
variety
mm).
Finally,
particle
obtained
by Ghodki
et al.et [33]
for the
same
soybean
variety
(i.e.,(i.e.,
6.246.24
mm).
Finally,
the the
particle
sizesize
distribution was used for generating particle diameter in DEM simulations.
distribution
for generating
particle
diameter
in DEM
simulations.
distribution
waswas
usedused
for generating
particle
diameter
in DEM
simulations.
(a)
(b)
(c)
Fig.
Size
characterization
ofofparticles
inin
this
study:
(a)(a)
raw
image,
(b) processed
image
with
an
equivalent
Fig.Fig.
2. Size
characterization
of particles
in this
study:
(a) raw
image,
(b) processed
image
with
an equivalent
2.2.Size
characterization
particles
this
study:
raw
image,
(b) processed
image
with
an equivalent
diameter
of
particle,
(c)(c)
particle
distribution
image
analysis.
diameter
of each
particle,
and and
(c)and
particle
size size
distribution
fromfrom
image
analysis.
diameter
ofeach
each
particle,
particle
size
distribution
from
image
analysis.
Fig. 2. Size characterization of particles in this study: (a) raw image, (b) processed image with an
Regarding
the
a aflat-bottomed
rectangular
silo
of 160
and
100
of
length
and and
equivalent
diameter
of each
and (c)
particle
size
from
analysis
Regarding
the discharge
test,test,
aparticle,
flat-bottomed
rectangular
silo
ofdistribution
160
and
100and
mmmm
ofimage
length
and
Regarding
the discharge
discharge
test,
flat-bottomed
rectangular
silo
of 160
100
mm
of
length
width,
respectively,
together
with
a circular
orifice
ofmm
50 mm
of diameter,
was
prepared.
Aof
kgsoybean
of soybean
width,
respectively,
together
with
a
circular
orifice
of
50
of
diameter,
was
prepared.
A
kg
width, respectively, together with a circular orifice of 50 mm of diameter, was prepared. A kg of soybean
particles
was
randomly
selected
filled
the
silo,
exhibiting
fill height
of 100
In the
DEM
particles
waswas
randomly
selected
and and
filled
intointo
the
silo,
exhibiting
a filla height
of
100
mm.mm.
In the
DEM
particles
randomly
selected
and
filled
into
the
silo, exhibiting
a fillcritical
height
100
mm.
In the
DEM
Regarding
the
discharge
test,
a flat-bottomed
rectangular
silo
ofof
160
100
mm
of
simulation,
same
procedure
applied.
friction
plays
inand
the
rheology
simulation,
the the
same
procedure
waswas
applied.
As As
friction
plays
the the
mostmost
critical rolerole
in the
rheology
simulation,
the
same
procedure
was
applied.
As
friction
plays
the
most
critical
role
in
the
rheology
length
and
width,
respectively,
together
with
a
circular
orifice
of
50
mm
of
diameter,
was
behavior
of
granular
materials
[32],
the
efficiency
of
the
selected
coefficients
of
static
and
rolling
behavior of granular materials [32], the efficiency of the selected coefficients of static and rolling
behavior
ofAgranular
materials
[32],
the
efficiency
of this
thethis
selected
of
static
rolling
frictions
particle/particle
(see
Table
1) were
checked
based
on
test.
Tocoefficients
this
in DEM
simulation,
prepared.
kg of soybean
particles
was
randomly
selected
and
filled
into
theand
silo,
exfrictions
particle/particle
(see
Table
1)
were
checked
based
on
test.
To this
aim,aim,
in
DEM
simulation,
frictions
particle/particle
(see
Table
1)
were
checked
based
on
this
test.
To
this
aim,
in
DEM
simulation,
the
coefficient
of static
friction
was
a 0.18-0.34
range
with
a step
of 0.04,
whereas
the
the
coefficient
static
friction
was
varied
in DEM
ain0.18-0.34
range
with
asame
step
of
0.04,
whereas
hibiting
a fillofheight
of 100
mm.
Invaried
the
simulation,
the
procedure
wasthe
applied.
the coefficient
offriction
staticwas
friction
was
varied
in
a -0.18-0.34
aA step
of 0.04,
whereas the
of rolling
varied
between
0.05
0.14
arange
step
ofwith
0.03.
macroscopic
property,
coefficient
of rolling
varied
between
0.05
- 0.14
withwith
a step
of 0.03.
Aofmacroscopic
property,
Ascoefficient
friction
plays
thefriction
mostwas
critical
role
in
the
rheology
behavior
granular
materials
[39],
coefficient
of
rolling
friction
was
varied
between
0.05
0.14
with
a
step
of
0.03.
A
macroscopic
the
final
mass
retained
in
the
silo
after
discharged,
was
chosen
to
make
comparisons
between
experiment
the
final
mass retained
in theselected
silo after discharged,
wasof
chosen
to make
comparisons
betweenparticle/particle
experimentproperty,
the
efficiency
of
the
coefficients
static
and
rolling
frictions
final
mass
retained in the silo after discharged, was chosen to make comparisons between experiment
and
DEM
simulations.
andthe
DEM
simulations.
and DEM simulations.
Numerical investigation of force transmission in granular media using discrete element method
159
(see Tab. 1) were checked based on this test. To this aim, in DEM simulation, the coefficient of static friction was varied in a 0.18–0.34 range with a step of 0.04, whereas the
coefficient of rolling friction was varied between 0.05–0.14 with a step of 0.03. A macroscopic property, the final mass retained in the silo after discharged, was chosen to make
comparisons between experiment and DEM simulations.
6
3.
RESULTS
Nguyen
Chung Thong,AND
Le MinhDISCUSSIONS
Lu, Ly Hai Bang and Le Tien Thinh
6
Nguyen Chung Thong, Le Minh Lu, Ly Hai Bang and Le Tien Thinh
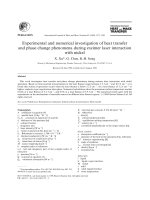
3.1. Validation
of numerical
model
3. RESULTS AND DISCUSSIONS
In this3.1.
section,
the numerical
DEM model
is compared with experimental work in the
3. model
RESULTS
AND DISCUSSIONS
Validation of numerical
literature3.1.
to Validation
evaluateofthe
effectiveness
of
the
model.
3(a) presents the initial assembly
numerical
modelDEM model is comparedFig.
In this section,
the numerical
with experimental work in the literature
of particles
in
the
box
container,
described
in
Section
2.2,
whereas
Fig. 3(b)
shows the
to evaluate
effectiveness
of theDEM
model.
Fig. is
3acompared
presents the
assembly
of particles
in the box
In thisthe
section,
the numerical
model
withinitial
experimental
work
in the literature
in Section
2.2,model.
whereas
Fig.3a3b
shows
initial
force
chainofnetwork
thethe
medium,
initial force
chaindescribed
ofofthe
medium,
as
wellthe
a visualization
ofof in
the
compression
tocontainer,
evaluate
thenetwork
effectiveness
the
Fig.
presents
theas
initial
assembly
particles
box
as
asdescribed
a visualization
of the
compression
and itsthe
triangular
mesh.
inmesh.
Section
2.2,
whereas Fig.plate
3b shows
initial force
chain network of the medium,
plate andcontainer,
itswell
triangular
as well as a visualization of the compression plate and its triangular mesh.
(a)
Fig. 3.
(b)
Fig. 3. Visualization of: (a) particle assembly at initial configuration and (b) initial force chain network and
Fig. 3. Visualization of: (a) particlecompression
assembly at initial
configuration
(b) initial force chain network and
plate with
triangularand
mesh.
Visualization of: (a) particle
assembly
and (b) initial force
compression
plate at
withinitial
triangularconfiguration
mesh.
chain
As recommended
byand
various
works in theplate
literature
[10,40],
the coefficient
static friction
network
compression
with
triangular
mesh ofstatic
As recommended
by various
in of
thetheliterature
[10,40],
coefficient
particle/particle
is characterized
by works
the ratio
shear stress
to thethe
normal
stress,of
while thefriction
granular
particle/particle
is characterized
shear stressthe
to the
normal
stress,
while
the granular
material is subjected
to loading.byInthe
thisratio
caseofofthe
compression,
stresses
in the
x-axis
(tangential
to the
material
subjected
to loading.
this
case of compression,
the stresses
in the40],
x-axis
(tangential
toby
thetheof static
directionis of
compression)
and In
z-axis
(normal
to the
of compression)
were
calculated
As recommended
by
various
works
in
thedirection
literature
[10,
the
coefficient
direction
of compression)
andforces.
z-axisMore
(normal
to the such
direction
of compression)
werebased
calculated
the
corresponding
wall reaction
precisely,
reactions
were calculated
on theby
reaction
friction particle/particle
ismesh
characterized
bysuch
the
ratio[40].
ofFigs.
the4ashear
stress
to the normal
corresponding
reaction
forces.
Moreinprecisely,
reactions
were
calculated
on the
forces in eachwall
triangular
element
contact with
particles
andbased
4b show
thereaction
evolution
forces
in each
triangular
mesh
element
contact
withThe
particles
[40]. Figs.
4aIn
andthe
4bshear
show
the evolution
stress, while
the
granular
material
is
subjected
to
loading.
this
case
oftocompression,
of normal
stress
and shear
stress
overin
elapsed
time.
comparison
between
stress
normal
ofstress
normal
stress
and
shear
stress
over
elapsed
time.
The
comparison
between
the
shear
stress
toin
normal
ratio
and
the work
of Ghodki etto
al. the
[33] direction
for the considered
granular material isand
shown
Fig.(normal
4c.
the stresses
in
the
x-axis
(tangential
of
compression)
z-axis
to
stress
ratio and
the[33],
workthe
of Ghodki
et al. [33]
for the
considered
is shown
in Fig. 4c.the
In Ghodki
et al.
inter-particle
friction
coefficient
of granular
0.26 wasmaterial
calibrated
by combining
the direction
of compression)
were
calculated
by
the
corresponding
wall
reaction
forces.
Inexperimental
Ghodki
et al.
[33],
the
inter-particle
friction
coefficient
of
0.26
was
calibrated
by
combining
the
angle of repose test and DEM simulation (calibration result was indicated in Section 3.2
experimental
of repose
test
simulation
(calibration
was
indicated
in increase
Section
More precisely,
reactions
were
calculated
based
onresult
thethe
reaction
in3.2
each trianin Ghodkisuch
etangle
al. [33]).
As can
beand
seenDEM
in Fig.
4c, the normal
stress
on
wall
starts forces
to
when
inthe
Ghodki
et al. [33]).
As
can be with
seen the
in Fig.
4c, the
normal A
stress
onovershoot
the wall starts
to observed,
increase when
compression
plate
contacts
particle
assembly.
small
is
also
due
to
gular mesh
element in
with
particles
[40].AFigs.
4(a) and
4(b)observed,
showdue
theto evolution
the
platecontact
contactsparticles
with
theand
particle
assembly.
overshoot
is plate
also
thecompression
first interactions
between
compression
plate.small
The compression
is vertically
moved
first interactions
between
particles
and compression
plate.
The The
compression
plateelements,
is vertically
of normalthe
shear
stress
over
elapsed
time.
comparison
between
the shear
instress
order
to and
compress
the granular
material
under
constant
velocity.
As for
discrete
themoved
particles
in order to compress
the granular
material
under of
constant
discrete
the particles granular
stress to normal
stress
and
the
work
Ghodki
etAs
al.for[32]
forelements,
the
considered
arranged in
order toratio
respond
to the
loading.
Finally,
the velocity.
granular
medium
reaches
a convergence
in both
arranged in order to respond to the loading. Finally, the granular medium reaches a convergence in both
the normal and
shear
stress.
Such
convergence
exhibits
the the
equilibrium
of the granular mediumcoefficient
under
material is
inshear
Fig.stress.
4(c).Such
In convergence
Ghodki
etexhibits
al. [32],
inter-particle
of
theshown
normal and
the equilibrium
of the granularfriction
medium under
constant loading. As shown in Fig. 4c, the ratio of shear stress to normal stress at equilibrium state under
constant
loading.
As
shown
in
Fig.
4c,
the
ratio
of
shear
stress
to
normal
stress
at
equilibrium
state
under
0.26 was calibrated
byiscombining
the
experimental
angle
of repose
and
DEM simulaconstant loading
highly correlated
compared
with the work
of Ghodki
et al. [33]test
for the
considered
constant loading is highly correlated compared with the work of Ghodki et al. [33] for the considered
granular material,
showing
a high effectiveness
of the proposed
numerical
DEM
model.
tion (calibration
result
was
indicated
in
Section
3.2
in
Ghodki
et
al.
[32]).
As
can be seen
granular material, showing a high effectiveness of the proposed numerical DEM model.
160
Thong Chung Nguyen, Lu Minh Le, Hai-Bang Ly, Tien-Thinh Le
in Fig. 4(c), the normal stress on the wall starts to increase when the compression plate
NguyenisChung
Le Minh Lu,
Ly Hai
Bangfirst
and Le Tien Thinh
contacts with the particle assembly. A small overshoot
alsoThong,
observed,
due
to the
interactions between particles and compression plate. The compression plate is vertically
moved in order to compress the granular material under constant velocity. As for discrete
elements, the particles arranged in order to respond to the loading. Finally, the granular
medium reaches a convergence in both the normal and shear stress. Such convergence
exhibits the equilibrium of the granular medium under constant loading. As shown in
Fig. 4(c), the ratio of shear stress to normal stress at equilibrium state under constant
loading is highly correlated compared with the work of Ghodki et al. [32] for the considered granular material, showing a high effectiveness of the proposed numerical DEM
model.Nguyen
7 7
Chung
Thong,
Le Minh
Lu, Lu,
Ly Hai
Bang
andand
Le Tien
Thinh
Nguyen
Chung
Thong,
Le Minh
Ly Hai
Bang
Le Tien
Thinh
Fig. 4. Evaluation of: (a) normal stress, (b) shear stress, and (c) shear stress / normal stress ratio over time.
(a) Normal
Fig. 4.
8
8
(b) Tangential
(c) Ratio
In addition, the results of the silo discharge test are presented in Fig. 5. Visualization of dischar
flow at different colored layers in a slice view mode is presented in Fig. 5a, showing the retention zo
in the
silo. and
Fig. 5b
the stress/normal
difference Δm between mass retained in the silo from DE
Evaluation of: (a) normal stress,
(b)flat-bottomed
shear stress,
(c)shows
shear
simulations and experiment, in function of the friction coefficients particle/particle. It is shown that t
stress difference
ratio over
time
Δm could vary between 2 and 30 g. The mass retained in the experiment was 176.7 g. It
seen
that
the
couple
of (0.26,
0.08)
allowed
Nguyen
Le Lu,
Minh
Haiand
Bang
Tien
Thinh obtaining the smallest value of Δm (2.1 g). Thus, t
Nguyen
ChungChung
Thong,Thong,
Le Minh
Ly Lu,
HaiLy
Bang
Le and
TienLe
Thinh
efficiency of the selected friction coefficients was confirmed, allowed having more confident results.
4. Evaluation
of: normal
(a) normal
stress,
(b) shear
stress,
(c) shear
stress
/ normal
stress
time.
Fig.Fig.
4. Evaluation
of: (a)
stress,
(b) shear
stress,
and and
(c) shear
stress
/ normal
stress
ratioratio
overover
time.
In addition,
results
of the
discharge
presented
in Fig.
5. Visualization
of discharge
In addition,
the the
results
of the
silosilo
discharge
testtest
are are
presented
in Fig.
5. Visualization
of discharge
at different
colored
layers
a slice
view
mode
is presented
in Fig.
showing
retention
zone
flowflow
at different
colored
layers
in ainslice
view
mode
is presented
in Fig.
5a, 5a,
showing
the the
retention
zone
in the
flat-bottomed
5b shows
difference
between
mass
retained
in the
from
DEM
in the
flat-bottomed
silo.silo.
Fig.Fig.
5b shows
the the
difference
ΔmΔm
between
mass
retained
in the
silosilo
from
DEM
simulations
experiment,
in function
of the
friction
coefficients
particle/particle.
is shown
simulations
andand
experiment,
in function
of the
friction
coefficients
particle/particle.
It isItshown
thatthat
the the
difference
could
between
2 and
30The
g. The
mass
retained
in the
experiment
176.7
difference
ΔmΔm
could
varyvary
between
2 and
30 g.
mass
retained
in the
experiment
waswas
176.7
g. Itg.isIt is
couple
of (0.26,
0.08)
allowed
obtaining
smallest
value
of Δm
Thus,
seenseen
thatthat
the the
couple
of (0.26,
0.08)
allowed
obtaining
the the
smallest
value
of Δm
(2.1(2.1
g). g).
Thus,
the the
efficiency
of the
selected
friction
coefficients
confirmed,
allowed
having
more
confident
results.
efficiency
of the
selected
friction
coefficients
waswas
confirmed,
allowed
having
more
confident
results.
(a)
Fig.
(a)
(a)
(b)
(b)
(b)
Fig. 5. Results of silo discharge test: (a) visualization of particle flow at different colored layers and retention
Fig.(b)
5. evolution
Results ofofsilo
discharge
(a) coefficient
visualization
of particle
flow
at different colored
layers and
retention
in functiontest:
of the
of static
friction
particle/particle
ofcolored
5.zone,
Results
silo Δm
discharge
test:
(a)thevisualization
of particle
flow and
at coefficient
different
zone, (b)of
evolution
of Δm in function
coefficient
of static
friction particle/particle
and coefficient
of layers
rollingof
friction
particle/particle.
and retention zone, (b) evolution
of ∆m
in particle/particle.
function of the coefficient of static friction
rolling
friction
3.2. Investigation
of transmissionand
of force
particle/particle
coefficient of rolling friction particle/particle
3.2. Investigation of transmission of force
In this section, the numerical DEM model was used to investigate the transmission of force in the
In this section,
the numericalFig.
DEM
modelthe
wasevolution
used to investigate
transmission
of force
granular medium
under compression.
6 shows
of particle the
velocity
(z-velocity,
x- in the
granular
under compression.
Fig.at6different
shows the
evolution
of compression
particle velocity
xvelocity,
and medium
velocity magnitude,
respectively)
positions
of the
plate.(z-velocity,
Fig. 7
velocity,
and velocity magnitude,
respectively)
at different
theforce
compression
plate. Fig. 7
presents
the corresponding
configurations
of the granular
medium,positions
includingofthe
chain network
presents the
corresponding
configurations
of the granular
forceparticles
chain network
(z-direction,
x-direction,
and force
magnitude, respectively).
It ismedium,
seen thatincluding
the most the
moving
x-direction,
and force magnitude,
It is seen
that the
moving particles
are (z-direction,
those in contact
with the compression
plate. As therespectively).
compression plate
was moved
in most
the z-direction,
the are
velocity
wasthe
dominant
compared
to As
other
thoseininz-direction
contact with
compression
plate.
thedirections.
compression plate was moved in the z-direction,
the velocity in z-direction was dominant compared to other directions.
Numerical investigation of force transmission in granular media using discrete element method
161
In addition, the results of the silo discharge test are presented in Fig. 5. Visualization
of discharge flow at different colored layers in a slice view mode is presented in Fig. 5(a),
showing the retention zone in the flat-bottomed silo. Fig. 5(b) shows the difference ∆m
between mass retained in the silo from DEM simulations and experiment, in function of
the friction coefficients particle/particle. It is shown that the difference ∆m could vary
between 2 and 30 g. The mass retained in the experiment was 176.7 g. It is seen that the
couple of (0.26, 0.08) allowed obtaining the smallest value of ∆m (2.1 g). Thus, the efficiency of the selected friction coefficients was confirmed, allowed having more confident
results.
3.2. Investigation of transmission of force
In this section, the numerical DEM model was used to investigate the transmission of
force in the granular medium under compression. Fig. 6 shows the evolution of particle
velocity (z-velocity, x-velocity, and velocity magnitude, respectively) at different positions of the compression plate. Fig. 7 presents the corresponding configurations of the
granular medium, including the force chain network (z-direction, x-direction, and force
magnitude, respectively). It is seen that the most moving particles are those in contact
with the compression plate. As the compression plate was moved in the z-direction, the
9
Nguyenwas
Chung
Thong, Le Minh
Lu, Ly Haito
Bang
and directions.
Le Tien Thinh
velocity in z-direction
dominant
compared
other
Fig. 6. Visualization of the velocity field of particles in the granular medium at different positions of the
compression plate.of
The
colorbar
was adapted
for particles
each velocityinfield
order to explore
the mostat
appropriate
Fig. 6. Visualization
the
velocity
field of
theingranular
medium
different positions
vision effect.
of the compression plate. The colorbar was adapted for each velocity field in order to explore the
Regarding the force chain most
network
(Fig. 7), at vision
initial configuration
(without loading from
appropriate
effect
compression plate), the force chains with low amplitude were created at the bottom of the granular
medium, showing the influence of the weight of particles at the top level. However, at initial
configuration, the force chains generally had no specific orientations, i.e., the contact forces were
uniformly distributed in the medium. When the compression plate contacts with the medium at heights
of 270, 260, and 230 mm, the force chains were progressively created, also in increasing amplitude. The
contact forces in the z-direction were significant compared to those in the x-direction. This is also proved
when regarding the velocity field (Fig. 6). This exciting result showed how the compression forces were
transmitted through the particulate system. The orientations of force chains are mainly parallel to the
vertical axis, which is the direction of the compression loading. The transmission network also provides
information on the structural arrangement, related to the change of the microstructure to respond to the
162
Thong Chung Nguyen, Lu Minh Le, Hai-Bang Ly, Tien-Thinh Le
Regarding the force chain network (Fig. 7), at initial configuration (without loading
from compression plate), the force chains with low amplitude were created at the bottom
of the granular medium, showing the influence of the weight of particles at the top level.
However, at initial configuration, the force chains generally had no specific orientations,
i.e., the contact forces were uniformly distributed in the medium. When the compression
plate contacts with the medium at heights of 270, 260, and 230 mm, the force chains were
progressively created, also in increasing amplitude. The contact forces in the z-direction
were significant compared to those in the x-direction. This is also proved when regarding
the velocity field (Fig. 6). This exciting result showed how the compression forces were
transmitted through the particulate system. The orientations of force chains are mainly
parallel to the vertical axis, which is the direction of the compression loading. The transmission network also provides information on the structural arrangement, related to the
10
Nguyen Chung Thong, Le Minh Lu, Ly Hai Bang and Le Tien Thinh
change of
the microstructure
to respond to the loading.
Fig. 7. Visualization of force chain network in the granular medium at different positions of compression plate.
The colorbar
was adapted
each case in
in order
explore themedium
most appropriate
vision effect.
Fig. 7. Visualization
of force
chainfor
network
the togranular
at different
positions of compression plate. The colorbar was adapted for each case in order to explore the most appropriate
vision effect
Fig. 8(a) presents the increase of number of contact forces in function of fill height,
normalized to the number of contact force at initial configuration (i.e., 100%), whereas
Fig. 8(b) shows the evolution of the number of contact forces in function of elapsed time.
Fig. 8. Evaluation of the number of contact forces in function of (a) fill height and (b) elapsed time.
Fig. 8a presents the increase of number of contact forces in function of fill height, normalized to
the number of contact force at initial configuration (i.e., 100%), whereas Fig. 8b shows the evolution of
the number of contact forces in function of elapsed time. It is seen that the number of contact forces
Numerical investigation of force transmission in granular media using discrete element method
163
It is seen that the number of contact forces linearly increased, as expected, because of
the uniform movement of the compression plate. At the equilibrium state, the number
of contact forces was increased by about 170% and remained a horizontal asymptotic, as
seen in Fig. 8(b). The average and standard deviation values of the probability density
distribution of the force chain network are also presented in Fig. 9(a), and 9(b), respectively, in function of fill height. As the compression is in the z-direction, the mean value
of the contact force in the z-direction was the highest. However, contact forces exhibit approximately the similar standard deviation values in all the directions. Finally, Fig. 9(c)
presents the statistical distribution of the magnitude of contact forces, including their average and standard deviation. Statistically, the contact forces increase in both amplitude
Fig.
Visualization
of force chain network in the granular medium at different positions of compression plate.
and7.Fig.
standard
deviation.
7. Visualization of force chain network in the granular medium at different positions of compression plate.
The colorbar was adapted for each case in order to explore the most appropriate vision effect.
The colorbar was adapted for each case in order to explore the most appropriate vision effect.
Fig.
8. Evaluation
ofnumber
the number
of contact
forces
in function
heightand
and(b)
(b)elapsed
elapsedtime.
time.
Fig. 8.
Evaluation
of (a)
the
of contact
forces
in function
of of
(a)(a)
fillfill
height
(b)
Fig.presents
8a presents
the increase
of number
of contact
forces
functionofoffill
fillheight,
height,normalized
normalized to
to
Fig. 8a
the increase
of number
of contact
forces
in in
function
the
of contact
at initial
configuration
(i.e.,
100%),
Fig.8b8bshows
shows
the
evolution
of
the
number
of contact
at initial
(i.e.,
100%),
whereas
the
evolution
of
Fig.
8. number
Evaluation
offorce
theforce
number
ofconfiguration
contact
forces
in
function
ofwhereas
(a) fillFig.
height
and
(b)
elapsed
time
the number
of contact
forces
in function
of elapsed
time.
It is
seenthat
thatthe
thenumber
numberofofcontact
contact forces
forces
the number
of contact
forces
in function
of elapsed
time.
It is
seen
The force vectors presented in Fig. 9 were employed to calculate the total force exerted on each particle in the system. At the maximum compression point of 200 mm
of height, Fig. 10(a) presents the histogram of the number of particles in contact with a
given particle, whereas the histogram of total force exerted on all the particles is shown
in Fig. 10(b). The total force exerted on a given particle was calculated by the sum of
all the contact forces of its surrounding particles. It can be noticed that at the maximum
compression point of 200 mm, each particle was exposed to an average of 8 surrounding
particles, whereas the average of total force exerted was 33 N, with a standard deviation
of about 13 N.
In Appendix, the measurement of the critical breakage force that causes the soybean
grains to crack is presented. Results showed that the critical compressive force was in
the range of 50-70 N (approximately 1.5 mm of particle deformation). Based on the results obtained (Fig. 10(b)) and the measurement of breakage force, it can be seen that the
200 mm compression point was a critical limit for maintaining the bond between particles. If the compression increased further, the total force exerted on particles would also
increase, leading to the destruction of particle bonds.
Nguyen Chung Thong, Le Minh Lu, Ly Hai Bang and Le Tien Thinh
11
linearly increased, as expected, because of the uniform movement of the compression plate. At the
equilibrium state, the number of contact forces was increased by about 170% and remained a horizontal
asymptotic, as seen in Fig. 8b. The average and standard deviation values of the probability density
distribution of the force chain network are also presented in Fig. 9a, and 9b, respectively, in function of
fill height. As the compression is in the z-direction, the mean value of the contact force in the z-direction
was the highest. However, contact forces exhibit approximately the similar standard deviation values in
all the directions. Finally,
distribution
of the magnitude
contact
forces,
164 Fig. 9c presents the statistical
Thong
Chung Nguyen,
Lu MinhofLe,
Hai-Bang
Ly, Tien-Thinh Le
including their average and standard deviation. Statistically, the contact forces increase in both
amplitude and standard deviation.
12 12
Nguyen
Chung
Thong,
LeLe
Minh
Lu,Lu,
LyLy
Hai
Bang
and
LeLe
Tien
Thinh
Nguyen
Chung
Thong,
Minh
Hai
Bang
and
Tien
Thinh
Fig.
9. Evaluation
of of
contact
force
at different
fillfill
heights:
(a)(a)
average
value,
(b)(b)
standard
deviation
value,
and
Fig.
9. Evaluation
contact
force
at different
heights:
average
value,
standard
deviation
value,
and
(a)
(b)
(c)(c)
contact
force
magnitude.
contact
force
magnitude.
The
force
vectors
presented
in in
Fig.
9 were
employed
to to
calculate
thethe
total
force
exerted
The
force
vectors
presented
Fig.
9 were
employed
calculate
total
force
exertedononeach
each
particle
in in
thethe
system.
AtAt
thethe
maximum
compression
point
ofof
200
mm
ofof
height,
Fig.
10a
particle
system.
maximum
compression
point
200
mm
height,
Fig.
10apresents
presentsthethe
histogram
of of
thethe
number
of of
particles
in in
contact
with
a given
histogram
number
particles
contact
with
a givenparticle,
particle,whereas
whereasthethehistogram
histogramofoftotal
total
force
exerted
onon
allall
thethe
particles
is is
shown
in in
Fig.
10b.
The
total
force
exerted
onona given
force
exerted
particles
shown
Fig.
10b.
The
total
force
exerted
a givenparticle
particlewas
was
calculated
byby
thethe
sum
of of
allall
thethe
contact
forces
of of
itsits
surrounding
particles.
It It
can
bebe
noticed
calculated
sum
contact
forces
surrounding
particles.
can
noticedthat
thatat atthethe
maximum
compression
point
of of
200
mm,
each
particle
was
maximum
compression
point
200
mm,
each
particle
wasexposed
exposedto toananaverage
averageofof8 8surrounding
surrounding
particles,
whereas
thethe
average
of of
total
force
exerted
was
3333
N,N,
with
a standard
deviation
ofof
about
1313
N.N.
particles,
whereas
average
total
force
exerted
was
with
a standard
deviation
about
In In
thethe
Appendix,
thethe
measurement
of of
thethe
critical
breakage
force
that
causes
thethe
soybean
grains
toto
Appendix,
measurement
critical
breakage
force
that
causes
soybean
grains
crack
presented.
Results
showed
that
criticalcompressive
compressiveforce
forcewas
wasininthetherange
rangeofof50-70
50-70NN
crack
is is
presented.
Results
showed
that
thethecritical
(approximately
mm
particledeformation).
deformation).Based
Basedononthetheresults
resultsobtained
obtained(Fig.
(Fig.10b)
10b)and
andthethe
(approximately
1.51.5
mm
of ofparticle
(c)
measurement
breakage
force,
it can
seen
that
200
mm
compression
pointwas
wasa critical
a criticallimit
limit
measurement
of of
breakage
force,
it can
bebe
seen
that
thethe
200
mm
compression
point
maintaining
bond
between
particles.
compression
increased
further,
total
force
exerted
forfor
maintaining
thethe
bond
between
particles.
If If
thethe
compression
increased
further,
thethe
total
force
exerted
Fig. 9. Evaluation of contact force at different fill heights: (a) average value, (b) standard deviation
particles
would
also
increase,
leading
destruction
particle
bonds.
onon
particles
would
also
increase,
leading
to to
thethe
destruction
ofof
particle
bonds.
value, and (c) contact force magnitude
Fig.
Evaluation
contact
force
at Height
= 200
mm:
number
particles
in
contact,
distribution
Fig.
10.10.
Evaluation
of of
contact
at Height
= 200
mm:
(a)(a)
number
of of
particles
in(b)
contact,
(b)(b)
distribution
ofof
(a) force
total
force
exerted
particles.
total
force
exerted
onon
particles.
Fig. 10. Evaluation of contact force at Height = 200 mm: (a) number of particles in contact,
(b) distribution of total force exerted on particles
3.3. Discussions
3.3. Discussions
The
main
findings
this
work
could
summarized
followings:
The
main
findings
of of
this
work
could
bebe
summarized
asas
thethe
followings:
calibration
procedure
a numerical
DEM
model
a granularassembly
assemblywas
was
• •AA
calibration
procedure
of of
a numerical
DEM
model
forfor
a granular
presented
and
validated
with
experimental
data;
presented
and
validated
with
experimental
data;
The
DEM
model
was
developed,
allowed
investigating
transmissionofofforce
force
• • The
DEM
model
was
developed,
allowed
investigating
thethetransmission
granular
medium
under
compression
loading;
in in
thethe
granular
medium
under
compression
loading;
The
force
chain
network
was
statistically
quantified,
showing
responseofofthethe
• • The
force
chain
network
was
statistically
quantified,
showing
thethe
response
granular
medium
under
loading.
granular medium under loading.
Numerical investigation of force transmission in granular media using discrete element method
165
3.3. Discussions
The main findings of this work could be summarized as the followings:
- A calibration procedure of a numerical DEM model for a granular assembly was
presented and validated with experimental data;
- The DEM model was developed, allowed investigating the transmission of force in
the granular medium under compression loading;
- The force chain network was statistically quantified, showing the response of the
granular medium under loading.
Indeed, for a given granular medium under loading, the force chain network could
be considered as a load-bearing system [41]. The force chain network allows the granular
material to adapt itself in order to support different loadings and boundary conditions.
From a material point of view, the force chain network characterizes the microstructure
of the granular material. It has been pointed out that the granular material can change
its microstructure in order to bear the given loadings [42]. Moreover, the weak network
of particles surrounds the force chain network has been reported as the principal energy
dissipation source by various works in the literature [43]. Therefore, the results of this
study confirm the role of the force chain network in granular mechanics as such network
governs the mechanical response of the materials.
In order to explore the influence of microscopic particle parameters on the force chain
network, especially from friction point of view, DEM simulation for compression test was
repeated in changing the value of the coefficient of static friction particle/particle and coefficient of rolling friction particle/particle, respectively. The results of such a sensitivity
analysis are presented in Fig. 11. Figs. 11(a) and 11(b) show the deviation of the number and magnitude of contact forces in function of the deviation of coefficient of static
friction particle/particle, respectively (coefficient of static friction particle/particle varied in the range of [0.20, 0.26 and 0.32]). On the other hand, Figs. 11(c) and 11(d) show
the deviation of the number and magnitude of contact forces in function of the deviation
of the coefficient of rolling friction particle/particle, respectively (coefficient of rolling
friction particle/particle varied in the range of [0.05, 0.08 and 0.11]). It could be observed that changing the value of microscopic parameters of particles modified the force
chain network in terms of both number and magnitude of contact forces, with different
amplitudes at different heights. A higher friction coefficient allowed obtaining a more
significant number and magnitude of contact forces, which was also observed in different studies in the literature [44, 45]. Besides, it can be seen that the coefficient of static
friction particle/particle exhibited a more critical role than the rolling friction coefficient
in the compression problem, especially in terms of the magnitude of contact forces. The
reason is that the rolling resistance is mainly considered in dynamic impact problems, as
pointed out by Zhang et al. [46].
Certainly, further investigations should be carried out in order to explore the failure of the granular materials, i.e., buckling of force chains. Such an investigation could
indicate the stability of the force chain network and which parameters that the stability depends on. On the other hand, the relationship between the force chain network
and the energy of the particulate system should also be examined to clarify the energy
particle/particle
varied
in
range
of
[0.20,
0.26
and
0.32]).
On
other
hand,
Figs.
11c
and
11d
the
and
magnitude
ofand
forces
inother
of
thethe
deviation
of
thethe
thedeviation
deviationofvaried
ofthe
thenumber
and
magnitude
ofcontact
contact
forces
infunction
function
of
deviation
ofshow
particle/particle
innumber
thethe
range
of
[0.20,
0.26
0.32]).
On
thethe
hand,
Figs.
11c
and
11d
show
the
deviation
of
the
number
and
magnitude
of
contact
forces
in
function
of
the
deviation
of
coefficient
of
rolling
friction
particle/particle,
respectively
(coefficient
of
rolling
friction
coefficient
of
rolling
friction
particle/particle,
respectively
(coefficient
of
rolling
friction
the deviation of the number and magnitude of contact forces in function of the deviation of thethe
coefficient
rolling
friction
respectively
(coefficient
rolling
friction
particle/particle
inin
the
ofparticle/particle,
0.11]).
bebeobserved
changing
thethe
particle/particle
varied
therange
range
of[0.05,
[0.05,0.08
0.08and
and
0.11]).It Itcould
could
observed
that
changing
coefficient
ofofvaried
rolling
friction
particle/particle,
respectively
(coefficient
ofofthat
rolling
friction
particle/particle
varied
in
the
range
of
[0.05,
0.08
and
0.11]).
It
could
be
observed
that
changing
value
of
microscopic
parameters
of
particles
modified
the
force
chain
network
in
terms
of
both
number
value
of
microscopic
parameters
of
particles
modified
the
force
chain
network
in
terms
of
both
number
particle/particle varied in the range of [0.05, 0.08 and 0.11]). It could be observed that changing thethe
value
ofmicroscopic
microscopic
parameters
particles
modified
force
chain
network
terms
of
both
number
and
ofofcontact
forces,
with
amplitudes
at
different
heights.
AA
higher
friction
andmagnitude
magnitude
contact
forces,
withdifferent
different
amplitudes
at
different
heights.
higher
friction
value
of
parameters
ofof
particles
modified
thethe
force
chain
network
in in
terms
of
both
number
and
magnitude
of
contact
forces,
with
different
amplitudes
at
different
heights.
A
higher
friction
coefficient
allowed
obtaining
a
more
significant
number
and
magnitude
of
contact
forces,
which
was
coefficient
allowed
obtaining
a
more
significant
number
and
magnitude
of
contact
forces,
which
was
and magnitude of contact forces, with different amplitudes at different heights. A higher friction
coefficient
allowed
obtaining
a
more
significant
number
and
magnitude
of
contact
forces,
which
was
also
observed
in
different
studies
in
the
literature
[44,45].
Besides,
it
can
be
seen
that
the
coefficient
of
also
observed
in
different
studies
in
the
literature
[44,45].
Besides,
it
can
be
seen
that
the
coefficient
coefficient allowed obtaining a more significant number and magnitude of contact forces, which was of
also
observed
differentstudies
studies
[44,45].
Besides,
itrolling
can
seen
that
the
coefficient
of
static
friction
exhibited
aliterature
more
role
than
friction
coefficient
ininthe
static
frictionparticle/particle
particle/particle
exhibited
a morecritical
critical
role
thanthe
rolling
friction
coefficient
also
observed
inin
different
inin
thethe
literature
[44,45].
Besides,
itthe
can
bebe
seen
that
the
coefficient
ofthe
static
friction
particle/particle
exhibited
aofmore
critical
rolethan
the
rolling
friction
coefficient
in
compression
problem,
especially
ininterms
thethe
magnitude
ofthan
contact
forces.
The
reason
is isthat
thethe
compression
problem,
especially
terms
of
magnitude
of
contact
forces.
The
reason
that
static
friction
particle/particle
exhibited
a
more
critical
role
the
rolling
friction
coefficient
in
the
166
Thong Chung Nguyen, Lu Minh Le, Hai-Bang Ly, Tien-Thinh Le
compression
problem,
especially
terms
magnitude
contact
forces.
The
reason
that
the
rolling
resistance
is is
mainly
considered
in
dynamic
impact
problems,
asas
pointed
out
byby
Zhang
etis
al.al.
[46].
rolling
resistance
mainly
considered
in
dynamic
impact
problems,
pointed
out
Zhang
et
[46].
compression
problem,
especially
ininterms
ofofthethemagnitude
ofofcontact
forces.
The
reason
is
that
the
rollingresistance
resistanceis is
mainly
considered
dynamic
impact
problems,
pointed
Zhang
[46].
rolling
mainly
considered
inin
dynamic
impact
problems,
asas
pointed
outout
byby
Zhang
et et
al.al.
[46].
(a)
(b)
Fig.
11.11.
Evaluation
of of
thethe
number
of of
contact
forces
in in
function
of:of:
(a)(a)
coefficient
of of
static
friction
Fig.
Evaluation
number
contact
forces
function
coefficient
static
friction
particle/particle,
(c)
coefficient
rolling
friction
particle/particle;
evaluation
ofcoefficient
thethe
magnitude
offriction
contact
forces
particle/particle,
(c)
coefficient
of
rolling
friction
particle/particle;
evaluation
of
magnitude
of
contact
forces
Fig.
11.11.
Evaluation
ofof
theof
number
ofof
contact
forces
in in
function
of:of:
(a)(a)
coefficient
of of
static
Fig.
Evaluation
the
number
contact
forces
function
static
friction
(c)
(d)
particle/particle,
(c)(c)
coefficient
ofof
rolling
friction
particle/particle;
evaluation
of of
thethe
magnitude
of of
contact
forces
particle/particle,
coefficient
rolling
friction
particle/particle;
evaluation
magnitude
contact
forces
Fig. 11. Evaluation of the number of contact forces in function of: (a) coefficient of static friction
particle/particle, (c) coefficient of rolling friction particle/particle; evaluation of the magnitude
of contact forces in function of: (b) the coefficient of static friction particle/particle, (d) coefficient
of rolling friction particle/particle
dissipation. Finally, more complex mechanical tests should be conducted, which could
establish the relationship between the microscale parameters and macroscopic responses
of the granular media.
4. CONCLUSIONS
In this work, numerical simulation of the compression test for a granular medium
has been presented to investigate the force transmission. The numerical DEM model
was calibrated, taking into account the microscale parameters of the granular medium,
especially the particle size distribution, mechanical properties, coefficient of static friction, coefficient of rolling friction and coefficient of restitution. The DEM model was
Numerical investigation of force transmission in granular media using discrete element method
167
compared with experimental data, showing a good capability of simulation. The force
chain network of the granular medium was calculated, showing the crucial role of such
a network on the macroscopic mechanical response of the medium. Contact forces were
analyzed statistically, presenting its evaluation in function of the applied load. Results
showed that the more the compression applied, the higher number of contacts forces was
created, along with an increase of amplitude and standard deviation. In addition, further
works should be conducted and applied for different granular materials and also under
different loading conditions. Moving walls with constant lateral confinement should be
investigated in further studies as they can affect the settlement of the sample in the zdirection and the static/dynamic states of the sample at the time step. Finally, the failure
of granular materials should be investigated regarding the collapse of the force chain
network at the micro-level.
ACKNOWLEDGMENT
The authors gratefully acknowledge the Vietnam National University of Agriculture
for supporting this research.
REFERENCES
[1] P. A. Cundall and O. D. L. Strack. A discrete numerical model for granular assemblies.
Geotechnique, 29, (1), (1979), pp. 47–65. />[2] V. T. Tran, F.-V. Donz´e, and P. Marin. A discrete element model of concrete under high triaxial loading. Cement and Concrete Composites, 33, (9), (2011), pp. 936–948.
/>˙
[3] Z. Kaliniewicz and Z. Zuk.
A relationship between friction plate roughness and the external friction angle of wheat kernels. International Journal of Food Properties, 20, (sup3), (2017),
pp. S2409–S2417. />[4] N. T. Cuong, B. H. Ha, and R. Fukagawa. Failure mechanism of two-dimensional granular
columns: Numerical simulation and experiments. Vietnam Journal of Mechanics, 37, (4), (2015),
pp. 239–250. />[5] H. Fu, C. Jin, and J. Yu. The DEM-based digital design platform for agricultural machinery—AgriDEM. In International Conference on Discrete Element Methods, Springer, Springer,
(2016), pp. 1253–1263.
[6] J. Horabik and M. Molenda. Force and contact area of wheat grain in friction. Journal of
Agricultural Engineering Research, 41, (1), (1988), pp. 33–42. />[7] E. P. Montell`a, M. Toraldo, B. Chareyre, and L. Sibille. Localized fluidization in granular materials: Theoretical and numerical study. Physical Review E, 94, (5), (2016).
/>[8] D. T. Huan, T. H. Quoc, and T. M. Tu. Free vibration analysis of functionally graded shell
panels with various geometric shapes in thermal environment. Vietnam Journal of Mechanics,
40, (3), (2018), pp. 199–215. />[9] F. Nicot, H. Xiong, A. Wautier, J. Lerbet, and F. Darve. Force chain collapse
as grain column buckling in granular materials. Granular Matter, 19, (2), (2017).
/>
168
Thong Chung Nguyen, Lu Minh Le, Hai-Bang Ly, Tien-Thinh Le
[10] Y. Zhou, H. Wang, B. Zhou, and J. Li. DEM-aided direct shear testing of granular sands incorporating realistic particle shape. Granular Matter, 20, (3), (2018).
/>[11] Z. Deng, P. B. Umbanhowar, J. M. Ottino, and R. M. Lueptow. Continuum modelling of
segregating tridisperse granular chute flow. Proceedings of the Royal Society A: Mathematical,
Physical and Engineering Sciences, 474, (2211), (2018). />[12] S. Dunatunga and K. Kamrin. Continuum modelling and simulation of granular flows
through their many phases. Journal of Fluid Mechanics, 779, (2015), pp. 483–513.
/>[13] S. Bidier and W. Ehlers. Particle simulation of granular media and homogenisation towards continuum quantities. PAMM, 13, (1), (2013), pp. 575–576.
/>[14] M. Tolomeo, V. Richefeu, G. Combe, J. N. Roux, and G. Viggiani. An assessment
of discrete element approaches to infer intergranular forces from experiments on 2D
granular media. International Journal of Solids and Structures, 187, (2020), pp. 48–57.
/>[15] J. Duriez and R. Wan. Stress in wet granular media with interfaces via homogenization and discrete element approaches. Journal of Engineering Mechanics, 142, (12), (2016).
/>[16] M. Servin, D. Wang, C. Lacoursi`ere, and K. Bodin. Examining the smooth and nonsmooth
discrete element approaches to granular matter. International Journal for Numerical Methods in
Engineering, 97, (12), (2014), pp. 878–902. />[17] S. Lommen, D. Schott, and G. Lodewijks. DEM speedup: Stiffness effects on behavior of bulk
material. Particuology, 12, (2014), pp. 107–112. />[18] V. D. Than, S. Khamseh, A. M. Tang, J.-M. Pereira, F. Chevoir, and J.-N. Roux. Basic mechanical properties of wet granular materials: a DEM study. Journal of Engineering Mechanics, 143,
(1), (2017). />[19] L. Xie, P. Jin, T.-C. Su, X. Li, and Z. Liang. Numerical simulation of uniaxial compression
tests on layered rock specimens using the discrete element method. Computational Particle
Mechanics, (2019), pp. 1–10. />[20] Z. Xu, A. M. Tartakovsky, and W. Pan. Discrete-element model for the interaction between ocean waves and sea ice. Physical Review E, 85, (1), (2012).
/>[21] M. Dratt and A. Katterfeld. Coupling of FEM and DEM simulations to consider dynamic deformations under particle load. Granular Matter, 19, (3), (2017).
/>[22] M. Zhou, S. Wang, S. Kuang, K. Luo, J. Fan, and A. Yu. CFD-DEM modelling of hydraulic
conveying of solid particles in a vertical pipe. Powder Technology, 354, (2019), pp. 893–905.
/>[23] M. Kobayakawa, S. Miyai, T. Tsuji, and T. Tanaka. Interaction between dry granular materials and an inclined plate (comparison between large-scale DEM simulation and three-dimensional wedge model). Journal of Terramechanics, (2019).
/>[24] C. Gonz´alez-Montellano, J. M. Fuentes, E. Ayuga-T´ellez, and F. Ayuga. Determination of the mechanical properties of maize grains and olives required for use
in DEM simulations. Journal of Food Engineering, 111, (4), (2012), pp. 553–562.
/>
Numerical investigation of force transmission in granular media using discrete element method
169
[25] A. O. Raji and J. F. Favier. Model for the deformation in agricultural and food particulate materials under bulk compressive loading using discrete element method. I: Theory,
model development and validation. Journal of Food Engineering, 64, (3), (2004), pp. 359–371.
/>[26] V.-T. Nguyen and M.-Q. Le. Atomistic simulation of the uniaxial compression of black
phosphorene nanotubes. Vietnam Journal of Mechanics, 40, (3), (2018), pp. 243–250.
/>[27] K. L. Johnson, K. Kendall, and a. Roberts. Surface energy and the contact of elastic solids. In
Proceedings of the Royal Society of London. Series A. Mathematical and Physical Sciences, The Royal
Society London, Vol. 324, (1971), pp. 301–313, />[28] A. Di Renzo and F. P. Di Maio. Comparison of contact-force models for the simulation of
collisions in DEM-based granular flow codes. Chemical Engineering Science, 59, (3), (2004),
pp. 525–541. />[29] K. F. Malone and B. H. Xu. Determination of contact parameters for discrete element method simulations of granular systems. Particuology, 6, (6), (2008), pp. 521–528.
/>[30] J. Ai, J.-F. Chen, J. M. Rotter, and J. Y. Ooi. Assessment of rolling resistance models in discrete element simulations. Powder Technology, 206, (3), (2011), pp. 269–282.
/>[31] J. M. Boac, R. P. K. Ambrose, M. E. Casada, R. G. Maghirang, and D. E. Maier. Applications
of discrete element method in modeling of grain postharvest operations. Food Engineering
Reviews, 6, (4), (2014), pp. 128–149. />[32] B. M. Ghodki, M. Patel, R. Namdeo, and G. Carpenter. Calibration of discrete element
model parameters: soybeans. Computational Particle Mechanics, 6, (1), (2019), pp. 3–10.
/>[33] T. Xu, J. Yu, Y. Yu, and Y. Wang. A modelling and verification approach for soybean seed
particles using the discrete element method. Advanced Powder Technology, 29, (12), (2018),
pp. 3274–3290. />[34] C. Kloss, C. Goniva, A. Hager, S. Amberger, and S. Pirker. Models, algorithms and validation
for opensource DEM and CFD–DEM. Progress in Computational Fluid Dynamics, an International Journal, 12, (2-3), (2012), pp. 140–152. />[35] J. Horabik and M. Molenda. Parameters and contact models for DEM simulations of agricultural granular materials: A review. Biosystems Engineering, 147, (2016), pp. 206–225.
/>[36] Matlab. Natick, MA, USA, (2018). The MathWorks.
[37] U. Ayachit. The ParaView guide: A parallel visualization application, ParaView 4.3. Kitware, Incorporated, (2015).
[38] D. O. C. Souza and F. C. Menegalli. Image analysis: Statistical study of particle size
distribution and shape characterization. Powder Technology, 214, (1), (2011), pp. 57–63.
/>[39] C. J. Coetzee and D. N. J. Els. Calibration of granular material parameters for DEM modelling
and numerical verification by blade–granular material interaction. Journal of Terramechanics,
46, (1), (2009), pp. 15–26. />[40] T. A. H. Simons, R. Weiler, S. Strege, S. Bensmann, M. Schilling, and A. Kwade.
A ring shear tester as calibration experiment for DEM simulations in agitated
mixers—a sensitivity study. Procedia Engineering, 102, (1), (2015), pp. 741–748.
/>
170
Thong Chung Nguyen, Lu Minh Le, Hai-Bang Ly, Tien-Thinh Le
[41] W. Wu, G. Ma, W. Zhou, D. Wang, and X. Chang. Force transmission and anisotropic characteristics of sheared granular materials with rolling resistance. Granular Matter, 21, (4), (2019).
/>[42] A. Salazar, E. S´aez, and G. Pardo. Modeling the direct shear test of a coarse sand using the 3D
Discrete Element Method with a rolling friction model. Computers and Geotechnics, 67, (2015),
pp. 83–93. />[43] A. Tordesillas, C. A. H. Steer, and D. M. Walker. Force chain and contact cycle evolution in a
dense granular material under shallow penetration. Nonlinear Processes in Geophysics, 21, (2),
(2014), pp. 505–519. />[44] T.-X. Xiu, W. Wang, K. Liu, Z.-Y. Wang, and D.-Z. Wei. Characteristics of force chains in frictional interface during abrasive flow machining based on discrete element method. Advances
in Manufacturing, 6, (4), (2018), pp. 355–375. />[45] W. Wang, W. Gu, and K. Liu. Force chain evolution and force characteristics of shearing
granular media in Taylor-Couette geometry by DEM. Tribology Transactions, 58, (2), (2015),
pp. 197–206. />[46] L. Zhang, N. G. H. Nguyen, S. Lambert, F. Nicot, F. Prunier, and I. DjeranMaigre. The role of force chains in granular materials: from statics to dynamics. European Journal of Environmental and Civil Engineering, 21, (7-8), (2017), pp. 874–895.
/>
Numerical investigation of force transmission in granular media using discrete element method
171
APPENDIX
Critical breakage force
In this work, the critical breakage force of soybean particles was measured using F.S.
20,000 kN testing machine, available at the Strength of materials laboratory, Faculty of Engineering, Vietnam National University of Agriculture. In each test, three particles were
positioned in the machine to form an equilateral triangle, as showing in Fig. A1(a). Three
tests were finally conducted, as shown in Fig. A1(b) for displacement - compression force
curves. The breakage of particles was observed at 50-70 N for most of the particles (i.e., a
shortening higher than 1.5 mm compared to the average particle diameter of 6.24 mm). It
should be noticed that the critical value should also be selected based on the germination
Nguyenafter
Chung
Thong,
Le Minh
Lu,higher
Ly Haithan
Bang85-90%).
and Le Tien
Thinh
rate of particles
being
deformed
(i.e.,
Consequently,
50 N was 15
finally chosenNguyen
as a critical
of soybean
particles.
15
Chungbreakage
Thong, Le force
Minh Lu,
Ly Hai Bang
and Le Tien Thinh
(a)
(b)
Fig. A1. Measurement of critical breakage force of particles: (a) compression test, (b) displacement -
Fig.A1.
A1.Measurement
Measurement
critical
breakage
force
particles:
compression
displacement
Fig.
of of
critical
breakage
force
of of
particles:
(a)(a)
compression
test,test,
(b)(b)
displacement
compression
force
curve.
compression
force
curve
compression force curve.
REFERENCES
[1]
REFERENCES
P.A. Cundall, O.D.L. Strack, A discrete numerical
model for granular assemblies, Géotechnique. 29 (1979)
47–65. />
[1]
P.A. Cundall, O.D.L. Strack, A discrete numerical model for granular assemblies, Géotechnique. 29 (1979)
[2] V.T.
Tran, F.-V. Donzé, P. Marin, A discrete element model of concrete under high triaxial loading, Cement
47–65.
/>
[2]
V.T. Tran, F.-V. Donzé, P. Marin, A discrete element model of concrete under high triaxial loading, Cement
[3] Z. Kaliniewicz, Z. Żuk, A relationship between friction plate roughness and the external friction angle of
and Concrete
Composites. 33 (2011) 936–948. />wheat kernels, International Journal of Food Properties. 20 (2017) S2409–S2417.
[3]
/>Z. Kaliniewicz,
Z. Żuk, A relationship between friction plate roughness and the external friction angle of
wheat
kernels,
International
Journal
of Foodof two-dimensional
Properties. granular
20 (2017)
S2409–S2417.
[4] N.T.
Cuong, B.H.
Ha, R. Fukagawa,
Failure mechanism
columns: Numerical
/>simulation and experiments, Vietnam Journal of Mechanics. 37 (2015) 239–250.
[4]
N.T. Cuong, B.H. Ha, R. Fukagawa, Failure mechanism of two-dimensional granular columns: Numerical
[5] H. Fu, C.and
Jin, J. Yu,
The DEM-Based
Digital Design
Platform
in:
simulation
experiments,
Vietnam
Journal
offor Agricultural
Mechanics.Machinery—AgriDEM,
37 (2015) 239–250.
X. Li, Y. Feng, G. Mustoe (Eds.), Proceedings of the 7th International Conference on Discrete Element
/>
[5]
H.
Jin, J. Yu,
DEM-Based
Digital
Design
[6]Fu, J.C.Horabik,
M. The
Molenda,
Force and
contact
area Platform
of wheat for
grainAgricultural
in friction, Machinery—AgriDEM,
Journal of Agricultural in:
X. Li, Engineering
Y. Feng, G.
Mustoe41(Eds.),
of the 7th International Conference on Discrete Element
Research.
(1988) Proceedings
33–42. />Methods, Springer, Singapore, 2017: pp. 1253–1263. />
[6]
and numerical
study, Phys.
Rev.and
E. 94contact
(2016) 052905.
J. Horabik,
M. Molenda,
Force
area of />wheat grain in friction, Journal of Agricultural
Engineering
Research.
41
(1988)
33–42.
/>[8] D.T. Huan, T.H. Quoc, T.M. Tu, Free vibration analysis of functionally graded shell panels with various
and Concrete Composites. 33 (2011) 936–948. />
/>
Methods, Springer, Singapore, 2017: pp. 1253–1263. />
[7]
E.P. Montellà, M. Toraldo, B. Chareyre, L. Sibille, Localized fluidization in granular materials: Theoretical
geometric shapes in thermal environment, Vietnam Journal of Mechanics. 40 (2018) 199–215.