FPT financial statement analysis of FPT corporation
Bạn đang xem bản rút gọn của tài liệu. Xem và tải ngay bản đầy đủ của tài liệu tại đây (1.13 MB, 51 trang )
Financial statement analysis of FPT Corporation
UNIVERSITY OF ECONOMICS – THE UNIVERSITY OF DANANG
THE FACULTY OF FINANCE
GROUP ASSIGNMENT
Subject: FINANCIAL ANALYSIS
Topic: Financial statement analysis of FPT Corporation
Lecturer: Tran Thi Nga
Presented by: Nguyen Cong Nu Quynh Anh
Tran Thuy Linh
Thai Tran Thuy Tien
Da Nang, 4/2018
GROUP 1
1
Financial statement analysis of FPT Corporation
CONTENTS
I.
OVERVIEW..............................................................................................................6
1. The urgency of the topic........................................................................................6
2. Objective of the topic.............................................................................................6
3. Objects and scope of the topic...............................................................................6
3.1.
Research object.................................................................................................6
3.2.
Scope of research..............................................................................................6
4. Methods................................................................................................................... 6
II.
INTRODUCTION OF FPT...................................................................................6
1. Structure of ownership..........................................................................................6
2. Normal production and business cycle.................................................................7
3. Operating industry and principal activities.........................................................7
III.
INDUSTRY ANALYSIS.........................................................................................7
1. Macro environment:..............................................................................................7
1.1.
Legal factor.......................................................................................................7
1.2.
Economic factor................................................................................................8
1.3.
Social factor......................................................................................................9
1.4.
Techonology factor...........................................................................................9
1.5.
Demographic factor..........................................................................................9
1.6.
Global factor...................................................................................................10
2. Industry – level analysis.......................................................................................10
IV.
2.1.
Rivalry among existing firms.........................................................................10
2.2.
Threat of new entrants....................................................................................11
2.3.
Threat of substitute products..........................................................................11
2.4.
Bargaining power of buyers...........................................................................11
2.5.
Bargaining power of supplier.........................................................................11
FINANCIAL STRUCTURE ANALYSIS............................................................12
1. Assets structure analysis......................................................................................12
2. Source of fund analysis........................................................................................13
GROUP 1
2
Financial statement analysis of FPT Corporation
2.1.
Financial autonomy.......................................................................................13
2.2.
Funding stability.............................................................................................14
3. Financial balance analysis...................................................................................14
3.1.
Long-term financial balance..........................................................................14
3.2.
Short-term financial balance..........................................................................14
V. OPERATIONAL EFFICIENCY ANALYSIS........................................................15
1. Asset use efficiency...............................................................................................15
2. Fixed asset turnover.............................................................................................15
3. Working capital turnover....................................................................................16
4. Disaggregating working capital turnover...........................................................16
5. Return on Sales (ROS).........................................................................................17
6. Return on Assets (ROA)......................................................................................17
7. Disaggregating ROA............................................................................................18
8. Return on assets variation...................................................................................18
9. ROE....................................................................................................................... 18
10.
Impact factors to ROE......................................................................................19
10.1.
ROS, Assets turnover...................................................................................19
10.2.
Self-fund ratio.............................................................................................19
10.3.
Debt to equity ratio......................................................................................20
10.4.
Interest coverage ratio (ICR)......................................................................20
11.
VI.
Indicator from cash flow..................................................................................21
11.1.
Cash flow margin........................................................................................21
11.2.
Cash flow from operations to net income = CFO/(Net income).................21
11.3.
Cash flow return on assets = CFO/(Total assets)........................................21
THE RISK ANALYSIS:.......................................................................................22
1. Business risk analysis...........................................................................................22
2. Financial risk analysis..........................................................................................22
3. Insolvency risk:....................................................................................................23
3.1.
Current ratio:..................................................................................................23
3.2.
Quick ratio or acid – test ratio:......................................................................23
GROUP 1
3
Financial statement analysis of FPT Corporation
3.3.
Cash ratio:......................................................................................................24
3.4.
Cash flow ratio:..............................................................................................24
3.5.
Interest coverage ratio:...................................................................................24
3.6.
Inventory turnover:.........................................................................................25
3.7.
Receivables turnover:.....................................................................................25
3.8.
Altman Z-score:.............................................................................................26
VIII.
SUMMARISE AND CONCLUSION..............................................................27
1. Consultant and business manager......................................................................27
2. Suppliers and lenders...........................................................................................28
3. Investors................................................................................................................ 28
THE TABLE OF PICTURE
Picture 1: Vietnam's economic growth.............................................................................27
Picture 2: Gross dometic product.....................................................................................27
Picture 3: CPI of VietNam................................................................................................28
Picture 4: Exchange rate...................................................................................................28
Picture 5: Revenues and expenditures of the state budget................................................29
Picture 6: Population Structure of Vietnam......................................................................29
Picture 7: Population growth rate.....................................................................................30
Picture 8: the level of R&D expenditure..........................................................................30
Picture 9: Industry segment..............................................................................................31
Picture 10: phone retail market share...............................................................................31
Picture 11: Telecom market share.....................................................................................32
GROUP 1
4
Financial statement analysis of FPT Corporation
LIST OF TABLES
Table 1: The difference in proportion of assets through 3 years.......................................34
Table 2: The proportion of assets in total assets...............................................................34
Table 3: The proportion of liabilities and equity in total resources...................................35
Table 4: The proportion of short-term/ long-term resources in total resources................35
Table 5.............................................................................................................................. 35
Table 6.............................................................................................................................. 36
Table 7.............................................................................................................................. 36
Table 8: Calculate DOL....................................................................................................42
Table 9: Variance of DOL................................................................................................42
Table 10: Calculate DFL..................................................................................................43
Table 11: Variance of DFL...............................................................................................43
Table 12: Calculate Current ratio.....................................................................................43
Table 13: Variance of Current Ratio.................................................................................44
Table 14: Calculate Quick ratio........................................................................................44
Table 15: Variance of Quick ratio.....................................................................................45
Table 16: Calculate Cash ratio..........................................................................................45
Table 17: Variance of Cash ratio......................................................................................46
Table 18: Calculate Cash flow ratio.................................................................................46
Table 19: Variance of Cash flow ratio..............................................................................46
Table 20: Calculate Interest coverage ratio......................................................................47
Table 21: Variance of Interest coverage ratio...................................................................47
Table 22: Calculate Inventory turnover............................................................................47
Table 23: Variance of Inventory turnover.........................................................................48
Table 24: Calculate Accounts receivable turnover............................................................48
Table 25: Variance of Accounts receivable turnover........................................................48
GROUP 1
5
Financial statement analysis of FPT Corporation
I. OVERVIEW
1. The urgency of the topic
In today's market economy, any business that invests in or produces, also expects
the capital they spend will bring the highest return. In addition to the available
advantages, the financial strength of the enterprise is the basis for a series of policies
to bring business to success. Therefore, financial analysis is the best estimate of what
has been done, what is expected to happen, on that basis, propose measures to take
full advantage of the strengths and overcome the weakness.
From that, providing information support to managers selected basis, decide the
optimal scheme for the operation of the business. On the other hand, the financial
situation is also a concern of many subjects other than business owners, such as
administrators, investors, financiers; Each object is interested in corporate finance on
different angles to serve their field of management and investment. Because of this,
analyzing corporate financial situation is an indispensable part of corporate finance
management, it has practical significance and is a long-term strategy.
2. Objective of the topic
Throughout the research process, the topic focused on clarifying the following
objectives:
- Revise the basis of the analysis of the financial situation of the business.
- Analyzing, clarifying the actual situation of financial situation at FPT
Corporation. From that point of view, there are still problems in the financial analysis
at the Group and the causes of such problems
- Make predictions about the operational status as well as the company's
prospects for the future
3. Objects and scope of the topic
3.1. Research object
Financial status of FPT Corporation
3.2. Scope of research
Financial situation of FPT Corporation in the period of 2014 – 2016
4. Methods
In this article, we use mainly qualitative and quantitative method to analyze the
company's financial statements.
II. INTRODUCTION OF FPT
1. Structure of ownership
FPT Corporation (the “Company”) was incorporated as a State-owned company in
Vietnam and subsequently equitised in accrordance with Decision No. 178/QD-TTg,
following which the Company officially operated as a joint stock company. FPT
Corporation operates under Business Registration Certificate No. 001041 issued for
GROUP 1
6
Financial statement analysis of FPT Corporation
the first time by Hanoi Department of Planning and Investment dated 13 May 2002
and its amendments.
According to the amended Business Registration Certificate dated 19 December
2008, the Company changed its name from the Corporation for Financing and
Promoting Technology to FPT Corporation.
According to the latest amended Business Registration Certificate dated 26 June
2015, the Company’s total charter capital is VND 3,975,316,400,000
Since December 2006, the Company’s shares have been listed on Ho Chi Minh
City Stock Exchange.
The number of employees of the Company as at 30 June 2016 was 208 (31
December 2015: 179)
2. Normal production and business cycle
The Company’s normal production and business cycle is carried out for a time
period of 12 months or less.
3. Operating industry and principal activities
The principal activities of the Company are to provide information technology and
telecommunication products and services. The main products and services provided
are system integration; software production and development; IT services; ERP
services; IT product manufacturing and distribution; mobile phone distribution;
software solution services; telecommunication and internet services; warranty and
maintenance of telecommunication and IT equipment and other telecommunication
services.
III. INDUSTRY ANALYSIS
1. Macro environment:
1.1. Legal factor
Vietnam is regarded as a country with relatively stable political institutions
around the world, which facilitates economic development and promotes dynamism
in the private sector. However, enterprises may also face risks due to state policies in
information technology.
- The legal system for information technology activities are limited and
inadequate.
- The government create favorable conditions for organizations and
individuals inside and outside the country to invest, trade, produce and provide
software services.
- The change in national information technology development strategy along
with government funding for e-chemistry and technology programs can lead to a
significant reduction in the number of custumers.
GROUP 1
7
Financial statement analysis of FPT Corporation
- The government's policy on training and utilizing human resources in
increasing scale and quality also has a significant impact on the company's
development plan.
- The Government adopts preferential tax policy to promote the development
and application of information technology in Vietnam. Details: 50% reduction of
personal income tax on salaries and wages of high technology individuals working in
the field of information technology. For new investment projects in the field of
information technology that require special investment incentives provided by the
government, the tax rate of 10%.
Rating: Good (+) The legal politics of the country help production and
business for FPT
1.2. Economic factor
Vietnam is a developing country with a market economy. High growth rate and
stability in recent years. In addition, the economy is forecasted by experts to maintain
7-8% growth in coming years. In line with GDP growth, consumer trends have also
increased. (Refer to Appendix 1 - Picture 1)
Contributing to the national economic growth largely came from the service
sector (73.7% in 2015) and industry (38.8% in 2015). (Refer to Appendix 1 - Picture
2)
The inflation rate is relatively low, rising from 1-2% per year. The pressure on
inflation mainly comes from the public service price increase along with the petrol.
(Refer to Appendix 1 - Picture 3)
Although the mobilizing interest rate remained stable and the lending interest
rate was adjusted downward according to the policy issued by the State Bank of
Vietnam on July 10, the capital of many commercial banks in Vietnam is always
stressful. Thus, in parallel with the race to raise deposit rates, most banks also
adjusted to raise lending rates or limit lending by barriers.
Nominal rates continue to maintain a stable trend. Inflation is relatively low,
with the supply of foreign currencies plentiful because of the increase in both direct
and indirect foreign investment. Together with the continued devaluation of the US
dollar against other strong currencies, the pressure on the VND exchange rate in
Vietnam has significantly reduced. (Refer to Appendix 1 - Picture 4)
State budget deficit over 100 trillion VND per year. This fiscal policy
stimulates the economy. (Refer to Appendix 1 - Picture 5)
The unemployment rate reached 4.5% (2012) ranked 40th globally.
Rating: Good (+) The economy together with the expanding service
industry market creates great opportunities for FPT businesses to increase their sales.
GROUP 1
8
Financial statement analysis of FPT Corporation
Demand for commodities increases, making the market more open, however, the
pressure from the devaluation of the USD made products from abroad more
competitive than domestic products.
1.3. Social factor
Vietnam is the third most populous country in Southeast Asia with a young
population. (Refer to Appendix 1 - Picture 6)
The average life expectancy of the whole country in 2017 is 73,5 years.
The population growth rate tends to decrease. (Refer to Appendix 1 - Picture 7)
Labor productivity in Vietnam is still low compared to many countries in the
region. By purchasing power parity in 2011, Vietnam’s labor productivity in 2016
reached $9894, equivalent to 7% of Singapore; 17,6% of Malaysia; 36,5% of
Thailand; 42,3% of Indonesia; 56,7% of Philippines and equal to 87,4% of Laos’s
labor productivity. It is noteworthy that the difference in labor productivity between
Vietnam and other counties continues to increase.
Health is improving. Vietnam’s current health sector is being financed by many
international organizations for ODA and NGO funds. By 2010 the Ministry of Health
is administering 62 ODA projects and more than 100 NGO projects with more 1
billion USD, projects are distributed throughout region.
Rating: Bad(-) Although the ability to learn and technology integration of
Vietnamese people is very high, but the tendency to change the requirements of
enterprises operating in this industry must always change to catch up with the coin.
This makes it difficult to improve the technology of FPT enterprises. In addition, the
rate of population growth gradually decreases in the future.
1.4. Techonology factor
With the rapid development of the information technology industry today lead
to the product life cycle is relatively short, requiring manufacturers to constantly
research and develop to meet the needs of consumers.
According to World Bank report, the level of R&D expenditure for Vietnamese
enterprises is lower than that of Cambodia and the top lowest in the Southeast Asian
region. Accordingly, business spend only 1,6% of their annual revenue on R&D.
(Refer to Appendix 1 - Picture 8)
Rating: Bad(-) The poor condition of the R & D system has led to the
development of businesses that are still limited, rigid and wasteful resources
1.5. Demographic factor
Total population: 93,7 million people ( 2017)
Sex ratio: 97.3 males per 100 females
GROUP 1
9
Financial statement analysis of FPT Corporation
People living in urban areas: 32,9 million people (accounting for 35,1% of
the national population)
Vietnam has 54 ethnic groups, most of them are Kinh people, accounting for
nearly 86%, concentrated in deltas and coastal plains. The remaining 53 ethnic
groups are ethnic minorities, accounting for about 14% of the total population of the
country, most of which are concentrated in mountainous and highland areas.
Languages: Vietnamese is a popular language, and English is gradually
becoming a secondary language
Vietnamese education is now trying to integrate with countries in Southeast
Asia and in the world. There are five levels of education in Vietnam: primary, lower
secondary, upper secondary, tertiary and postgraduate
Rating: good (+) The large population with high level and ability to
integrate create a dynamic environment for FPT.
1.6. Global factor
The world is becoming increasingly intertwined into a global marketplace in
which everyone can enter the market through the Internet. In particular, the tendency
of the world to shift from trade to service where the knowledge plays a decisive role.
The current era of globalization is built on information and telecommunications.
In the trend of international economic integration, Vietnam's accession to the
WTO, foreign investors with high financial capacity, high technology and long-term
experience will penetrate the Vietnamese market to compete with domestic company.
Rating: bad (-) diversified penetration of international brands makes FPT's
market share narrow. Besides, the high competitiveness from the Chinese products at
super cheap prices put pressure on FPT.
2. Industry – level analysis
2.1. Rivalry among existing firms
The demand of customers increasing in information technology such as
internet, computer, mobile, software ... leading to the industry need to be expanded
and enhanced to meet the needs of the market. As a result, the size of the sector is
expanding and growing, leading to a reduction in competition among enterprises in
the industry. (Refer to Appendix 1 - Picture 9)
The high concentration of information technology makes the industry more
competitive. However, FPT still holds a large market share.
In the mobile phone market, FPT ranked second after mobile world with 10%
market share. The reason is that the number of mobile retail stores in the world is
twice as high as that of FPT. (Refer to Appendix 1 - Picture 10)
GROUP 1
10
Financial statement analysis of FPT Corporation
In the telecoms sector, FPT growth from a 6% share of the market in 2014
increased to 25% by 2015 and gradually narrowed the gap with the remaining
FPT is a relatively strong information technology company in Vietnam, with a
large amount of investment in backing and policy support to develop from the state,
so it is not an easy option to withdraw from the industry.
2.2. Threat of new entrants
FPT has the advantage of having access to resources. FPT was selected by
Microsoft as the first strategic partner in Asia to provide high quality solutions to
local and regional businesses in Asia.
FPT is the official distribution channel and the authorized service provider of
two leading mobile brands, Samsung and Motorola. However, mobile distribution is
a volatile business area, even small fluctuations can put pressure on the business.
To reduce the pressure from potential competitors, FPT has adopted a
differentiated product strategy, pioneering the Internet television service, and
wireless internet. FPT is the only provider of this service in Vietnam.
2.3. Threat of substitute products
Alternative product is one of the important factors affecting the consumption of
FPT products. Development techniques will create more likely to appear alternative
products. However, this information technology is taking a very important position
so it is difficult to replace them. Therefore the pressure from alternative products to
FPT is not great.
But some areas such as digital television, or the media also play an important
role in providing information that makes information technology such as FPT so
cautious.
2.4. Bargaining power of buyers
In the network economy, especially through the Internet, transaction and
conversions costs are down. Information mismatches between customers and
suppliers, between different sectors are minimized, and it is approached faster, more
detailed and more objective. Customers have more choices that create the power of
customer negotiation. Therefore, the pressure of customers on FPT is very big,
forcing FPT to diversify its products and reduce the price of its products so that it can
compete with other suppliers.
2.5. Bargaining power of supplier
As the Vietnamese market has not developed yet, the suppliers of raw materials
for FPT have not much and dispersed, especially with many materials imported from
abroad. Therefore, FPT has difficulties in producing.
GROUP 1
11
Financial statement analysis of FPT Corporation
Suppliers offer a wide range of products, quality and price. Therefore, if FPT
would like to have high quality products , they spent high cost. In addition, each raw
material has to be imported from different suppliers so the cost to spend is quite large
to have enough raw material for production.
In cases where it is difficult to convert the supplier to continue production, the
transition period costs more.
These have created disadvantages and difficulties for FPT for suppliers.
IV. FINANCIAL STRUCTURE ANALYSIS
1. Assets structure analysis
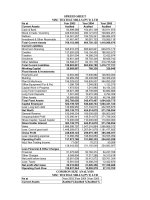
According to the data analysis (Appendix 2 – Table 1), we see that the total asset
size increases gradually over the years with a relatively stable level, about 14%.
Specifically, in 2015, total assets are 26,045,588,544,428, an increase of 14.95%
compared to that of 2014 and 2016 of 29,833,261,814,151, an increase of 14.54%
against 2015. This increase shows that FPT is constantly expanding its investment in
assets. However, by 2016, the company has made minor adjustments to this item,
which explains why we have to look at specific assets.
- In terms of short-term assets, FPT invested more than 2,000 billion VND per
year, 2016 is expected to invest more in 2015 with 2.1%. By 2015, almost all
types of short-term assets will increase, of which financial investments will
increase sharply with 83.23% (including term deposits and other short-term
investments), but cash and cash equivalents decreased by 17.33% (bank deposits
and cash equivalents decreased), which may be due to expansion of some
activities in the foreign sector by 2015. In 2016, cash and cash equivalents
increased sharply (67.75%) as FPT focused on cash to expand its operations, but
inventories and other assets fell to around 1% in turn, 13.56% and 37.11%, this
does not prove that enterprises have problems in management, FPT has adjusted
its goods according to their business situation in accordance with the field,
business season of the company you.
- Long-term assets of the company also increase each year, but this change is
smaller than in 2016. Accounts receivable remained relatively stable thanks to
the rational management of the company, fixed assets increased sharply By
2015, FPT will begin to implement its expansion plans, requiring more of these
assets. By 2016, this activity will continue but with a smaller investment base for
2015. The increase in assets is noteworthy for manufacturing and retail
businesses, but FPT has reduced its its long-term investment in 2015 with
10.08% (withdrawing investment in other units, increasing long-term investment
reserve).
GROUP 1
12
Financial statement analysis of FPT Corporation
Considering the proportion of assets in total assets (Appendix 2 – Table 2), we can
see that the proportion of these assets has remained relatively stable over the years.
Short-term assets have a high proportion over the years, in 2015 slightly reduced
because enterprises use it to invest in long-term assets, the business is expanding its
business. Non-business assets such as short-term and long-term financial investment
increased but accounted for a small proportion. This shows that besides the uncle in
the production business, enterprises are also interested in investing outside to bring
maximum profits for businesses. The density of each type of asset is managed and
distributed appropriately for retail and wholesale enterprises such as FPT. Large
amounts of cash, inventory, receivables and fixed assets (more than 14%). FPT
researches, develops and manufactures products that require large amounts of fixed
assets. In addition, wholesalers and retailers are required to stock up their inventories
and cash to meet the needs of rapid exchange of large amounts of customer debt that
attracts the participation of customers who have low capital.
2. Source of fund analysis
According to Table 3 in Appendix 2, corporate capital increases each year due to
the increase of both equity and debt, total resources is 22,658,343,950,733 in 2014,
achieved 26,045,588,544,428 in 2015 and increased with 14.54% in 2016. Debt ratio
must increase slightly each year while equity decreases (about 1% per year). This
fluctuation is due to the adjustment of the goodwill arising from the business merger,
the investment transaction, the increase in the ownership ratio, increase of liabilities…
However, the debt accounted for a large proportion over the three years, averaging
about 60% of total resources.
2.1. Financial autonomy
From 2014 to 2016, capital size of enterprise is expanded, capital is mostly
financed by debt and tends to increase over the years. This shows that the enterprise is
increasingly borrowing to expand production and business. The business is dependent
on externalities and the level of financial independence of the business is low but in
order to consider clearly, we need continue to analysis debt/equity ratio
Debt ratio is a solvency ratio that measures a firm’s total liabilities as a
percentage of its total assets. In a sense, the debt ratio shows a company’s ability to
pay off its liabilities with its assets. In other words, this shows FPT need average of
60 dong assets must sell in order to pay off all of its liabilities. This ratio measures the
financial leverage of FPT was use optimal. That means company had quite high levels
of liabilities compared with assets are considered highly leveraged and more risky for
lenders.
GROUP 1
13
Financial statement analysis of FPT Corporation
Self-Fund Ratio is a term that indicates the enterprise’s ability to finance
planned investments from its own resources. With percentage of ratio was around
40%, it is quite nice for FPT, they didn’t have enough money to investment but they
had enough of the self-fund sources which could help them a lot in case of the
blockage or non-availability of the funding and finances.
If we consider debt/ equity ratio, this ratio is reasonable when FPT using debt
and equity to operations, it was maintained around 1.5. FPT had a higher debt to
equity ratio indicates that more creditor financing (bank loans) is used than investor
financing (shareholders). With the actual situation of the company, we can see they
consider the proper estimate of the self-financing patterns so that there may not be any
problem afterwards
2.2. Funding stability
Accoringding to Table 4 in Appendix 2, the proportion of short-term capital
increased gradually over the years shows that the company's self-control tendency is
gradually reduced. The company is borrowing more to finance its assets
3. Financial balance analysis
3.1. Long-term financial balance
NWC
2014
3,739,200,965,743
2015
3,991,454,812,006
2016
4,476,257,267,886
Net working capital has positive and increased over the years from 2014 to
2016 showed that long-term financial balance of company is good and safe because
regular funding> long-term assets. Regular corporate funding is not only enough to
finance long-term assets but also partly for short-term assets. The business operation
of the business is not interrupted and the ability to pay high. (Refer to Appendix 2 –
Table 5).
3.2. Short-term financial balance
NWC
requirement
2014
4,696,851,673,45
7
2014
Net fund
GROUP 1
2015
2016
5,980,628,751,218
4,200,224,827,942
2015
(1,989,173,939,212
(957,650,707,714)
)
2016
276,032,439,944
14
Financial statement analysis of FPT Corporation
In 2014 and 2015, the value of Net fund < 0 => The net working capital
requirement of company bigger than net working capital. So, company has to borrow
money in the short-term to meet the needs of fundin. The financial inblance in the
short-term in this case
In 2016, the value of Net fun > 0 => The net working capital meets the capital
needs in the short-term. The excess can be used to investment in the high liquid
securiries in order to increase the efficiency of employed capital. The short term
financial balance is well. (Refer to Appendix 2 – Table 6 & 7)
V. OPERATIONAL EFFICIENCY ANALYSIS
1. Asset use efficiency
Assets turnover =
Asset use
efficiency
Average
2014
2015
2016
(2015)(2014)
1.6495
1.5834
1.56
1.4381
- 0.0661
(2016)(2015)
- 0.1453
The asset use efficiency also represents the capacity of business management. How
many dong of net sales and revenue can be generated using one dong of invested
assets. The higher the asset turnover ratio, the better the company is performing. For
FPT, we can be seen the average asset turnover is 1.56 loops, which means that 1.56
dong of net sales and revenue can be generated using 1 dong of invested assets. The
ratio has been quite low. Over the years, the difference level between assets turnover
in 2015 and 2014 is smaller than that between in 2016 and 2015 This proves that the
assets of Fpt corporation are slow to move because it has a large amount of inventory
and work in progress, besides that the number of working in progress have risen
during three years
2. Fixed asset turnover
2014
2015
2016 Average
Fixed assets use efficiency
6.2202 5.6518 4.8485
5.57
How many dong of net sales can be generated using one dong of invested fixed
assets. The higher ratio, the better the asset, and the higher the efficiency of the
business. Fpt generated 1 dong of net sales from 5.57 dong of invested fixed asset.
The data shows the effective used of fixed assets in their operation. However, the ratio
there was a slight decrease in ratios, dropped from 6.2202 (2014) to 5.6518 (2015)
and 4.8485 (2016). This can be explained by high amount of fixed asset increases
every year (FPT continuous expansion of production, researching technology so they
have a high percentage of invested intangible assets)
GROUP 1
15
Financial statement analysis of FPT Corporation
3. Working capital turnover
2014
2015
2016
Working capital turnover
(WCT)
2.1856
2.1285
1.9346
Days of WCT
165
169
186
WC save or wastage
465,942,017,616 1,861,309,918,449
Similar two indicates above, working capital turnover is an activity ratio that
measures dollars of revenue generated per dollar of investment in working capital. A
higher working capital turnover ratio is better. It means that the company is utilizing
its working capital more efficiently i.e. generating more revenue using less
investment. The ratio of FPT was quite small, that means each dollar invested in
working capital has contributed 2.1285 dong towards total net sales (2015) and
reduced at 1.9346 in 2016. A low ratio indicates inefficient utilization of working
capital during the period but they should be compared with competitors’ or industry’s
average ratio to have a meaningful idea of the company’s efficiency in using its
working capital. FPT is The Corporation for Financing and Promoting Technology,
they supply technological products for retail companies so they have a lot of
inventories and trade receivables with the number has risen annual.
It is synonymous with days of working capital turnover is very high, FPT needed
more than 160 days and nearly 200 days it takes for a company to convert its working
capital into net sales. From 2014 to 2016, Corporation had to bear the working capital
wastage. This number shows that net sales wastage has quadrupled between 2015 and
2016 (from 465,942,017,616 up to 1,861,309,918,449)
4. Disaggregating working capital turnover
Delta H working capital = H working capital of subject - H working capital of base year
Delta H working capital = Delta net sales + Delta working capital (*)
With Delta net sales = Delta working capital = 2014
2.1856
2015
2016
WC turnover
2.1285
1.9346
Delta H working capital
-0.0574
-0.1939
Delta net sales
0.3558
0.0881
Delta working capital
-0.41294
-0.2820
The table shows that Working capital turnover ratio decreased over three years, that
means Delta H working capital was less than 0 (-0.0564 in 2015 and -0.1939 in 2016),
the decline was increasing if we compared 2015 with 2016, it may be because
working capital was used inefficiently. From formula (*), we can be seen, Delta H
working capital is under influence of Delta net sales and Delta working capital, so we
will consider net sales and average working capital annual carefully.
GROUP 1
16
Financial statement analysis of FPT Corporation
Firstly compare 2015 with 2014, Net sales climbed with 0.3558, working capital
use efficiency with 0.3558 (1). Average working capital decrease 0.41294 so working
capital use inefficiency with 0.41294 (2). To combine (1) and (2), Working capital
turnover fallen with 0.0574 times. Secondly, we examine the data of 2016, Delta net
sales is 0.0881 and Delta working capital is -0.2820, so Delta H working capital is
-0.1939. Similar above case, changes of two factors lead to decrease of Working
capital turnover (0.1939 times)
5. Return on Sales (ROS)
ROS = *100%
2014
2015
2016
ROS
7.4120%
7.3942%
7.5012%
ROS is a financial ratio that calculates how efficiently a company is at generating
profits from its revenue. Investors and creditors are interested in this efficiency ratio
because it shows the percentage of money that the company actually makes on its
revenues during a period. In 2015, the ratio had a small decrease but it was back to
higher percentage (at 7.5012%) in 2016 (higher than 2014). The ROS ratio of FPT
were maintained a quite stable rate, more than 7%. It shows how well FPT
corporation is producing its core products or services and how well the management
teams are running it.s. In 2015, the cost of expanding overseas markets lead to a
decrease in ROS, and in 2016 the cost would be reduced with a better management
plan, the basic extension was completed.
6. Return on Assets (ROA)
ROA = *100%
2014
2015
2016
ROA
12.2262%
11.7081%
10.7873%
Return on assets (ROA) is an indicator of how profitable a company is relative to
its total assets. ROA gives a manager, investor, or analyst an idea as to how efficient a
company's management is at using its assets to generate earnings. The data of table
gives the information about return on assets of FPT corporation. Over the year the
ratio is quite high in the same industry, more than 10%. We can be seen that 100 dong
of invested assets to generated 12.2262 dong of profit before tax in 2014, 11.7081
dong in 2015 and 2016 with 10.7873 dong of earnings. That means, FPT’s asset
efficiency is quite good. The factor went down slightly during a period but may be
there isn’t a decline of the company’s asset management because FPT’s total asset
risen by invested fixed asset, increase of inventory, …. (data from balance sheet of
FPT can be shown these)
7. Disaggregating ROA
ROA = = ROS x AT
GROUP 1
17
Financial statement analysis of FPT Corporation
2014
2015
2016
ROS
7.4120%
7.3942%
7.5012%
Asset use efficiency
1.6495
1.5834
1.4381
Disaggregating
12.2262%
11.7081%
10.7873%
In order to make an examination of ROA fluctuation, we will concentrate ROS and
AT during a period (according to Dupont system). In 2015, ROA dropped with
0.5181%, using of Assets isn’t effective than 2014. This change is cultivated by 2
factors: ROS of FPT go down slightly with 0.0177%, that means Company declined
ability of control their costs; Assets turnover fall 0.07 times, explain product of assets
didn’t improve. Similar 2015, ROA continued to decline in 2016 but their costs
gradually improve (ROS is 7.5012%), they focus on increasing sales while
incrementally increasing expenses, or it can focus on decreasing expenses while
maintaining or increasing revenue. Assets turnover only reach a lower point of 1.4381
times
8. Return on assets variation
RE =
2014
2015
2016
RE
13.0523%
12.7860%
12.1265%
ROA
12.2262%
11.7081%
10.7873%
The ratio is considered to be an indicator of how effectively a company is using its
assets to generate earnings before contractual obligations must be paid. The greater a
company's earnings in proportion to its assets (and the greater the coefficient from this
calculation), the more effectively that company is said to be using its assets. RE in 3
years were not much different (less than 1%). When we reject effect of tax and
interest, return on assets of FPT don’t go up significantly, only 1 dong in 2014 and
2015. Next to 2016, variance is 2 dong for 100 dong of invested assets. That means
interest and tax influence the return on assets of FPT. From balance sheet, interest
expenses risen about 100 million annual, Income tax expense – deferred in 2016 is
better than 2 years (it was positive when 2014 and 2015 were negative)
9. ROE
ROE =
ROE
27.4980%
25.0830%
23.8155%
Return on equity measures a corporation's profitability by revealing how much
profit a company generates with the money shareholders have invested. In other
words, the return on equity ratio shows how much profit 100 dong of common
stockholders’ equity generates. ROE ratio of FPT reduced from 2014 to 2016, about
2% annual but it still had a larger percentage, more than 20%. With the high return on
equity, it shows that the efficiency the FPT’s operations are making use of those
funds. Specifically, in 2014, 100 dong of common stockholders’ equity generates
GROUP 1
18
Financial statement analysis of FPT Corporation
27.4980 dong of net income; 2015 with 25.0830 dong and 2016 created 23.8155
dong. We can see a high return on equity ratio of FPT, this indicates that the company
is using its investors’ funds effectively. Higher ratios are almost always better than
lower ratios, when we compared to other companies’ ratios in the industry, this ratio is
quite good.
10. Impact factors to ROE
10.1.ROS, Assets turnover
ROE = ROS * Assets turnover * * (1-T)
2014
2015
2016
ROS
7.4120%
7.3942%
7.5012%
Asset turnover
1.6495
1.5834
1.4381
ROE
27.4980%
25.0830%
23.8155%
From formula, we can be seen that impact of ROS and AT on ROE is positive.
Date of table shows a slip of ROE about 2.415% in 2015 because ROS (2015) slipped
and AT went down, too. Then, in 2016, ROS is improved, reach a point of 7.5012%
(FPT controlled cost, increase of revenue) but it isn’t efficiency to invested assets in
order to created net sales and revenues, AT continued went down 0.1453 times that
means FPT lose 0.1453 dong for 1 dong of invested assets. The changes of ROS
unchanged a slip of AT, ROE still reduced. Specific example, in 2016, FPT focus
more strongly on the research and development of SMAC, IoT and Robotic
technology solutions and services, as well as to strongly apply these technologies into
all business activities of the collective group. These required concentrating on
developing, total assets increased in this year.
10.2.Self-fund ratio
ROE = *
2014
2015
2016
Profit after tax/ total assets
10.3365%
10.0119%
9.2188%
Self-fund ratio
0.375899148
0.39914856
0.38709388
ROE
27.4980%
25.0830%
23.8155%
Self-fund ratio is the procedure in which the company or an individual spends
his own money for the completion of ongoing projects in case of unavailability of
funding sources. Over the years, Total assets and owner’s equity increased, but level
of change was different so self-fund ratio is highest in 2015 and reduced slightly in
2016. the value is less than 1, the investments will need funds from an external source
but FPT company control ratio efficiently (maintained an average of around 0.387),
they have enough of the self-financing sources which could help them a lot in case of
the blockage or non-availability of the funding and finances. Self-fund ratio is
negative if we compare them with ROE, that lead to a complete change of direction of
ROE and ratio. But it wasn’t exact in 2016, 1/ self-fund ratio risen about 0.078
GROUP 1
19
Financial statement analysis of FPT Corporation
(internal financial potential of the company declined slightly) while profit after tax/
total assets reduced 0.7930%, so ROE continued decreased at 23.8155%.
10.3.Debt to equity ratio
ROE= [debt to equity ratio*(RE-r) + RE] * (1-T)
2014
2015
2016
RE
13.0523%
12.7860%
12.1265%
ROE
27.4980%
25.0830%
23.8155%
RE(1-T)
10.1808%
9.9731%
9.4587%
Because interest rate of debt wasn’t presented in financial statement, we
choose interest rate of bank loans as follows analysis market (from 2014 to 2016,
average of percentages of rate is around 10%). From date in the table, we can see RE
of FPT company is higher than interest rare (RE > r) and ROE > RE(1-T) over the
three years, that means financial leverage of PFT were positive. FPT control their
resources is good and use leverage is effective. With this analysis, FPT can continue
borrow money in order to receive effect of financial leverage.
10.4.Interest coverage ratio (ICR)
ROE = (1 - ) * (1 – T) * RE * (1+debt/equity)
2014
2015
2016
ICR
15.7999
11.8614
9.0545
(1+debt/equity)
2.6603
2.5053
2.5834
RE
13.0523%
12.7860%
12.1265%
The interest coverage ratio is a debt ratio and profitability ratio used to
determine how easily a company can pay interest on its outstanding debt. FPT’s
interest coverage ratio is a quite higher ratio indicates a better financial health as it
means that the company is more capable to meeting its interest obligations from
operating earnings. Level of ICR is nice, it doesn’t mean a company is "too safe" and
FPT use opportunities to magnify earnings through leverage. During period, ICR
reduced from 15.7999 (2014) to 9.0545 (2016) because company has borrowed more
money to invested foreign markets, research new software. This index works in the
same direction as ROE, that means a decrease of ICR lead to a slope of ROE. In 2015,
Delta of ROE was – 2.4150% while delta of ICR was -3.9384 and in 2016 these ratios
were -1.2675% and -2.8069, that said being FPT added their debt, interest expenses
risen too, they improve benefit of leverage for their operations. Clearly, a small reduce
of ICR, a small change of ROE this indicates that the company is using its investors’
funds less effectively.
11. Indicator from cash flow
11.1. Cash flow margin
2014
GROUP 1
2015
2016
20
Financial statement analysis of FPT Corporation
CFO
1,151,039,821,400 1,155,885,029,814 4,311,658,493,292
32,644,656,358,89 37,959,698,756,02 39,531,468,663,94
Net sales
5
2
4
CF margin
3.5260%
3.0450%
10.9069%
The Cash Flow Margin ratio is an important ratio as it expresses the
relationship between cash generated from operations and sales. The company needs
cash to pay dividends, suppliers, service debt, and invest in new capital assets, so cash
is just as important as profit to a business firm. Potential investors will be paying
attention to this metric to gauge the profitability and financial standing of your
business compared to your competitors. From 2014 and 2015, net sales increased
significantly but Cash flow from operations of FPT was small, so CF margin went
down slightly, about 0.5%. Then, in 2016, this situation has improved and ratio
increased quickly at 10.9069% (It is three times higher than in 2015), that’s an
indication that they are getting better and better at converting earnings from sales into
actual cash flow (Cash flow reached a peak of over 4000 billion)
11.2. Cash flow from operations to net income = CFO/(Net income)
2014
2015
2016
CFO
1,151,039,821,400
1,155,885,029,814
4,311,658,493,292
Net income
2,459,224,202,037
2,851,148,827,721
3,013,898,666,241
46.8050%
40.5410%
143.0592%
Similar cash flow margin ratio, Cash flow from operations to net income ratio
expresses the relationship between cash generated from net income. Between 2014
and 2016, net income went up slightly when CFO risen high amount in 2016, so the
ratio fluctuated impression. The decrease of ratio in 2015 isn’t important because FPT
improved situation very rapidly. The reason may be FPT spend money to research and
develop their products, and then they could adjust operations of them. (i.e in 2015,
FPT continues to travel abroad by receiving NFSI license, providing
telecommunication services in Myanmar. FPT is the only foreign company licensed to
date in the country)
11.3. Cash flow return on assets = CFO/(Total assets)
2014
1,151,039,821,400
2015
2016
CFO
1,155,885,029,814
4,311,658,493,292
Average total
24,351,966,247,580.5 27,939,425,179,289.5
assets
20,114,450,602,122.50
0
0
Cash ROA
5.7225%
4.7466%
15.4322%
We will use cash ROA, which divides cash flows from operations (CFO) by
total assets. Cash flow from operations is specifically designed to reconcile the
difference between net income and cash flow. In this way, it is a more accurate
number to use in the calculation of ROA than net income. In 2015, Average total
GROUP 1
21
Financial statement analysis of FPT Corporation
assets raised remarkably with 4,237,515,645,458 dong while the increase of Cash
flow operating was quite small, about 4,845,208,414 dong so they lead to a decrease
of cash ROA, (Delta = -1.2459%). FPT has researched products and services so they
invested a lot of money for assets while earning from CFO isn’t not too much. Next to
2016, CFO increased quickly (because of a lot of reasons) and average total assets
risen amount equal 2015, so ratio was very higher. A high percentage of cash return
on assets is especially necessary in FPT corporation - an asset-heavy environment
(such as any manufacturing industry), where the cash is needed to maintain, update,
and invest in additional assets.
VI.THE RISK ANALYSIS:
1. Business risk analysis
The degree of operating leverage:
DOL
=
% change in operating profit
% change in sales
DOL
2014
2.6764
=
2015
2.6995
Total CM
Total CM - TFC
2016
2.8663
The operating leverage ratio over the years have increased, respectively 2.68, 2.69,
2.87 through 2014,2015 and 2016, which means that 1% of change in revenue will led
the EBIT fluctuate 2.68%, 2.69%, 2.87%. We can be seen from the table above that in
2016, DOL is highest. This shows that the level of company's risk has increased
compared with the past 2 years. Increasing the DOL means increasing the business
risk that the company incurs. Besides, fixed costs of FPT through 3 years also rise
shows that the company invests more in long - term assets and ability to leave the
industry lower.
2. Financial risk analysis
DFL
DFL
=
Profit before tax + interest expense
Profit before tax
2014
1,0676
2015
1,0921
2016
1,1242
The degree of financial leverage (DFL) measures the sentivity of a company’s ROE
to fluctuations in its operating income, as a result of changes in its capital structure. It
can be seen that this ratio of FPT increased through the years. This is because the
company's interest expense rised at a higher level than pre-tax-and-interest profit. But
overall, the degree of financial leverage of company in all 3 years was more than 1,
which means that FPT has the ability to borrow to expand its business.
3. Insolvency risk:
3.1. Current ratio:
GROUP 1
22
Financial statement analysis of FPT Corporation
2014
2015
2016
Current ratio
1,2883
1,2667
1,2570
It can be seen that the current ratio of FPT decreased over 3 years. In 2014, this
ratio was 1.2883, but in 2015, 2016, this was just only 1.2667 and 1.2570
respectively. The reason is that the growth of current assets is slower than current
liabilities. However, despite the reduction, the current ratio of FPT is still acceptable
as it is still over 1, short-term assets are still able to afford short-term debt.
The trend of reducing the current ratio of enterprises shows two things, the
good point is that this shows that enterprises do not invest too much in current assets
and the number of current assets which do not generate this revenue will decrease =>
Enterprise uses capital more efficiently. But, on the other hand, if this trend continues
decreasing in the next years, it is alarming as it makes shorten solvency and increases
the financial risk.
3.2. Quick ratio or acid – test ratio:
2014
2015
2016
Quick Ratio
0,82
0,78
0,92
In 2015, quick ratio of FPT fell because non - current debt increased 13,35%,
while its money, short - term investments, and receivables also rised against 2014 but
with a lower level. In 2016, this ratio has improved. Non-current debt increased
14,12%, but short-term assets which has high liquidity rised up to 27,22%. In general,
quick ratio of FPT over 3 years are less than 1 (0,82; 0,78; 0,92 < 1) This means that
short-term assets that can be used immediately by FPT are insufficient to cover shortterm debt. Enterprises should consider minimizing inventory to avoid the risk of
paying short-term debt resulting in a reduction in the company's reputation.
To see the liquidity problems of the company, we compare two current ratio
and quick liquidity. FPT has current ratio which is not so low but its acid - test ratio is
quite low. This is due to the high value of inventories and illiquid short-term assets of
the company accounting for a high proportion in current assets.
3.3. Cash ratio:
Cash ratio
GROUP 1
2014
0,33
2015
0,24
2016
0,35
23
Financial statement analysis of FPT Corporation
Cash ratio is a measure of the adequacy of available cash at the company to
pay short - term debt or not. It indicates the cash reserve compared to current
liabilities.
Based on the data from the table above, we see that the cash ratio of FPT
fluctuates over the years. In 2014, this ratio was 0,33 times, which means that 1 dong
of short - term debt of company is guaranteed by 0,33 dong cash and cash equivalents.
In 2015, this ratio reduced to 0,24 times. The reason is that short-term debt increased
by 13.35% while cash and cash equivalents decreased by 20.97%.
But in 2016, cash ratio of company increased to 0,35 times. Because FPT has
changed holding policy which kept more cash, and then make cash and cash
equivalents rised to 40,39% while non-current liabilities only increased 14,13%
Compared to the minimum cash ratio standard, we can see that over the past 3
years, this ratio of FPT is quite low, indicating that the company makes use of the
opportunity to make profit by cash, not let cash idle. However, if financial capacity is
not ensured, the company can't meet the payment demand when it arises and will face
pressure on payment risk.
3.4. Cash flow ratio:
2014
2015
2016
Cash flow ratio
0,089
0,077
0,247
Based on the table above, we see that the cash flow ratio changes over the
years. In 2014, this ratio was 0,089 times and in 2015, it reduced slightly to 0,077
times. But in 2016, it increased sharply to 0,247 times. The reason of this rise was due
to the net cash flow from operating activities increased dramatically (73,19%) while
short - term debt rised only 14,12%
This ratio over the years was less than 1, which indicates that the company did
not always have sufficient funds to cover the debt and and cater to their business. FPT
should have solutions to solve timely.
3.5. Interest coverage ratio:
Interest coverage ratio
2014
15,79
2015
11,86
2016
9,06
Interest coverage ratio reflects the ability of the company in paying interests on
loans from profitability of business operations. This ratio shows the relationship
between the company's interest expenses and profit before tax and interest, which
helps to assess whether the company is able to pay interest. Interest expense is a cost
that a business must pass if they do not want to fall into the risk of bankrupcty. In
2014, this ratio of the company was 15,79. This means that FPT generated a pretax
GROUP 1
24
Financial statement analysis of FPT Corporation
profit which is 15,79 times the interest expense. Thus, the ability to pay interest of the
company was quite good, because every 1 dong of interest expense, the company had
15,79 dong of profit from business activities which can be used to pay. But over the
years, the ratio decreased. This decline was due to the fact that the interest expense
increased higher than the company's pre-tax-and-interest profits (11,86 in 2015 and
9,06 in 2016).
However, this ratio was still greater than 1, indicating that FPT's ability to pay
interest and principal is fairly safe.
3.6. Inventory turnover:
Inventory turnover
Inventory turnover period
2014
6,7
54
2015
6,19
58
2016
6,33
57
Inventory turnover shows that how many turnovers inventories turn in a given
period to generate revenue. Inventory turnover period indicate how many days the
company's inventories have been spent and measure the liquidity of inventories. It can
be seen that inventory turnover of FPT has slightly fluctuated over the years. In 2014,
the inventory turnover of company was 6,7, which means that in this year, inventories
turned 6,7 times to generate revenue for the business. By 2015, the number of rounds
dropped to 6,19. The reason is that the cost of goods sold of company increased at a
higher level than the average inventories. But by 2016, this number increased softly to
6,33 rounds. However, the inventory turnover as well as inventory turnover period of
FPT was at relatively high. In fact, FPT has main business in information and
communication technology which is constantly change and updated so the price of
technology products is also falling rapidly. Therefore, if the inventory of the business
is too stagnant, it will be a big disadvantage for businesses
3.7. Receivables turnover:
Accounts receivable turnover
Accounts receivable turnover period
2014
7,60
47
2015
8,06
45
2016
7,14
50
Acccounts receivable turnover is used to measure the short-term liquidity as
well as the performance of the company, the efficiency and quality of receivables
management. It shows how many days it takes for the company to recover the
receivables. In 2014, the receivabes turnover was 7,6, which means that on average
about 47 days FPT will claim the debt within this period. But by 2015, the number of
turnovers increased to 8,06. The reason is that the revenue of the company rose at a
higher level than the average receivables, shows that FPT in this year tightened sales
GROUP 1
25