A study on low carbon development with a computable general equilibrium model application to vietnam
Bạn đang xem bản rút gọn của tài liệu. Xem và tải ngay bản đầy đủ của tài liệu tại đây (3.14 MB, 218 trang )
KYOTO UNIVERSITY
GRADUATE SCHOOL OF ENGINEERING
DEPARTMENT OF URBAN AND ENVIRONMENTAL
ENGINEERING
A Study on Low Carbon Development with a
Computable General Equilibrium Model
- Application to Vietnam -
TRAN Thanh Tu
August 2012
Table of Contents
Table of Contents ........................................................................................................ i
List of Tables ............................................................................................................. v
List of Figures ........................................................................................................... vi
List of Abbreviations ................................................................................................ ix
EXECUTIVE SUMMARY........................................................................................ 1
CHAPTER 1
1.1
INTRODUCTION .............................................................................. 5
Rationale......................................................................................................... 5
1.1.1 International framework towards global GHG emissions reduction .............. 5
1.1.2 Legal frameworks towards Climate Change mitigation in Vietnam............... 6
1.1.2.1
Socio-economic development framework ............................................. 7
1.1.2.2
Energy development framework ........................................................... 7
1.1.2.3
Environmental protection and climate change mitigation framework .... 8
1.1.3 Concrete actions of Vietnamese Government towards LCD Plan .................. 8
1.2
Research objectives and activities ................................................................. 9
1.3
Research originalities ................................................................................... 10
1.3.1 National-based scenario development for Vietnam ..................................... 11
1.3.2 New application theme of CGE model for Vietnam .................................... 12
1.3.3 Estimation of AIDADS function and its integration in AIM/CGE model .... 13
1.4
Structure of this dissertation ....................................................................... 13
References (Chapter 1) ............................................................................................ 15
CHAPTER 2
2.1
METHODOLOGICAL LITERATURE REVIEWS....................... 17
National-based LCD studies in the world ................................................... 17
2.1.1 World Bank’s LCD studies for six emerging economies ............................. 17
2.1.2 DIIS’s conference on the LCD and poverty reduction in low income
countries ................................................................................................................ 18
2.1.3 ECN’s project on LCD strategies ............................................................... 19
2.1.4 International research network towards LCS studies in Asian countries ...... 20
2.2
Previous applications of CGE models ......................................................... 21
2.2.1 Extension and application of CGE models for LCD analysis ...................... 21
2.2.1.1
IMAGE .............................................................................................. 22
2.2.1.2
IGEM ................................................................................................. 23
2.2.1.3
ADAGE ............................................................................................. 24
i
2.2.1.4
ENVISAGE ........................................................................................ 25
2.2.1.5
GCAM ............................................................................................... 27
2.2.1.6
IMACLIM .......................................................................................... 28
2.2.1.7
LINKAGE .......................................................................................... 29
2.2.2 Application of CGE models in Vietnam ..................................................... 30
2.3
2.2.2.1
Static CGE models ............................................................................. 30
2.2.2.2
Dynamic CGE models ........................................................................ 32
Improvement of consumption function in CGE model for LCD analysis.. 33
References (Chapter 2) ............................................................................................ 35
CHAPTER 3
RESEARCH METHODOLOGY ..................................................... 38
3.1
Outline of methodological framework......................................................... 38
3.2
Detail methodology ...................................................................................... 40
3.2.1 National-based scenario database development .......................................... 40
3.2.1.1
Overview ............................................................................................ 40
3.2.1.2
Description ......................................................................................... 41
3.2.1.3
Data input ........................................................................................... 45
3.2.1.4
Main mathematical equations ............................................................. 45
3.2.2 AIM/CGE[basic] model ............................................................................. 47
3.2.2.1
Overview ............................................................................................ 47
3.2.2.2
Description ......................................................................................... 48
3.2.2.3
Data input ........................................................................................... 51
3.2.2.4
Main mathematical equations ............................................................. 53
3.2.3 Estimation of AIDADS parameters and its integration in AIM/CGE[basic]
model ................................................................................................................... 67
3.2.3.1
Overview ............................................................................................ 67
3.2.3.2
Description ......................................................................................... 68
3.2.3.3
Data input ........................................................................................... 69
3.2.3.4
Integration of AIDADS function in AIM/CGE[basic] model .............. 71
3.2.3.5
Main mathematical equations ............................................................. 72
References (Chapter 3) ............................................................................................ 76
CHAPTER 4 REVIEW OF VIETNAMESE OUTLOOK TOWARDS LOW
CARBON DEVELOPMENT ...................................................................................... 77
4.1
Analysis of Vietnam historical development and energy consumption ...... 77
4.1.1 Economic structure..................................................................................... 77
ii
4.1.2 Energy consumption ................................................................................... 78
4.1.3 CO2 emissions ............................................................................................ 78
4.1.4 Main drivers of CO2 emissions ................................................................... 79
4.2
Socio-economic outlook of Vietnam ............................................................ 81
4.2.1 Population and urbanization ....................................................................... 81
4.2.2 Economic status and development targets ................................................... 82
4.3
Energy outlook of Vietnam .......................................................................... 83
4.3.1 Energy development in Vietnam ................................................................ 83
4.3.1.1
Coal .................................................................................................... 84
4.3.1.2
Oil, gas and Petroleum products ......................................................... 85
4.3.1.3
Electricity ........................................................................................... 85
4.3.1.4
Nuclear Power .................................................................................... 89
4.3.1.5
Renewable energy .............................................................................. 90
4.3.2 Energy price in Vietnam ............................................................................. 92
4.3.3 Energy saving, efficiency and conservation in Vietnam .............................. 94
4.3.4 Carbon Capture and Storage (CCS) in Vietnam .......................................... 95
References (Chapter 4) ............................................................................................ 97
CHAPTER 5 VIETNAM’S FUTURE LOW CARBON SOCIETY AND ITS
IMPLICATIONS ......................................................................................................... 99
5.1
Visions of future society in Vietnam ............................................................ 99
5.1.1 National-based scenario for main socio-economic indicators ...................... 99
5.1.1.1
Socio-economic indicators ................................................................ 100
5.1.1.2
Housing and Transportation .............................................................. 101
5.1.1.3
Energy consumption ......................................................................... 103
5.1.2 Description of future societies .................................................................. 105
5.2
5.1.2.1
A Scenario of rather STAGnant Society (SSTAG) ............................ 110
5.1.2.2
A Scenario for Low Carbon Society (SLCS) ..................................... 113
Economic implications of future LCD ....................................................... 115
5.2.1 Technology change and energy efficiency ................................................ 116
5.2.2 Transportation .......................................................................................... 117
5.2.3 Economic structure and trade ................................................................... 119
5.2.4 Price change ............................................................................................. 124
5.2.5 GDP loss .................................................................................................. 127
5.3
Social implications of future LCD ............................................................. 130
iii
5.3.1 Employment and income .......................................................................... 131
5.3.2 Change in price of goods and services for household consumption ........... 135
5.3.3 Household expenditure ............................................................................. 138
5.4
Energy and environmental issues of LCD in Vietnam.............................. 140
5.4.1 Energy supply and consumption ............................................................... 140
5.4.2 Power generation...................................................................................... 146
5.4.3 GHG emissions and reduction measures ................................................... 149
5.4.4 CCS technology and carbon price ............................................................. 151
References (Chapter 5) .......................................................................................... 153
CHAPTER 6
6.1
CONCLUDING REMARKS AND DISCUSSIONS...................... 154
Concluding remarks................................................................................... 154
6.1.1 Summary of economic implications.......................................................... 155
6.1.2 Summary of social implications................................................................ 159
6.1.3 Summary of energy and environmental issues of LCD in Vietnam ........... 162
6.2
Discussions .................................................................................................. 166
ACKNOWLEDGEMENT ..................................................................................... 170
APPENDICES ....................................................................................................... 173
Appendix A – List of Vietnamese legal documents .............................................. 173
Appendix B - Mathematical summary statements in National Scenarios
Development System.............................................................................................. 176
Appendix C - Mathematical summary statements in AIM/CGE[basic] model ... 178
Appendix D - Mathematical summary statements in AIDADS consumption
function .................................................................................................................. 203
Appendix E - Mathematical summary statements in Reconciliation System ...... 206
Appendix F - List of units ...................................................................................... 207
iv
List of Tables
Tables
Page
Table 1.1: Summary of CGE model applications for Vietnam ........................................ 12
Table 2.1: Summary of ESMAP’s activities and outputs towards LCD studies .............. 18
Table 2.2: List of research institutes in LCS-RNet ......................................................... 21
Table 3.1: List of macro parameters and potential drivers .............................................. 42
Table 3.2: List of collected indicators in Driver field ..................................................... 44
Table 3.3: List of collected indicators in Energy field .................................................... 45
Table 3.4: CCS technology cost ..................................................................................... 51
Table 3.5: Indicators of input assumption for AIM/CGE[basic] model ........................... 52
Table 3.6: Description of GHG emissions reduction measures ....................................... 52
Table 3.7: Households classification for AIDADS parameters estimation ...................... 69
Table 3.8: Group of sector and commodity classification ............................................... 69
Table 3.9: Availability of observations .......................................................................... 70
Table 3.10: Summary of Setting initial values and bounds ............................................. 75
Table 4.1: Economic development targets of Vietnam ................................................... 83
Table 4.2: Primary energy demand and domestic production outlook............................. 83
Table 4.3: Final energy demand outlook ........................................................................ 84
Table 4.4: Summary of targeted electricity production capacity of Vietnam ................... 87
Table 4.5: Vietnam Power demand forecast ................................................................... 88
Table 4.6: Energy price of Vietnam (in 2006) ................................................................ 92
Table 4.7: Household electricity pricing system of Vietnam .......................................... 93
Table 4.8: By-purpose electricity pricing system of Vietnam ......................................... 94
Table 5.1: Key features of SSTAG and SLCS and their scenarios ................................ 109
Table 5.2: Key features of BaU_SSTAG and CM_SSTAG .......................................... 112
Table 5.3: Key features of BaU_SLCS and CM_SLCS ................................................ 115
Table 5.4: Economic structure of SSTAG and SLCS ................................................... 119
Table 5.5: GDP loss (-) of reducing GHG emissions (% of total GDP in BaU) ............ 128
Table 5.6: Technologies for reducing non-energy-related emissions ............................ 151
Table 6.1: Summary of GHG emissions target and GDP loss ....................................... 168
v
List of Figures
Figures
Page
Figure 1.1: Overview of research framework ................................................................. 10
Figure 3.1: Overview of methodological framework ...................................................... 38
Figure 3.2: Overview of National-based Scenario Development .................................... 41
Figure 3.3: Structure of National-based Scenario Development ..................................... 43
Figure 3.4: Overview of AIM/CGE[basic] model .......................................................... 48
Figure 3.5: Overall structure of AIM/CGE[basic] model ................................................ 49
Figure 3.6: Production structure in AIM/CGE[basic] model .......................................... 50
Figure 3.7: Overview of AIDADS function estimation .................................................. 68
Figure 3.8: Overview of integrating AIDADS function into AIM/CGE[basic] model..... 71
Figure 4.1: GDP change by sectors ................................................................................ 77
Figure 4.2: Energy consumption change by sectors ........................................................ 78
Figure 4.3: CO2 emissions by sectors ............................................................................. 79
Figure 4.4: Changes of population, GDP, energy consumption, and CO2 emissions ....... 80
Figure 4.5: CO2 emissions changes by decomposed factors ........................................... 80
Figure 4.6: CO2 emissions changes by decomposed factors in transport sector ............... 80
Figure 4.7: CO2 emissions changes by decomposed factors in utility sector ................... 80
Figure 4.8: CO2 emissions changes by decomposed factors in heavy industry sector ...... 81
Figure 4.9: CO2 emissions changes by decomposed factors in light industry sector ........ 81
Figure 4.10: Projection of Vietnam total population and population growth rate ............ 82
Figure 4.11: Map of Zoning power system in Vietnam .................................................. 86
Figure 5.1: Total population scenarios of Vietnam ....................................................... 100
Figure 5.2: Total employment scenarios of Vietnam .................................................... 100
Figure 5.3: GDP scenarios of Vietnam (mil. 2005US$) ............................................... 101
Figure 5.4: Floor area per person scenarios of Vietnam................................................ 102
Figure 5.5: Passenger transportation volume (mil.passenger-km) ................................. 102
Figure 5.6: Freight transportation volume (mil.ton-km) ............................................... 103
Figure 5.7: Total final energy consumption by energy types ........................................ 104
Figure 5.8: Total energy consumption by economic sectors ......................................... 105
vi
Figure 5.9: Key scenario indicators of SSTAG and SLCS societies ............................. 105
Figure 5.10: GDP projections from international and domestic sources ........................ 106
Figure 5.11: Annual population and GDP growth rate of SSTAG and SLCS................ 107
Figure 5.12: Reduction of transport demand in CM cases (% of demand in BaU) ........ 117
Figure 5.13: Truck transport demand and its energy consumption ................................ 118
Figure 5.14: Total passenger transport demand and its energy consumption ................. 119
Figure 5.15: Total import (-) and export (+) of goods and services (mil. 2005USD) ..... 120
Figure 5.16: Change in import of goods and services in CM cases (% of total in BaU) 121
Figure 5.17: Change in export of goods and services in CM cases (% of total in BaU) . 123
Figure 5.18: Change in price of energy and non-energy commodities in SSTAG ......... 125
Figure 5.19: Change in price of energy and non-energy commodities in SLCS ............ 127
Figure 5.20: Total GDP and GDP per capita (at Market Exchange Rate, MER) ........... 128
Figure 5.21: Payment of industry in BaU_SSTAG and BaU_SLCS ............................. 129
Figure 5.22: Change in payment of industry in CM cases (% of total payment in BaU) 130
Figure 5.23: Total population and total employment in Vietnam .................................. 131
Figure 5.24: Total employment by economic sectors in SSTAG and SLCS .................. 132
Figure 5.25: Change in employment demand in CM cases (% of total demand in BaU) 133
Figure 5.26: Total household income and the implications ........................................... 133
Figure 5.27: Total household income by sources.......................................................... 134
Figure 5.28: Change in total household income by sources in CM cases (% of BaU) ... 135
Figure 5.29: Change in price of commodities for household consumption in SSTAG .. 136
Figure 5.30: Change in price of commodities for household consumption in SLCS ..... 137
Figure 5.31: Total household expenditure and expenditure per capita .......................... 138
Figure 5.32: Household expenditure share of commodities in SSTAG ......................... 139
Figure 5.33: Household expenditure share of commodities in SLCS ............................ 140
Figure 5.34: Total primary energy supply in STTAG ................................................... 141
Figure 5.35: Total primary energy supply in SLCS ...................................................... 142
Figure 5.36: Total final energy consumption (by energy types) in SSTAG ................... 143
Figure 5.37: Total final energy consumption (by energy types) in SLCS ...................... 144
Figure 5.38: Total final energy consumption (by sectors) in SSTAG............................ 144
Figure 5.39: Total final energy consumption (by sectors) in SLCS............................... 145
vii
Figure 5.40: Energy intensity (at Market Exchange Rate, MER) .................................. 146
Figure 5.41: Power generation by energy types in SSTAG ........................................... 147
Figure 5.42: Power generation by energy types in SLCS .............................................. 148
Figure 5.43: Total GHG emissions and emission intensity ........................................... 149
Figure 5.44: GHG emissions reduction measures ......................................................... 150
Figure 5.45: Carbon Capture and Storage (CCS) technology and carbon price ............. 152
Figure 6.1: Possibility of feasible LCS in Vietnam ...................................................... 168
viii
List of Abbreviations
ADB
Asian Development Bank
AIDADS
An Implicitly Directly Additive Demand System
ASEAN
Association of South East Asian Nations
AIM/CGE
Asian Integrated Modeling/Computable General Equilibrium
BaU
Business-as-Usual case
C&C
Contraction and Convergence
CDM
Clean Development Mechanism
CGE
Computable General Equilibrium
C.I.F
Cost Insurance and Freight
CM
Counter-Measure case
EEDD
Energy Economic Driver Database
EIOT
Energy Input-Output Table
ESMAP
Energy Sector Management Assistance Program
F.O.B
Free On Board
GAMS
General Algebraic Modeling System
GDP
Gross Domestic Product
GDX
GAMS Data Exchange
GHG
Greenhouse Gases
GMID
Global Market Information Database
GTAP
Global Trade Analysis Project
GtCO2eq
Giga-ton Carbon dioxide equivalent
ICP
International Comparison Program
IDA
International Development Association
IEA
International Energy Agency
IEEJ
Institute of Energy Economics Japan
IPCC
Intergovernmental Panel on Climate Change
LCD
Low Carbon Development
LCS
Low Carbon Society
LES
Linear Expenditure System
ix
MDGs
Millennium Development Goals
NAMA
Nationally Appropriate Mitigation Action
ODA
Official Development Assistance
OECD
Organization for Economic Cooperation and Development
RS
Reconciliation System
SAM
Social Accounting Matrix
SNA
System of National Accounts
TOE
Ton of Oil Equivalent
UN
United Nations
UNFCCC
United Nations Framework Convention on Climate Change
WTO
World Trade Organization
x
EXECUTIVE SUMMARY
Currently, there is no doubt that climate change has adverse impacts to the environment,
society and economic activities of all countries all over the world. However, putting more
efforts on the low GHG emissions development might implicate the social and economic
targets of a nation, particularly for those developing countries that have very low GHG
emissions but still put targets on energy security and minimizing the emission. As a result,
the socio-economic and energy scenarios development may provide benchmarks for longterm policy making as one of the main tools for dealing with the complexity and
uncertainty of future challenges.
AIM/CGE[basic] model has been applied to analyze the change of energy
consumption and the CO2 emissions structure in Vietnam from 1986 to 2005. This work
would provide the reliable historical information on economic development, energy
consumption, and CO2 emissions in supporting studies on the future potential for CO2
emissions reduction in Vietnam. Lately, the AIM/CGE[basic] model has been developed
to be a quasi-recursive dynamic model with an extension of production function and the
well-disaggregated energy sectors, especially in power generation. The objective is to
analyze the feasibility of implementing climate change mitigation measures and their
socio-economic implications in Vietnam towards 2050.
However, in current AIM/CGE[basic] model, the household demand function follows
Linear Expenditure System (LES) function, in which income increase does not affect the
household expenditure behavior (consumption share), leading to possible over-predicting
growth in private demand, import, and output growth requirement for food products and
under-predicts that for non-food products in developing countries, especially energy
commodities. Therefore, in order to analyze the future household consumption behavior
towards Low Carbon Society, the LES function in AIM/CGE[basic] model is replaced by
An Implicitly Directly Additive Demand System (AIDADS) function that follows Engel’s
law in describing the household expenditure change when income increases.
Two societies for the future of Vietnam are drawn based on main indicators such as
socio-economic and political factors; dependency on imported energy; energy diversity;
advanced technology progress; household consumption behavior towards environmentalfriendly products; and lastly is the CO2 emissions reduction target. The level of these
scenario indicators, except same emission reduction target, varies from low to high for
SSTAG (A-scenario-of-rather-stagnant-society) and SLCS (A-scenario-for-Low-CarbonSociety), respectively. These two societies are targeted towards GHG emissions reduction
in order to analyze the socio-economic implications and energy-environmental issues of
Low Caron Development (LCD) (through comparing the Business-as-Usual (BaU) and
1
Counter-Measure (CM) scenarios of each society). In which, SSTAG_BaU and
SLCS_BaU do not consider the emission reduction target while SSTAG_CM and
SLCS_CM have to take into account some mitigation measures in order to achieve the
reduction target with the minimum compromising to their societies. In both societies, the
underlying hypothesis of carbon tax (or emission price) is that by internationalizing
externalities, high-emission fuels become less attractive.
The SSTAG represents a continuation of the current trends in socio-economic and
energy development of Vietnam without any major changes. In which, the main
bottleneck of economic development and energy provision is the lack of resources and
capital investment. Meanwhile, The SLCS represents a higher trend in socio-economic
and energy development of Vietnam compared to SSTAG. There is higher potential of
resources and capital investment that encourage the development of a cleaner and more
efficient energy system.
Results show that there would be an economy loss for both SSTAG and SLCS in
order to reach the GHG emissions reduction target (emission in 2050 is same as that of
2005, which is around 0.37GtCO2eq). However, with higher GDP growth rate, energy
efficiency, good governance, and skilled labor; SLCS shows more promising society for
Vietnam in developing towards low carbon society.
The demand of transportation is changed according to income and GDP increases,
which is very high in SLCS compared to SSTAG, especially in the increase of truck
transport demand. In SLCS, electric truck is used at small rate while this mode is not
available in SSTAG. In general, the usage of electric vehicles for industry and household
transportation is depended on the technology change and also the price of electricity.
Secondary sector is still the main contributor to the GDP, even the share of tertiary
sector has been increased in both SSTAG and SLCS. It is projected that the total import
of goods and services in 2050 of BaU_SLCS is 2.4 times that of BaU_SSTAG and this
ratio is around 2.0 times for [CM_SLCS/CM_SSTAG]. On the other hand, the value of
this ratio for export is 2.6 times for [BaU_SLCS/BaU_SSTAG] and 2.1 times for
[CM_SLCS/CM_SSTAG]. Generally, in SLCS the price of all commodities is higher
than those in SSTAG, which is around 1.5-2 times of SSTAG in 2050, except for
petroleum product whose price in SLCS is cheaper than in SSTAG.
In overall, the total GDP of SLCS is around 2.3 times that of SSTAG. The total GDP
of SSTAG in 2050 is around 7.4 times compared to 2005 while this ratio in SLCS is
around 17 times. In SSTAG, the GDP loss is around 1.2% of its total GDP in 2050.
Meanwhile, in 2050 SLCS has higher GDP loss which is around 10% of its total GDP. It
means that the total direct cost of implementing climate change mitigation measures in
2
SLCS is higher than in SSTAG, under the context of dramatic economic development
compared to SSTAG.
In SSTAG, the total GHG emissions in 2050 is around 1.9 times compared to 2005
while total GDP is nearly 7.4 times together with 1.6 times increase in total primary
energy supply; 1.5 times increase in total final energy consumption; and 6.4 times
increase in total electricity generation. In order to achieve the GHG emissions reduction
target in 2050 (around 0.37 GtCO2eq), SSTAG has to reduce 12.4% of its total emission.
In SLCS, the total GHG emissions in 2050 is nearly 3.6 times compared to 2005,
which is also much higher compared to the emission in 2050. Meanwhile, the increase of
total GDP in 2050 is more than 17 times compared to 2005; together with 3.7 times
increase in total primary energy supply, 2.5 times increase in total final energy
consumption, and nearly 10 times increase in total electricity generation. With the target
of total GHG emissions in 2050 around 0.37 GtCO2eq, SLCS has to reduce nearly 53% of
its total emission in SLCS.
In term of social implication; in SSTAG, the household income loss starts since 2030
with 0.2% and reaches around 10% of its total income in 2050. Meanwhile, SLCS starts
to suffer the income loss since 2025 with very small lost and dramatic increase and reach
more than 15% of its total income. In SLCS, the total household expenditure increases
substantially to around 16.3 times in 2050 compared to 2005, much higher than the
increase in SSTAG. In SLCS, spending on foods is still highest share, which is around
29% of total household expenditure in 2050, followed by spending on services, electricity,
machinery and other manufacturing, transportation, and petroleum products at the share
of 18.5%, 14.5%, 10.4%, 7.7%, 7.7%, respectively.
With similar assumption of GDP growth rate as Vietnamese Government, the results
of total primary energy supply, total final consumption, and power generation are
compared and show similar with some projections of international organization such as
International Energy Agency (IEA) and Institute of Energy Economics Japan (IEEJ).
Under more stringent emission reduction (C&C target), SSTAG has to rely more on
renewable energy due to the unavailability of CCS technology. Meanwhile, SLCS
increases the contribution of CCS technology, making this technology becomes the most
important countermeasure in order to reduce the GHG emissions in SLCS. The
contribution of CCS technology in SLCS increases to more than 0.25 GtCO2eq in 2050,
higher than under CM target. Both SSTAG and SLCS have to face more expensive
emission price. In which, in 2050; the emission price of SSTAG is very high, around 400
US$/tCO2eq, while the maximum emission price in SLCS is around 306 US$/tCO2eq (in
2038) before falling down to around 150 US$/tCO2eq (in 2050). The emission price of
3
SSTAG is higher than that of SLCS since 2043 and become more than twice of SLCS in
2050 due to the unavailable CCS technology in SSTAG.
Even CGE model is one of the powerful tools to describe the whole economy of a
nation, as well as the integration of one nation with the rest of the world; so far it cannot
perform the real flexibility of the country in term of improvement in energy system and
technology system, especially in developing country like Vietnam. On the other hand, in
order to propose more appropriate climate change mitigation options and the welldesigned scenarios for future low carbon development, the methodology in this research
should extend the study to more detail household disaggregation (such as urban and rural,
and by income levels). Moreover, the simulation of household energy consumption
should be in more detail by through coupling with bottom-up household energy modeling.
4
Chapter 1 INTRODUCTION
Chapter 1 provides the international and Vietnam national rationales leading to the
necessity of this research.
Section 1.1 not only provides the international framework towards global GHG
emissions reduction (subsection 1.1.1) in which the Kyoto Protocol is the background but
also the Vietnamese legal frameworks (subsection 1.1.2) in terms of socio-economic
development, energy development, environmental protection and climate change
mitigation. The subsection 1.1.3 summarizes concrete actions of Vietnamese Government
towards Low Carbon Development (LCD) Plan.
Section 1.2 summarizes the objectives of this research and related activities.
Section 1.3 provides the research originalities in both methodology and analytical
finding that is explained deeply in Chapter 3.
Section 1.4 describes the structure of this dissertation.
1.1
Rationale
1.1.1 International framework towards global GHG emissions reduction
Currently, there is no doubt that climate change has adverse impacts to the environment,
societal and economic activities of all countries in all over the world. Since 1997, 187
countries have signed and ratified the Kyoto Protocol with main objective is to set up the
Greenhouse Gases (GHG) emissions limitation especially for developed (Annex I)
countries. As a result, it helps to develop strategies for developing (non-Annex I)
countries in achieving the sustainable socioeconomic development through Clean
Development Mechanism (CDM) which is implemented in sectors such as energy,
industry, transportation, agriculture, forestry, and waste management.
The G8 nations at recent summits have endorsed the goal of reducing global
emissions by at least 50% by 2050 (which should be relative to 1990). Such cuts are
broadly in line with a path could hold GHG level below 500ppm CO2eq and then start to
reduce them. According to World Bank (2009), this could reduce the probability of a 5ºC
increase in global temperature from around 50% to 3% or less. The target 50% reduction
means halving global emissions from 40 GtCO2eq a year to 20 GtCO2eq, or little more
than 2 ton per capita with around 9 bil. people in 2050; it also means little scope for
deviation of actual emissions from the mean for any major country, developed or
developing (note that similar per capita actual emissions does not mean similar per capita
quotas). Therefore, C&C (Contraction and Convergence) scheme (Meyer, 2000) is a
5
simple and compelling idea of achieving the global emission reduction by equally
allocating the reduction burden to everyone in the world.
Many of the poorest people in the world will be the most exposed and vulnerable to
the impacts of climate change that will occur over the next few decades. These are also
the people who are least able to afford the costs of adaptation, and who have contributed
much less than those in the rich world to the current levels of GHG in the atmosphere.
There is a fundamental inequity here and a strong imperative for the rich countries to
provide more funds to developing countries, in addition to current development
commitments, to fund the extra costs created by climate change (World Bank, 2009).
Beside some adaptation measures that developing countries are taking to minimize
the impact of changing climate, these countries including Vietnam should also follow
developed countries in considering mitigation measures especially in energy consumption;
reduce GHG emissions; and integrating these problems into policy and decision making.
Signed in Kyoto Protocol in 1998, Vietnam has been gaining benefits as other developing
countries in getting financial supports and technology transfer from developed countries
through CDM projects; therefore will improve the quality of economic development and
people’s living standards.
However, putting more efforts on the low GHG emissions development might
implicate the social and economic targets of a nation, particularly for those developing
countries that have very low GHG emissions but still put targets on energy security and
minimizing emissions.
As a result, the socio-economic and energy scenarios development may provide
benchmarks for long-term policy making therefore support policy makers better develop a
flexible strategy, or at least to assess risk associated with an unpredictable future.
Scenarios were and continue to be one of the main tools for dealing with the complexity
and uncertainty of future challenges.
1.1.2 Legal frameworks towards Climate Change mitigation in Vietnam
Vietnam is undergoing a very rapid economic development and the energy consumption
is increasing even faster, due to lack of incentives for and knowledge of energy efficiency
measures. The energy intensity of Vietnamese enterprises is high and there is room for
significant improvements. Moreover, Vietnam is one of the countries in the world
foreseen to be impacted most by climate change due to the country’s significant economic
development zones in the flood prone major river deltas of Mekong and Red River. In
addition the country’s 3,200 km long coast line is already now impacted by typhoons,
which are expected to increase in number and intensity.
6
1.1.2.1 Socio-economic development framework
According to Ministry of Planning and Investment (Vietnamese MOPI, 2011),
Vietnamese Government focuses on transforming the economic structure, upgrading the
level of technology and management, both at macro and micro levels, in order to achieve
7% per year growth rate, until 2030. The country also put target on reducing the
population growth rate through the “two-child policy”, to maintain the 1% per year during
the next one decade. In order to achieve the socio-economic targets, Vietnamese
Government approved many plans for infrastructure development, particularly
transportation (Vietnamese Government, 2009) and housing (Vietnamese Government,
2008a). As a result, the energy demand therefore also increases that leads the Vietnamese
government to develop more detail energy development plan.
1.1.2.2 Energy development framework
With the improvement from the “Power Master Plan VI” (Vietnamese Government,
2007a), the Prime Minister of Vietnam approved the national power development plan for
the 2011-2020 period with the vision to 2030 (the “Power Master Plan VII”) on 21st July
2011 under the Decision No. 1208/2011/QD-TTg (Vietnamese Government, 2011a). The
Power Master Plan VII puts strong emphasis on energy security, energy efficiency,
renewable energy development and power market liberalization. It also aims to address
various problems encountered during the implementation of the previous Power Master
Plan VI.
In order to ensure the energy security, Vietnamese Government puts effort on
developing renewable energy such as biofuel (Vietnamese Government, 2007b) and wind
(Vietnamese Government, 2011b). Moreover, Vietnamese Government still approves the
“Master plan to implement the Nuclear Power development strategy for peaceful
purposes by 2020” (Vietnamese Government, 2007c) which is revised in 2010
(Vietnamese Government, 2010a) for the extension to the year 2030. Together with the
decision of nuclear power development is the Vietnamese law on nuclear power
(Vietnamese Government, 2008b) with its detail instruction (Vietnamese Government,
2010b). After the Fukushima nuclear accidents due to the big double disasters
(earthquake leading to tsunami) in Japan on 11th March 2011, many countries have
modified and even canceled the nuclear power development in order to avoid the disaster
risks. Despite that, Vietnamese Government still maintains the nuclear power plant (NPP)
development in which Russia and Japan have been chosen as partners of the Ninh Thuan
1 and Ninh Thuan 2 NPPs Projects, respectively. The desired target is to increase the
contribution of renewable energy (RE) and nuclear power in the commercial energy
structure mix, up to 11% and 15-20% by 2025 and 2050, respectively.
7
Many energy efficiency programs are launched after the Vietnamese Government
approved the decree on thrifty and efficient use of energy (Vietnamese Government,
2003a) and the national target program on energy efficiency and effectiveness
(Vietnamese Government, 2006a), together with the decision on electricity saving
program (Vietnamese Government, 2006b). The energy efficiency issue was later put into
law in 2010 (Vietnamese Government, 2010c), however, with very general rules for
industrial and lighting, transportation, agricultural, residential and commercial sectors.
1.1.2.3 Environmental protection and climate change mitigation framework
After the Vietnam Environmental Law (Vietnamese Government, 2003b), the Vietnamese
Government issued the “Strategic Orientation for Sustainable Development in Vietnam
(Vietnam Agenda 21)” (Vietnamese Government, 2004) in order to sustainably develop
the country on the basis of close, reasonable and harmonious coordination of economic
and social development and environmental protection (Vietnamese Government, 2003c).
Lately, Vietnamese Government issued the Instruction of suitable mechanism to
adjust the operations related to Convention of Climate and Kyoto Protocol up to 2012
(Vietnamese Government, 2005), with detail revision issued in 2007 (Vietnamese
Government, 2007d). In that year 2007, Vietnamese Government decided the “National
target program on Climate change” (Vietnamese Government, 2007e) and assigned
related organizations to develop climate change mitigation measures to support the
“Vietnam Energy Efficiency Program” (Vietnamese MOIT, 2008) and detail “National
Target Program to respond to Climate Change” (Vietnamese MONRE, 2008).
1.1.3 Concrete actions of Vietnamese Government towards LCD Plan
Being one of non-Annex I Parties, Vietnam is not responsible for reduce the quantitative
GHG emissions as defined in the Kyoto Protocol but responsible for implementing some
general tasks as other developing countries such as:
- develop National Communication on climate change to United Nations
Framework Convention on Climate Change (UNFCCC);
- implement GHG inventory;
- assess the impacts of climate change on socio-economic sectors and identify the
areas and sectors that are most affected by climate change, especially sea level
rise;
- develop and implement adaptation measures;
- develop and implement mitigation options with financial and technical supports
from developed countries and international organizations;
8
- research and observe climate change;
- update and disseminate related information in order for public awareness raising
and capacity building for policy makers on climate change and CDM.
Implement the responsibility of one non-Annex I Party to UNFCCC, The Ministry of
Natural Resources and Environment (MONRE) in cooperation with related agencies
developed the Second National Communication (Vietnamese MONRE, 2010) which was
submitted to the UNFCCC Secretariat in 2010. The Second National has main contents:
results of national GHG inventory for the year 2000 and estimation of the GHG emissions
for the period 2010-2020-2030; vulnerable assessment, developing climate change
mitigation options and adaptation measures based on scenarios in Vietnam in the period
2020-2100; technology transfer; education, training and public awareness raising;
integration climate change into sustainable development program and systematic
observation and climate change monitoring information, etc.
MONRE was assigned by Vietnamese Government as a National Focal Agency for
taking part in and implementing the UNFCCC and Kyoto Protocol. Department of
Meteorology Hydrology and Climate Change under MONRE is the Designated National
Authority for CDM in Vietnam. Up to May 2008, five CDM projects of Vietnam were
registered by CDM Executive Board as CDM projects.
Strategic objectives of the National Target Program (NTP) (Vietnamese MONRE,
2008) are to assess climate change impacts on sectors and regions in specific periods and
to develop feasible action plans to effectively respond to climate change in the short-term
and long-term to ensure sustainable development of Vietnam, to take opportunities to
develop towards a low-carbon economy, and to join the international community’s efforts
in mitigating climate change and protecting the climatic system. The NTP will be
implemented for the whole country in three phases: first phase (2009-2010) is starting up,
second phase (2011-2015) is implementation and third phase (after 2015) is development.
1.2
Research objectives and activities
The main objectives of this research are to:
-
Propose a methodological framework and its application to support the low carbon
policies analysis;
-
Analyze the socio-economic implications of LCD in Vietnam by the year 2050.
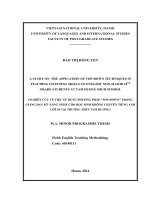
Figure 1.1 illustrates the relationship between main research objectives and specific
methods/tools as well as research activities which are describes in each chapter of this
dissertation. Main tools supporting the first objective are: scenario development system,
[Asian Integrated Modeling]/ [Computable General Equilibrium_Basic]
9
(AIM/CGE[basic]) model, and the An Implicitly Directly Additive Demand System
(AIDADS) estimation system. Meanwhile, second objective is achieved by analyzing the
results from AIM/CGE[basic] model. Literature reviews in Act. 1 and Act. 2 indirectly
support the methodology development (Obj. 1 – Act. 3) through providing the rationales
and the methodological background for this research, respectively. Furthermore, the
review of Vietnamese governmental outlook (Act. 4) provides the background for Obj. 2
including the assumption and description of future societies in Vietnam (Act. 5) and the
analysis of results from AIM/CGE[basic] model (Act. 6).
Objectives
Methods/Tools
Activities
Chapters
Act. 1: Review the international
and national rationales
Chapter 1
Act. 2: Review of methodology:
scenario development, CGE
models, AIDADS function
Chapter 2
Act. 3: Develop methodological
framework and detail methods
Chapter 3
Act. 4: Review of Vietnamese
outlook towards LCD
development
Chapter 4
Literature reviews
Obj. 1: Propose a
methodological
framework and its
application to
support low carbon
policies analysis
Scenario
development system
AIM/CGE[basic]
model
AIDADS
estimation system
Literature reviews
Obj. 2: Analyze the
socio-economic
implications of low
carbon
development in
Vietnam by 2050
Act. 5: Description of future
societies in Vietnam
Results analysis
Chapter 5
Act. 6: Analyze the results from
AIM/CGE[basic] model
Act. 7: Concluding remarks and
recommendations
Chapter 6
Figure 1.1: Overview of research framework
1.3
Research originalities
The methodology proposed in this dissertation is outstanding from a viewpoint of future
scenario development framework towards Low Carbon Development (LCD):
-
A standard methodology for the national-based scenario development of Vietnam, and
lately can be applicable for other Asian countries.
-
An AIM/CGE[basic] model with improved production function (well-disaggregated
energy sectors), extended transport and land-use parts, and improved consumption
10
function (AIDADS). Moreover, Logit function is utilized, in which the share
parameters (of energy input technology, energy sources for transport service, energy
commodities production and allocation, and energy fuel consumed by household
passenger transport) can be modified based on the price elasticity parameters to be
assumed for long term simulation that has not yet been available in other CGE models.
In term of research finding, the analysis of historical energy consumption and CO2
emissions structure provides the background for reliable disaggregated information on
relative changes of economic structure, energy structure, and CO2 emissions. Meanwhile,
the national-based scenarios (based on national development targets) are developed to be
the main input assumptions for future projections. Therefore, this research analyzes the
socio-economic implications of LCD and GHG emissions constraints towards Low
Carbon Society (LCS) in Vietnam.
The results of analyzing socio-economic implications of LCD in Vietnam have high
contribution in supporting local governments to develop comprehensive low-carbon
action plans that promote the adoption and implementation of sustainable energy policies
without or with minimum compromising the society and economy.
The future projection which is integrated with national development targets will help
to development more reliable and concrete scenarios of future society. This research
emphasizes that the resulting scenarios do not represent what is likely to happen, rather,
what is feasible if Vietnamese government is sufficiently motivated and provided with the
necessary resources towards LCD.
1.3.1 National-based scenario development for Vietnam
In order to provide the benchmark for the estimation of energy consumption and GHG
emissions in Vietnam, the Vietnam national-based scenarios are developed, in term of
socio-economic, transportation and infrastructure development. This scenario
development process is mainly based on Vietnamese national targets and development
plans. However, most of the national targets and plans only provide specific target for
pre-2030 years; therefore, other projections from national organizations and research
institutes are also taken into account in order to develop scenarios up to 2050.
Output of this national-based scenario development process is the national
macroeconomic targets that are used as main input assumptions in AIM/CGE[basic]
model for the reference scenario without any climate change mitigation action. When
mitigation actions and emission reduction target are considered, the countermeasure
scenario is conducted and compared with the reference scenario in order to highlight the
socio-economic implications of LCD. Detail of national-based scenario development is
described in Section 3.2.1 of Chapter 3.
11
1.3.2 New application theme of CGE model for Vietnam
According to Devarajan and Robinson (2002), the range of issues on which CGE models
have has an influence is quite wide, and includes structural adjustment policies,
international trade, public finance, agriculture, income distribution, and energy and
environmental policy. These CGE models also capture particular features of the economy,
such as some structural rigidities and institutional constraints; as well as provide a
consistent framework to assess the linkages and tradeoffs among different policy
packages.
However, as reviewed previously, the CGE models are applied for Vietnam mainly in
the field of analyzing the effects of trade liberalization and tariff policy on income
distribution, welfare and poverty (as summarized in Table 1.1). Instead of climate change
and environmental analysis, those studies focus only on the most crucial economic policy
of Vietnamese government since the Doi Moi policy in 1986.
Table 1.1: Summary of CGE model applications for Vietnam
Application of CGE models
on welfare
on labor market
Trade liberalization on income distribution
and tariff policy
on poverty
Static CGE models
Chan et al. (1998)
Chan et al. (2005)
Dung (2002), Chan and Dung (2002),
Huong (2003), Chan and Dung (2006)
Roland-Holst (2004), Dung and Ezaki
(2005), Fujii and Roland-Holst (2007)
directly on economic growth
and structural change
Dynamic CGE models
Harris et al. (2007)
Doanh and Heo (2009)
(improved from Chan et al. (2005))
Thanh and Toan (2007)
Dung (2009)
(improved from Dung and Ezaki (2005))
Nhi and Giesecke (2008)
Overseas remittances on Vietnamese economy
Thanh (2006)
Educational investment on wage gape and income
policy
distribution
Cloutier et al. (2008)
Even though many types of CGE models have been used to analyze the various
policy implications of climate policies on socio-economic of other countries (such as
Japan, USA, China, India and so on), none of those have been done for Vietnam and most
of developing countries. In Vietnam, the Central Institute for Economic Management
(CIEM), under the support of the Department for International Development (DFID) and
World Bank, also starts conducting the study into economics of low carbon, however, so
far only at scoping phase as reviewed previously.
Therefore, this research contributes to the expansion of CGE model applications, to
Vietnam where climate change mitigation policies also have impacts on the society and
economy. The AIM/CGE[basic] model is the main tool in this research in order to
analyze the socio-economic implications of LCD in Vietnam. Detail of AIM/CGE[basic]
model is described in Section 3.2.2 of Chapter 3.
12
1.3.3 Estimation of AIDADS function and its integration in AIM/CGE[basic]
model
Previous studies on the estimation of AIDADS function mainly base on the cross-national
data household expenditure namely International Comparison Program (ICP) in the year
1985 with the focus is only on food’s commodities. In this research, Global Market
Information Database (GMID) (Euromonitor, 2010) is used since it provides detail
commodity household expenditure for most of the countries during 1990-2010, with some
projections until 2020. Moreover, in estimating the Vietnamese AIDADS’s parameters,
the Household Living Standard Surveys (HLSSs) (Vietnamese GSO, 2011) are also used
in order to closely perform the consumption characteristic of Vietnamese households.
In addition, this research not only focuses on food commodity but also on other
industrial and commercial services for the people, in which, energy sector is welldisaggregated for the climate change analysis purpose. As a result, estimated AIDADS
parameters based on well-disaggregated commodities form a new consumption function
for AIM/CGE[basic] model. Detail of AIDADS consumption function estimation is
described in Section 3.2.3 of Chapter 3.
1.4
Structure of this dissertation
This dissertation is structured as follow:
-
Chapter 1 provides the international and Vietnam national rationales leading to the
necessity of this research. Section 1.1 not only provides the international framework
towards global GHG emissions reduction (subsection 1.1.1) in which the Kyoto
Protocol is the background but also the Vietnamese legal frameworks (subsection
1.1.2) in terms of socio-economic development, energy development, environmental
protection and climate change mitigation. The subsection 1.1.3 summarizes concrete
actions of Vietnamese Government towards LCD Plan. Section 1.2 summarizes the
objectives of this research and related activities. Section 1.3 provides the research
originalities in both methodology and analytical finding that is explained deeply in
Chapter 3. Section 1.4 describes the structure of this dissertation.
-
Chapter 2 summarizes the methodological literature review in which this research
stands on. Section 2.1 summarizes previous studies on the national-based scenario
development towards LCD in the world. As main tool which is used in this research,
it’s important to review the previous applications of CGE models for LCD analysis,
especially the application of CGE models in Vietnam (Section 2.2). Recently, many
economic analysis models are extended for analyzing the LCD; such as model’s
structure change, disaggregation of energy commodities, and the improvement of
consumption function; which are reviewed in Section 2.3.
13
-
Chapter 3 provides the overview of methodological framework of this research and
its detail methods. Section 3.1 provides the overview of methodological framework,
in which Scenario Development System is the overarching process controlling the
AIM/CGE[basic] model for analysis. Moreover, detail methodology is written in
Section 3.2 for: AIM/CGE[basic] country model (subsection 3.2.2), National-based
scenarios development process (subsection 3.2.1), and the Estimation of AIDADS
consumption function (subsection 3.2.2).
-
Chapter 4 reviews the governmental outlook of Vietnam based on the national
development targets and plans. This review is the background for the national-based
scenario development conducted in Chapter 5 of this dissertation. In this chapter,
“review” does not only mean gathering information of current governmental socioeconomic outlook (Section 4.2) but also include back-casting the historical
development of Vietnam from the LCD viewpoint (Section 4.1). Moreover, the
energy development outlook including the energy pricing system and detail content of
latest Vietnam Power Development Plan (PDP7) is reviewed in Section 4.3.
-
Chapter 5 discusses the research results. Section 5.1 describes the vision of future
society in Vietnam with a Scenario-for-Low-Carbon-Society (SLCS) and a Scenarioof-rather-STAGnant-Society (SSTAG). Section 5.2 analyzes the economic
implications and Vietnamese climate change mitigation measures by 2050. Detail
analysis of social implications is described in Section 5.3 while the energy and
environmental issues of low carbon development in Vietnam is discussed in Section
5.4.
-
Chapter 6 summarizes main findings of this research through the concluding remarks
in Section 6.1 for the characteristic of future society in Vietnam; the implications of
low carbon development on social and economic; as well as the energy and
environmental issues of low carbon society in Vietnam. Section 6.2 discusses the
reliability of the results analyzed in this study and the limitation of the applied
methodology, therefore provides suggestion for future direction.
14