YẾU tố ẢNH HƯỞNG đến sự hài LÕNG của SINH VIÊN về CHẤT LƯỢNG đào tạo của SINH VIÊN
Bạn đang xem bản rút gọn của tài liệu. Xem và tải ngay bản đầy đủ của tài liệu tại đây (766.93 KB, 10 trang )
226(13): 62 - 71
TNU Journal of Science and Technology
FACTORS AFFECTING STUDENTS’ SATISFACTION ON QUALITY OF
TRAINING SERVICES OF STUDENTS STUDYING AT THE INTERNATIONAL
SCHOOL - THAI NGUYEN UNIVERSITY
Nguyen Duc Truong1, Nguyen Thi Gam2, Duong Thi Sen3, Ha Trong Quynh1
1
*
2
TNU - International School, TNU - University of Economics and Business Administration
University of Economics and Business, Vietnam National University, Hanoi
3
ARTICLE INFO
Received:
25/6/2021
Revised:
16/8/2021
Published:
19/8/2021
KEYWORDS
Influencing factors
Satisfaction
Students
Training services
Quality of service
ABSTRACT
The competition among universities in attracting students requires
university leaders to pay attention to students’ voices, survey students'
perceptions of training services provided by the universities to
understand students’ expectation and demand. The research was
conducted to assess the current situation of training service quality at
the International School - Thai Nguyen University and its impact on
students’ satisfaction. The research was carried out through a
questionnaire survey of 220 students from the first to the fourth year
selected by stratified random method. Research results indicate that the
level of empathy, facilities, reliability, staff and responsiveness had
positive effects on students’ satisfaction on the quality of training
services at the International School - Thai Nguyen University. Based on
the research results, a number of recommendations have been proposed
to improve the quality of training services, contributing to enhancing
the quality of training and attracting domestic and foreign learners to
study at the International School - Thai Nguyen University.
YẾU TỐ ẢNH HƯỞNG ĐẾN SỰ HÀI LÕNG CỦA SINH VIÊN VỀ CHẤT LƯỢNG
DỊCH VỤ ĐÀO TẠO CỦA SINH VIÊN KHOA QUỐC TẾ - ĐẠI HỌC THÁI NGUYÊN
Nguyễn Đức Trường1, Nguyễn Thị Gấm2, Dương Thị Sen3, Hà Trọng Quỳnh1*
1
Khoa Quốc tế - ĐH Thái Nguyên, 2Trường Đại học Kinh tế và Quản trị kinh doanh – ĐH Thái Nguyên
Trường Đại học Kinh tế - ĐH Quốc gia Hà Nội
3
THƠNG TIN BÀI BÁO
Ngày nhận bài:
25/6/2021
Ngày hồn thiện:
16/8/2021
Ngày đăng:
19/8/2021
TỪ KHĨA
Yếu tố ảnh hưởng
Sự hài lòng
Sinh viên
Dịch vụ đào tạo
Chất lượng dịch vụ
TÓM TẮT
Sự cạnh tranh giữa các trường đại học với nhau trong việc thu hút sinh
viên đòi hỏi ban lãnh đạo các trường đại học cần lắng nghe tiếng nói của
sinh viên, khảo sát sự cảm nhận của sinh viên về dịch vụ đào tạo nhà
trường đang cung cấp để biết sinh viên muốn gì và cần gì. Nghiên cứu
được thực hiện nhằm đánh giá thực trạng chất lượng dịch vụ đào tạo tại
Khoa Quốc tế - Đại học Thái Nguyên và ảnh hưởng của nó tới sự hài lịng
của sinh viên. Nghiên cứu được thực hiện thơng qua khảo sát bằng bảng
hỏi 220 sinh viên từ năm thứ nhất đến năm thứ tư được lựa chọn theo
phương pháp ngẫu nhiên phân tích. Kết quả nghiên cứu cho thấy mức độ
cảm thông, cơ sở vật chất, độ tin cậy, nhân viên và mức độ đáp ứng có ảnh
hưởng tích cực đến sự hài lòng của sinh viên đến chất lượng dịch vụ đào
tạo tại Khoa Quốc tế - Đại học Thái Nguyên. Dựa vào kết quả nghiên cứu,
một số kiến nghị đã được đề xuất nhằm nâng cao chất lượng dịch vụ đào
tạo góp phần nâng cao chất lượng đào tạo và thu hút người học trong và
ngoài nước tới học tập tại Khoa Quốc tế - Đại học Thái Nguyên.
DOI: />*
Corresponding author. Email:
62
Email:
TNU Journal of Science and Technology
226(13): 62 - 71
1. Introduction
International integration has created favorable conditions for Vietnam to develop socioeconomy, exchange and acquire new knowledge and transfer science and technology, and share
experiences with each other. In line with the trend, the university system is inevitable to do the
internationalization, which is both an opportunity and a challenge and pressure for institutes and
universities in our country to improve the quality of education. Over the past years, universities
in Vietnam have also increasingly focused on building and completing management, planning,
design, teaching and research in order to further improve the quality of training in order to
achieve higher education standards which can best meet the needs of human resources not only in
the country but also abroad.
During university-level human resource training, students are the direct object of the training
process and are also the main "products", so students' feedbacks on satisfaction with training
quality play an important role. This is an essential and objective information channel which
makes a great contribution to the assessment of the current training quality, helps schools to make
reasonable adjustments towards better meeting the needs of learners and society.
According to Kotler and Keller [1], satisfaction is a state of a person's level of feeling derived
from comparing the perception of a product with the person's expectations. Oliver [2] and
Zineldin [3] also stated that customer satisfaction is the emotional feedback of customers to a
service provider on the basis of comparing the difference between what they receive and what
they previously expected. According to Douglas et al. [4], important aspects of training services
relate to core services such as lectures, knowledge acquisition, class notes and classroom and
equipment arrangement, lecturers’ good professional qualifications. Chen et al. [5] pointed out
that the factors from the satisfaction model which can explain a large number of variables on
student loyalty include management of the school, academic performance, interpersonal
relationships, and facilities.
Nguyen Thanh Long [6] did a research on using SERVPERF scale to assess the quality of
higher education at An Giang University. The results of multivariate regression analysis showed
that student satisfaction depended on the factors of lecturers, facilities, trust and sympathy.
Nguyen Khai Hoan and Nguyen Phuong Thao [7] studied the relationship between the quality of
training service and the satisfaction of students at Tan Trao University. Accordingly, among five
factors of dependability, application potential, service capacity, sympathy, and facilities,
sympathy and service capacity had the most influence on student satisfaction.
The International School of Thai Nguyen University was established by Decision No.
467/QD-DHTN dated June 16th, 2011 of the Director of Thai Nguyen University. The
International School is responsible for university education with 4 majors including
International Business, Business Administration, Accounting, Environmental Management &
Sustainability. The training program at the International School is an advanced program
imported from the UK. Every year, the International School has nearly 200 domestic and
foreign students enrolled in the school.
Finding out students' satisfaction with the products provided by the International School –
Thai Nguyen University is very important. On that basis, the International School – Thai Nguyen
University will provide students with better services which are suitable for learners’
requirements, bringing them the possible highest satisfaction, at the same time enhancing the
position and promote its brand to everyone, especially to parents and high school students in their
selecting the future school.
The research was conducted with the aim of assessing the satisfaction of students about the
training services of the International School, Thai Nguyen University and proposing solutions to
improve the training quality of the International School, contributing to attract enrollment and
affirm position of the International School in providing high-quality human resources.
63
Email:
226(13): 62 - 71
TNU Journal of Science and Technology
2. Methodology research
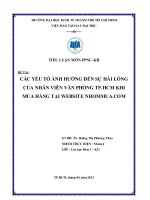
2.1. Research models
RELIABILITY
H1
RESPONSIVENESS
H2
H3
SERVICE CAPABILITIES
H4
LEVEL OF EMPATHY
H5
STUDENTS’ SATISFACTION
ON QUALITY OF TRAINING
SERVICES OF THE
INTERNATIONAL SCHOOL THAI NGUYEN UNIVERSITY
FACILITIES
Figure 1. Research models
From the research of [1] - [7], a research model (Figure 1) was proposed to measure student's
satisfaction about the quality of training services at the International School - Thai Nguyen
University through relationship between service quality's components and customer satisfaction.
2.2. Methods of collecting information
* Subjects of the survey: Subjects of the survey are students studying in all majors and courses
of the International School, Thai Nguyen University.
* Sample size: The sample size was calculated using the following formula [8].
NZ 2 p (1 p )
n=
Nd 2 Z 2 p (1 p )
where:
n = Desired sample size
Z = Standard deviation, at 1.96, corresponding to a 95% confidence level
p = Overall targets were assessed to have specific general characteristics, usually at 50% (0.5).
d = Expected accuracy, usually at 0.05
The number of students studying at the International School as of the time of implementation
was 471 students, so the number of samples to choose was:
471 x 1.962 x 0.5 x (1 - 0.5)
n=
= 211.58
471 x 0.052 + 1.962 x 0.5 x (1 - 0.5)
So the minimum number of samples to get was 212 questionnaires. To ensure the minimum
number of samples, the author investigated 220 questionnaires. The selected samples ensure the
representativeness of the group of respondents, both representative and broadly investigated.
Sampling method: Based on the student list of the International School, students were divided
into groups based on the criteria of majors and courses. Based on the list of students divided into
groups of respondents, the rate of sample selection from the target groups was calculated. After
that, the selection of research samples from groups of subjects investigated was conducted by
random methods to ensure both the correct rate calculated and the correct number of survey
samples. Based on the number of students of each course and each major, the number of
questionnaires was allocated as presented in table 1.
64
Email:
226(13): 62 - 71
TNU Journal of Science and Technology
Table 1. Investigation sample selection
No.
1
2
3
4
Criteria
Number of students
currently enrolled
Freshmen/ First-year students
Sophomore/ Second-year students
Junior/ Third-year students
Senior/ Fourth-year students
Total
161
133
101
76
471
Number of samples
Business Environment
Total
Major
major
75
62
58
4
48
45
3
35
33
3
220
136
10
After conducting the survey, the author obtained 220 survey questionnaires, including 03
invalid survey questionnaires. Thus, the number of survey questionnaires used for analysis was
217 survey questionnaires.
* Form of survey: the survey was conducted through direct interviews with the respondents by
using a questionnaire.
* Time of survey: in May, 2020
* Scale of the questionnaire: The questionnaire was built by the author based on the
evaluation of two factors "Importance" and "score". The 5-level Likert Scale was used in this
research. The scale was calculated as follows: 1 - Very Dissatisfied, 2 - Dissatisfied, 3 Moderate/Yes or No, 4- Satisfied and 5- Very Satisfied.
3. Research findings
3.1. Test of the scale by Cronbach's alpha coefficient
* Test of the scale of training service quality
The training service quality scale was measured through 5 components: reliability (REL);
response (RES); empathy (EMP); service capacity (ASS) and facilities (TAN). After performing
the test, the author obtained the following results:
The value of the coefficients of each factor was greater than 0.7; the variable and total
correlation coefficient was greater than 0.3 (except for TAN4 and TAN6 with variable and total
correlation coefficient less than 0.3). TAN4 had Corrected Item-Total Correlation = 0.257. TAN6
had Corrected Item-Total Correlation = 0.180. Therefore, the variables TAN4 and TAN6 were
removed from the alpha test.
After removing TAN4, TAN6 from the test and re-testing, the Alpha coefficient of the
tangible factor increased from 0.729 to 0.778.
* Test of scale of student's satisfaction
When performing the test of scale of student's satisfaction using Cronbach's alpha
coefficient, the author obtained the following test results: the correlation coefficient between
the variable and the total was greater than 0.3 and the Alpha was greater than 0.7. Thus, all the
items of the student's satisfaction scale satisfied the conditions and were included in the
analysis in the next steps.
3.2. The analysis of discovery factor EFA
First time: Put all 32 research variables into factor analysis, the results of the first analysis
were as follows: KMO = 0.895; Eigenvalua (1.082) > 1, the total extraction (59.594%) > 50%
and there was 1 variable with the load factor < 0.5 (TAN7: The wifi system is strong enough to
access and find the necessary information).
The second time: After removing the variable TAN7, the author continued to take one
variable out of the EFA factor analysis with the results of the second analysis as follows: KMO =
0.895; Eigenvalua (1.082) > 1, the total variance extracted (60.395%) > 50% and there were 3
65
Email:
TNU Journal of Science and Technology
226(13): 62 - 71
variables with load factor <0.5 (REL7: Reliable, fair and convincing assessment of learning
results; TAN5: The International School’s support services such as parking lot, sports, etc are
very good; EMP1: The theoretical and practical lessons are conveniently arranged for students).
The third time: After eliminating 3 unsuitable variables, the remaining 28 variables continued
to be included in EFA factor analysis with Varimax rotation, factor results were extracted
according to Principal Component Analysis method.
After factor analysis, there was a component of the previous training service quality scale,
"service capabilities", was excluded from the research model. Instead, there were two new
components: "lecturers" and "staff". This was completely reasonable in terms of content.
Concretely, based on the actual case at the International School, the two main subjects of the
"service capabilities" component were lecturers and staff that were evaluated differently by
students. All elements of the new scale would be used to replace the previous scale in the
subsequent analysis.
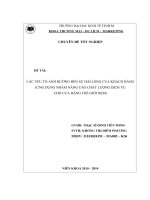
3.3. Research models adjustment and hypotheses
RELIABILITY (FAC REL)
LEVEL OF EMPATHY (FAC EMP)
STUDENTS’ SATISFACTION
ON QUALITY OF TRAINING
SERVICES OF THE
INTERNATIONAL SCHOOL
- THAI NGUYEN
UNIVERSITY (SAT)
RESPONSIVENESS (FAC RES)
LECTURERS (FAC LEC)
FACILITIES (FAC TAN)
STAFFS (FAC STA)
Figure 2. Model of satisfaction assessment of students enrolled
in the International School about training service quality (after adjustment)
After conducting the test and analysis above, the results showed that the proposed research
model was no longer suitable for the specific case of measuring satisfaction of students enrolled
in the International School. The new training service quality scale was measured from a
component consisting of 28 observed variables, which were "Reliability level" - FAC_REL;
"Empathy level" - FAC_EMP; "Responsiveness" - FAC_RES; "Lecturers" - FAC_LEC;
"Facilities" - FAC_ TAN; and "Staffs" -FAC_STA. The research model and hypotheses were
adjusted as presented in Figure 2.
3.4. Regression analysis and model testing
3.4.1. Describe the factors that measure satisfaction level
After factor analysis and recalculation of the new factors, the results were displayed in Table
2. Accordingly, REL - reliability, RES - responsiveness, LEC – lecturer had the average value
larger the EMP factor - empathy level, TAN - facilities, STA - staffs are close to equal. This
proved that the students’ assessment of these factors was relatively good. The largest average
value was 3.995 for the factor "lecturers" and the smallest factor was 3.432 for the factor
"facilities". TAN - facilities had the smallest mean, proving that the majority of students were not
satisfied with the factors of the International School's facilities when surveying.
In general, as it can be seen, the students of the International School relatively agreed with the
factors of service quality except for 2 factors: "facilities" and "staffs". However, in order to know
among factors REL, RES, LEC, EMP, TAN and STA, which factors have a significant influence,
66
Email:
226(13): 62 - 71
TNU Journal of Science and Technology
which factors have a small effect on students’ satisfaction, we need to conduct the correlation
analysis step and the next regression.
Table 2. Descriptive statistics of the factors
N
217
217
217
217
217
217
217
RELIABILITY
LEVEL OF EMPATHY
RESPONSIVENESS
LECTURERS
FACILITIES
STAFFS
Valid N (listwise)
Minimum
1.00
1.00
1.00
1.00
1.00
1.00
Maximum
5.00
5.00
5.00
5.00
5.00
5.00
Mean
3.629
3.471
3.701
3.995
3.432
3.495
Std. Deviation
0.65498
0.67706
0.65028
0.57889
0.88596
0.80287
3.4.2. Pearson correlation analysis
The correlation between the dependent variable (Students’ satisfaction) and the independent
variable (trust, empathy, responsiveness, lecturers, facilities, and staffs) had coefficients of
greater than 0.1; the highest was the empathy level = 0.620 and the lowest was the lecturers =
0.434. Thus, we can conclude that the independent variable can be included in the model to
explain the dependent variable. On the other hand, besides the correlation between the
independent variables and the dependent variables, there was also correlation between the
independent variables of the scale of training services quality, the correlation coefficients among
the variables were larger than 0.1. Concretely, the lowest correlation coefficient was 0.279, the
highest correlation coefficient was 0.465. Therefore, all these variables were considered
independent variables in the next regression models. Because of the correlation of these
variables, attention should be paid to the problem of multicollinearity in subsequent analysis.
3.4.3. Multivariate regression analysis
Through the results of Pearson correlation analysis above, we can see that all independent
variables of the model were strongly correlated with the dependent variable; therefore, all these
variables were selected for inclusion in the next analysis step, which is multivariate regression
analysis.
In this analysis, to evaluate the suitability of the model, we used the determination coefficient
R2 or adjusted R2. These two values represent the suitability of the model, and the value of R2 or
adjusted R2 must be greater than or equal to 0.5.
On the other hand, to test the suitability of the model, F-test was used; this test hypothesizes
H0 = independent variables that do not affect the dependent variables. If the sig value is very
small, < 0.05, it is safe to reject the hypothesis H0 and this means that the multiple linear
regression model is suitable for the data set.
With the Enter method (the variables included once), the results of the multiple linear
regression analysis are given below.
Table 3. The regression results using the method Enter
Model
R
R Square
Adjusted R Square
1
0.781a
0.610
0.606
a. Predictors: (Constant), STA, REL, TAN, LEC, RES, EMP
Std. Error of the Estimate
0.45861
Table 3 shows that the value R2 = 0.610 and adjusted R2 = 0.606. This proves that the model
achieved the adequacy level of 1%; or in other words, 60.4% of the variability of the students’
satisfaction variable (SAT) was explained by the independent variable in the model.
67
Email:
226(13): 62 - 71
TNU Journal of Science and Technology
Table 4. The analysis results of variance ANOVA
ANOVAb
Model
Sum of Squares
df
Mean Square
Regression
73.852
4
23.309
Residual
44.599
213
0.210
Total
118.451
217
a. Predictors: (Constant), STA, REL, TAN, LEC, RES, EMP
b. Dependent Variable: SAT
1
F
110.821
Sig.
0.000a
The results in Table 4 show that the F-statistic had very small sig value which was equal to
0.000, so the regression model built was suitable for the data collected. Thus, the independent
variables in the model had relationships with the dependent variable.
Through the above results, the model was seen not to violate the multi-collinearity
phenomenon because the variance magnification coefficients of independent variables (VIF)
were all less than 2, so the chain correlation phenomenon (multicollinearity problem) was not
necessary to be considered.
The result also shows sig. values of the independent variables REL, EMP, RES, TAN, STA
were less than 0.05, so these independent variables had impacts on students’ satisfaction with
95% reliability. However, in the independent variable included in the initial multiple linear
regression analysis, there was a variable LEC with sig value. = 0.108 > 0.05, the alternative
hypothesis that lecturers have impacts on students’ satisfaction was rejected. At the same time,
we can also see that with a reliability of 95%, the independent variable LEC - lecturers had no
effects on satisfaction of students enrolled in the International School. In terms of content
value, it is possible that lecturers of the International School ensured the training quality
factors, so students did not pay much attention to this factor. In other words, according to the
Kano model, this factor belongs to the group of basic characteristics, must have, so whether to
increase or decrease this factor will have small effect on students’ satisfaction. However,
lecturers' activities such as being on time for class, taking care of students... were factors that
made students satisfied.
Table 5. Table of analysis of multivariate regression coefficients
Model
1
a.
Unstandardized
Standardized
Coefficients
Coefficients
B
Std. Error
Beta
(Constant)
-0.489
0.156
REL
0.284
0.038
0.254
EMP
0.281
0.042
0.262
RES
0.092
0.043
0.083
LEC
0.072
0.045
0.057
TAN
0.214
0.029
0.260
STA
0.155
0.032
0.172
Dependent Variable: SAT
Collinearity
Statistics
Tolerance VIF
t
Sig.
-3.127
7.210
6.711
2.186
1.609
7.425
4.618
0.002
0.000
0.000
0.028
0.108
0.000
0.000
0.728
0.605
0.620
0.727
0.744
0.677
1.374
1.654
1.613
1.376
1.345
1.477
On the other hand, we see that the standardized regression coefficients (Beta) of the
independent variables were all positive signs, which means that these variables were positively
related to the dependent variable of students’ satisfaction. From the results in Table 5, we formed
a multivariate regression equation with standardized Beta coefficients as follows:
SAT = 0.254 REL + 0.262 EMP + 0.083 RES + 0.260 TAN + 0.172 STA
68
Email:
TNU Journal of Science and Technology
226(13): 62 - 71
3.4.4. Test the hypotheses of the research model
We see that there is a hypothesis that needs to be tested as H1 to H6, both of which provide a
positive relationship between the scale of training service quality and the satisfaction of students
enrolled in the International School. Through the analysis results above, based on sig. value in the
multivariate regression analysis, the author has found that with reliability of 95%, 5 initial
hypotheses namely H1, H2, H3, H5, H6 were accepted; the hypothesis H4 was rejected.
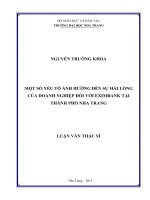
The model in Figure 3 clearly shows the influence of these factors on the satisfaction of
students of the International School including reliability"; "level of empathy"; "responsiveness";
"facilities" and "staffs", among which the most influential factors were "facilities" and "level of
empathy"; followed by "reliability"; "staffs" and finally "responsiveness".
After regression analysis, there were 5 factors that affected students’ satisfaction: facilities,
empathy level, reliability, responsiveness and staffs. Based on standardized Beta coefficients, the
importance of these factors to students’ satisfaction was determined. On the other hand,
descriptive statistics also gave us the results of the students’ assessment towards these 5 factors.
LEVEL OF EMPATHY (FAC EMP)
+0.262
FACILITIES (FAC TAN)
RELIABILITY (FAC REL)
STUDENTS’ SATISFACTION ON
QUALITY OF TRAINING
SERVICES OF THE
INTERNATIONAL SCHOOL THAI NGUYEN UNIVERSITY
+0.260
+0.254
+0.172
STAFFS (FAC STA)
+0.083
P < 0.05
R2 = 61%
RESPONSIVENESS (FAC RES)
Figure 3. The influence level of these factors on students’ satisfaction
Table 6. Standardized weights and average values of all factors
Factors
FAC_TAN
FAC_EMP
FAC_REL
FAC_STA
FAC_RES
Standardized weights
0.260
0.262
0.254
0.172
0.083
Average values
3.432
3.471
3.629
3.495
3.701
Table 6 reveals that the factors "facilities" and "level of empathy" had the highest weight,
proving that these two factors had the most significant effects on students’ satisfaction.
Simultaneously, these two factors also had the lowest average value of the 5 factors. This shows
that although these were two important factors, students were most dissatisfied and
underestimated. Therefore, these two factors should be prioritized to improve immediately.
The factor "staffs” whose weight was small was underestimated at an average level, so this
factor should be prioritized to improve after two factors "facilities" and "level of empathy". The
other two factors "reliability" and "responsiveness" also affected students’ satisfaction and were
rated as good by students but with low GPA, so these are also problems that need improving.
69
Email:
TNU Journal of Science and Technology
226(13): 62 - 71
4. Conclusions and recommendations
4.1. Conclusions
Research results show that, after testing, supplementing and adjusting, the scales achieved the
reliability and allowable value. The results also show that the quality of training services after
factor analysis of EFA including reliability, responsiveness, empathy level, facilities, lecturers
and staffs were different from the prototype SERVPERF scale because the factor of service
capabilities was separated into 2 components: lecturers and staffs. The results of multivariate
regression analysis also show the relationship between students’ satisfaction and 5 factors
including facilities, reliability, empathy, responsiveness and staffs. This result is similar to the
research of Nguyen Thi Hong Van [9].
The factor "level of empathy" had the highest weight with peta coefficient of 0.262. It proves that
this factor had the most impact on student satisfaction. This result is similar to the research of
Khai Hoan Nguyen and Phuong Thao Nguyen [7]. The questions of this factor focused on
whether the lecturer and staff of International School really share, sympathize and understand
students. The second factor that had a great influence on student’s satisfaction was “facilities”.
This result is similar to the research of Pham Thi Lien [10]. This factor was formed from the
synthesis of 7 variables of the scale “facilities”. All questions focused on equipment, classrooms,
libraries, internet, living services... for the learning process of students at the International
School. “Reliability” and “staff” also had a significant influence on student’s satisfaction. The
factor "responsiveness" had the least influence on student’s satisfaction with β = 0.082. This
result is similar to the research of Nguyen Thi Hong Van [9].
4.2 Recommendations
Through the results of analysis and calculation, the authors recommend some solutions that
need to be implemented as follows:
- In addition to the expansion of investment and construction of facilities, it is necessary to refocus on the quality of the facilities at the old facilities, to ensure that students are satisfied with
the quality of training services provided by the International School.
- It is necessary to periodically consult, understand practical needs of students and build a
good relationship with students.
- The School should arrange, reorganize the management apparatus and adjust more
appropriately to improve the quality of student service.
- The School should organize training and fostering professional capacity for staffs to
improve service capacity.
- It is also important to improve the quality of lecturers by creating favorable conditions for
lecturers to have the opportunity to study and do professional research at home and abroad.
- The service quality assessment scale and student's satisfaction need improving on a regular
basis.
- It is necessary to build a quality assurance system in the International School.
- The School should further diversify types of training such as continuity training, joint
training in Vietnam and abroad to effectively exploit the existing facilities while changing and
further promoting the school's brand throughout the provinces in the country and neighboring
countries.
REFERENCES
[1] P. Kotler and K. Keller, Marketing Management, 12th ed. Prentice Hall, Upper Saddle River, 2006.
[2] R. L. Oliver, "Whence Consumer Loyalty," Journal of Marketing, vol. 63, pp.33-34, 1999.
70
Email:
TNU Journal of Science and Technology
226(13): 62 - 71
[3] M. Zineldin, "Beyond relationship marketing: technologicalship marketing," Marketing Intelligence &
Planning, vol. 18, no. 1, pp. 9-23, 2000.
[4] J. Douglas and A. Douglas, "Measuring student satisfaction at a UK university," Quality Assurance in
Education, vol. 14, no. 3, pp. 251-267, 2006.
[5] Y.-F. Chen, C.-H. Hsiao, and W.-C. Lee, “How does student satisfaction influence student loyaltyFrom the relationship marketing perspective,” preseted in The Seventh National Educational
Conference, Taiwan, 2005.
[6] T. L. Nguyen, "Using the SERVPERF scale to assess the quality of higher education," Scientific
reports, An Giang University, 2006.
[7] K. H. Nguyen and P. T. Nguyen, "Research on the relationship between training service quality and
student satisfaction at Tan Trao University," Tan Trao University Journal of Science, vol. 3 no. 6, pp.
59-63, 2017.
[8] F. P. David, Understanding and doing Research: a handbook for beginners. Panorama Printing Inc,
2005.
[9] H. V. Nguyen, "Assessing of student's satisfaction on training service quality at Hung Vuong
University, Ho Chi Minh City," Graduate Thesis, Hung Vuong University, Ho Chi Minh City, 2013.
[10] T. L. Pham, "Training service quality and student's satisfaction: A case study of the College of
Economics, Vietnam National University, Ha Noi," VNU Joural of Science: Economics and Business,
vol. 32, no. 4, pp. 81-89, 2016.
71
Email: