Tài liệu Bài tập về Kinh tế vĩ mô bằng tiếng Anh - Chương 8 docx
Bạn đang xem bản rút gọn của tài liệu. Xem và tải ngay bản đầy đủ của tài liệu tại đây (102.9 KB, 12 trang )
Chapter 8: Profit Maximization and Competitive Supply
102
CHAPTER 8
PROFIT MAXIMIZATION AND COMPETITIVE SUPPLY
EXERCISES
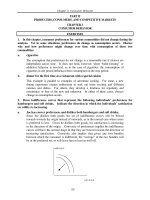
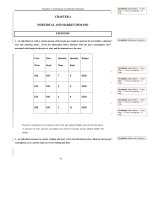
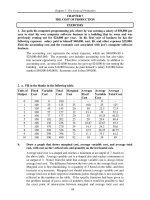
1. The data in the following table give information about the price (in dollars) for which a
firm can sell a unit of output and the total cost of production.
a. Fill in the blanks in the table.
b. Show what happens to the firm’s output choice and profit if the price of the product
falls from $60 to $50.
Q P
TR
P =
60
TC
π
P =
60
MC
MR
P = 60
TR
P =
50
MR
P =
50
π
P = 50
0 60 100
1 60 150
2 60 178
3 60 198
4 60 212
5 60 230
6 60 250
7 60 272
8 60 310
9 60 355
10 60 410
11 60 475
The table below shows the firm’s revenue and cost for the two prices.
Q P
TR
P =
60
TC
π
P =
60
MC
MR
P = 60
TR
P =
50
MR
P =
50
π
P = 50
0 60 0 100 -100 0 -100
1 60 60 150 -90 50 60 50 50 -100
2 60 120 178 -58 28 60 100 50 -78
3 60 180 198 -18 20 60 150 50 -48
4 60 240 212 28 14 60 200 50 -12
5 60 300 230 70 18 60 250 50 20
6 60 360 250 110 20 60 300 50 50
7 60 420 272 148 22 60 350 50 78
8 60 480 310 170 38 60 400 50 90
9 60 540 355 185 45 60 450 50 95
Chapter 8: Profit Maximization and Competitive Supply
103
10 60 600 410 190 55 60 500 50 90
11 60 660 475 185 65 60 550 50 75
At a price of $60, the firm should produce ten units of output to maximize profit
because this is the point closest to where price equals marginal cost without having
marginal cost exceed price. At a price of $50, the firm should produce nine units to
maximize profit. When price falls from $60 to $50, profit falls from $190 to $95.
2. Using the data in the table, show what happens to the firm’s output choice and profit if
the fixed cost of production increases from $100 to $150, and then to $200. Assume that the
price of the output remains at $60 per unit. What general conclusion can you reach about
the effects of fixed costs on the firm’s output choice?
The table below shows the firm’s revenue and cost information for fixed cost, FC of
100, 150, and 200.
In all of the given cases, with fixed cost equal to 100, then 150, and then 200, the
firm will produce 10 units of output because this is the point closest to where price
equals marginal cost without having marginal cost exceed price. Fixed costs do not
influence the optimal quantity, because they do not influence marginal cost. Higher
fixed costs also result in lower profits.
Q P
TR
TC
FC =
100
π
FC =
100
MC
TC
FC =
150
π
FC =
150
TC
FC =
200
π
FC =
200
0 60 0 100 -100 150 -150 200 -200
1 60 60 150 -90 50 200 -140 250 -190
2 60 120 178 -58 28 228 -108 278 -158
3 60 180 198 -18 20 248 -68 298 -118
4 60 240 212 28 14 262 -22 312 -72
5 60 300 230 70 18 280 20 330 -30
6 60 360 250 110 20 300 60 350 10
7 60 420 272 148 22 322 98 372 48
8 60 480 310 170 38 360 120 410 70
9 60 540 355 185 45 405 135 455 85
10 60 600 410 190 55 460 140 510 90
11 60 660 475 185 65 525 135 575 85
3. Use the same information as in Exercise 1.
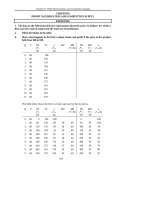
a. Derive the firm’s short-run supply curve. (Hint: you may want to plot the appropriate
cost curves.)
The firm’s short-run supply curve is its marginal cost curve above average variable
cost. The table below lists marginal cost, total cost, variable cost, fixed cost, and
average variable cost. The firm will produce 8 or more units depending on the
market price and will not produce in the 0-7 units of output range because in this
range AVC is greater than MC. When AVC is greater than MC, the firm minimizes
losses by producing nothing.
Chapter 8: Profit Maximization and Competitive Supply
104
Q TC MC TVC TFC AVC
0 100 0 100
1 150 50 50 100 50.0
2 178 28 78 100 39.0
3 198 20 98 100 32.7
4 212 14 112 100 28.0
5 230 18 130 100 26.0
6 250 20 150 100 25.0
7 272 22 172 100 24.6
8 310 38 210 100 26.3
9 355 45 255 100 28.3
10 410 55 310 100 31.0
11 475 65 375 100 34.1
b. If 100 identical firms are in the market, what is the industry supply curve?
For 100 firms with identical cost structures, the market supply curve is the horizontal
summation of each firm’s output at each price.
800
60
Q
P
S
Chapter 8: Profit Maximization and Competitive Supply
105
4. Suppose you are the manager of a watchmaking firm operating in a competitive market.
Your cost of production is given by C = 200 +2 q
2
, where q is the level of output and C is
total cost. (The marginal cost of production is 4q. The fixed cost of production is $200.)
a. If the price of watches is $100, how many watches should you produce to maximize
profit?
Profits are maximized where marginal cost is equal to marginal revenue. Here,
marginal revenue is equal to $100; recall that price equals marginal revenue in a
competitive market:
100 = 4
q
, or
q
= 25.
b. What will the profit level be?
Profit is equal to total revenue minus total cost:
π
= (100)(25) - (200 + 2*25
2
) = $1050.
c. At what minimum price will the firm produce a positive output?
A firm will produce in the short run if the revenues it receives are greater than its
variable costs. Remember that the firm’s short-run supply curve is its marginal cost
curve above the minimum of average variable cost. Here, average variable cost is
VC
q
=
2q
2
q
= 2q
. Also, MC is equal to 4q. So, MC is greater than AVC for any
quantity greater than 0. This means that the firm produces in the short run as long as
price is positive.
5. Suppose that a competitive firm’s marginal cost of producing output q is given by
MC(q) = 3 + 2q. Assume that the market price of the firm’s product is $9.
a. What level of output will the firm produce?
To maximize profits, the firm should set marginal revenue equal to marginal cost.
Given the fact that this firm is operating in a competitive market, the market price it
faces is equal to marginal revenue. Thus, the firm should set the market price equal
to marginal cost to maximize its profits:
9 = 3 + 2q, or q = 3.
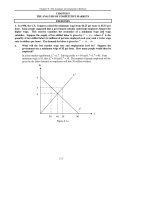
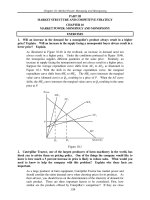
b. What is the firm’s producer surplus?
Producer surplus is equal to the area below the market price, i.e., $9.00, and above
the marginal cost curve, i.e., 3 + 2q. Because MC is linear, producer surplus is a
triangle with a base equal to $6 (9 - 3 = 6). The height of the triangle is 3, where P
= MC. Therefore, producer surplus is
(0.5)(6)(3) = $9.
Chapter 8: Profit Maximization and Competitive Supply
106
Price
Quantity
1
2
3
4
5
6
7
8
9
10
1
2
3
4
MC(q) = 3 + 2q
Producer’s
Surplus
P = $9.00
Producer
Surplus
c.
Suppose that the average variable cost of the firm is given by AVC(q) = 3 + q. Suppose
that the firm’s fixed costs are known to be $3. Will the firm be earning a positive,
negative, or zero profit in the short run?
Profit is equal to total revenue minus total cost. Total cost is equal to total variable
cost plus fixed cost. Total variable cost is equal to (AVC)(q). Therefore, at q = 3,
TVC = (3 + 3)(3) = $18.
Fixed cost is equal to $3. Therefore, total cost equals TVC plus TFC, or
TC = 18 + 3 = $21.
Total revenue is price times quantity:
TR = ($9)(3) = $27.
Profit is total revenue minus total cost:
π = $27 - $21 = $6.
Therefore, the firm is earning positive economic profits. More easily, you might
recall that profit equals producer surplus minus fixed cost. Since we found that
producer surplus was $9 in part b, profit equals 9-3 or $6.
6. A firm produces a product in a competitive industry and has a total cost function
TC = 50 + 4q + 2q
2
and a marginal cost function
MC = 4 + 4q
. At the given market price of
$20, the firm is producing 5 units of output. Is the firm maximizing profit? What quantity
of output should the firm produce in the long run?
If the firm is maximizing profit, then price will be equal to marginal cost. P=MC
results in P=20=4+4q=MC, or q=4. The firm is not maximizing profit, since it is
producing too much output. The current level of profit is
profit = 20*5-(50+4*5+2*5*5) = –20,
and the profit maximizing level is
profit = 20*4-(50+4*4+2*4*4) = –18.
Deleted: Setting price equal to marginal
cost
Deleted: as they are
Deleted: