Tài liệu GSM, cdmaOne and 3G Systems P5 pptx
Bạn đang xem bản rút gọn của tài liệu. Xem và tải ngay bản đầy đủ của tài liệu tại đây (3.29 MB, 119 trang )
Chapter
5
Analysis of IS-95
5.1 List of Mathematical Symbols
a
ij
path loss and shadow fading between the zeroth BS and the
ith MS in the jth microcell
a
0
(
t
)
path loss and shadow fading multiplicative factor
b
i
(
t
)
data sequence for the ith user
b
0
value of b
(
t
)
over the zeroth symbol period
(=
1
)
C
PN
(
t
)
down-link pilot codes
C
W
(
i
+
1
)
(
t
) (
i
+
1
)
th Walsh code
c
ij
spreading code of of ith MS in the jth cell
c
i
(
t
)
code for the ith user
cc
(
n
k
K
)
convolutional code
D
j
distance between the zeroth BS and the adjacent jth cell
site
da area housing an MS
d
f
minimal free distance
(
E
b
=
I
0
)
im
SIR in the presence of power control errors
E
()]
expectation of
()
erfc
()]
complementary error function of
()
e
s
sectorisation efficiency
F a factor used in estimating E
b
=
I
0
f
(
r
)
PDFofanMSbeinginaringofarea2πrdr
f
(
r
j
=
r
σ
)
expectation of 10
ζ
=
10
with the constraint function
φ
(
ζ
r
=
r
j
)
285
GSM, cdmaOne and 3G Systems. Raymond Steele, Chin-Chun Lee and Peter Gould
Copyright © 2001 John Wiley & Sons Ltd
Print ISBN 0-471-49185-3 Electronic ISBN 0-470-84167-2
286
CHAPTER 5. ANALYSIS OF IS-95
G
c
asymptotic coding gain of convolutional code
G
p
processing gain
=
T
b
=
T
c
g controls the rate of increase in the step size by the adptive
power control algorthm
g
(
r
j
=
γ
σ
)
variance of 10
ζ
=
10
with the constraint function φ
(
ζ
r
=
r
j
)
h
j
(
t
τ
j
)
jth component of the impulse response
I total interference power at the output of the matched filter
I
ext
intercellular interference power at the output of the
matched filter
I
0
ext
I
ext
in the presence of power control errors
I
int
intracellular interference power
I
0
int
I
int
in the presence of power control errors
I
j
interference power from all MSs in the jth cell to the zeroth
BS
I
MAI
multiple access interference
I
0
interference PSD
I
(
r
j
r
)
interference power at the zeroth BS from the active MS in
the jth cell
J number of interfering cells
K constraint length of the convolutional code
k number of message bits in the convolutional code
k number of active users within a cell
k
CDMA
capacity as channels per cell per MHz
L number of match filters, or number of resolvable paths by
the RAKE receiver
M number of chips in a spreading code
(=
G
p
)
M
0
spreading factor in the presence of convolutional coding
N number of mobile users
N
0
single-sided PSD of the AWGN
n
I
m
(
t
)
; n
Q
m
(
t
)
inphase and quadrature components of the multipath inter-
ference
n convolutional code length
n
ext
(
t
)
equivalent baseband intercellular interference
n
I
ext
(
t
)
; n
Q
ext
(
t
)
inphase and quadrature componenets of n
ext
(
t
)
n
int
(
t
)
equivalent baseband intracellular interference
n
I
total
(
t
)
; n
Q
total
(
t
)
inphase and quadrature components of the total interfer-
ence noise
N
s
number of sectors per cell
5.1. LIST OF MATHEMATICAL SYMBOLS
287
n
(
t
)
receiver noise
P
i
transmitted power of the ith MS, or from the BS for the ith
MS
P
ij
transmitted power from the ith MS in the jth cell (up-link),
or the transmitted power allocated for the ith channel at the
jth BS (down-link)
P
m
power allocated to each MS by a BS
p
o
outage probability, i.e. probability of the BER
>
10
3
P
p
transmitted pilot power
P
R
received wanted signal power
P
T
transmitted power of an MS in a power control system
P
tar
target received signal power at a BS
p
b
bit error probability
P
p
transmitted power of the pilot signal
Pr
()
probability of
()
Q
()
Gaussian Q-function
R cell radius
R
b
bit rate of the message sequence
R
c
chip rate
R
dn
(
t
)
received signal at an MS
R
I
(
t
)
; R
Q
(
t
)
inphase and quadrature components of R
(
t
)
, the received
baseband signal at the BS
R
0
distance from a BS where ‘near-in’ MSs are present
R
up
(
t
)
received signal at the BS from an MS
r distance of an MS from a BS
S desired received power at a BS
S
0
signal power at the output of the matched filter in the pres-
ence of imperfect power control
S
I
(
t
)
; S
q
(
t
)
inphase and quadrature components of the wanted signal
S
p
received pilot power compoment for the zeroth MS on the
down-link
s
dn
(
t
)
signal transmitted from a BS
s
ij
(
t
)
transmitted signal from the ith MS to the jth BS
s
j
dn
(
t
)
signal transmitted from the jth neighbouring BS
s
0
(
t
)
spread BPSK signal for zeroth MS
T
b
bit duration
T
c
chip duration
288
CHAPTER 5. ANALYSIS OF IS-95
W chip rate and bandwidth of the CDMA signal, also the
width of a street in a street microcell
X distance from a street microcellualr BS to the end of the
microcell
X
b
a break distance in a street microcell where the propagation
path loss exponent changes
x
ij
(
t
)
transmitted baseband signal from the ith MS to the jth BS
Z
ext
(
T
b
)
intercellular interference component of Z
(
T
b
)
Z
int
(
T
b
)
intracellular interference at the output of the matched filter
Z
n
(
T
b
)
receiver noise at the output of the matched filter
Z
(
T
b
)
output of the matched filter at time t
=
T
b
Z
w
(
T
b
)
wanted component of Z
(
T
b
)
β
d
coefficient of the transfer function T
(
D
H
)
of the convolu-
tional code
β
l
magnitude of the lth path of the fast fading channel impulse
response
L
exclusive-OR operation
V
system parameter in the power control algorithm
δ
i
normally distributed received error power random variable
at a BS for MS
i
δ
ij
power control error for the ith MS in the jth cell
δ
(
t
u
)
delta function at time u
η AWGN power at the output of the matched filter
γ
b
E
b
=
I
0
, or energy per bit per interference PSD
γ
c
E
c
=
I
0
, or energy per symbol per interference PSD
γ
req
required
(
E
b
=
I
o
)
for BER
<
10
3
λ
ij
normally distributed random variable with standard devia-
tion σ and zero mean
µ voice activity factor (VAF)
ν
i
voice activity variable of the ith user
ν
ij
voice activity variable of the ith user in the jth cell
ω
2
down-link angular carrier frequency
ω
1
up-link angular carrier frequency
Φ fixed step size used in power control algorithm
φ
ij
carrier phase between the interference signal from the ith
MS in the jth cell and the zeroth MS in the zeroth cell
φ
0
carrier phase difference
ˆ
θ
0
ˆ
θ
φ
(
ζ
r
r
j
)
constraint function
5.2. INTRODUCTION
289
ρ density of MSs in a cell
σ
ε
standard deviation of ε
σ
e
standard deviation of δ
i
τ
i
random delay of the ith user signal at the BS on the up-link,
or the random offset at the BS on the down-link
τ
ij
relative propagation delays of the ith MS in the jth cell
with respect to the zeroth MS in the zeroth cell
τ
p
time offset of the pilot signal at the BS
θ received carrier phase angle at the BS, or the transmitted
phase angle of the carrier at the BS
θ
i
random phase angle of the trnsmitted ith mobile carrier
ˆ
θ
i
change in the phase angle of the ith MS
=
ω
1
(
τ
0
τ
i
)+
θ
i
θ
ij
carrier phase of ith MS in the jth cell
θ
0
overlapping angle of adjacent sectors
4
i
adaptive step size used in the power control algorithm
var
()]
variance of
()
εδ
j
δ
0
random variable having a normal distribution
ξ error in estimating P
R
in the power control
ζλ
ij
λ
0
5.2 Introduction
In CDMA many mobiles use the same RF bandwidth at the same time, and a CDMA re-
ceiver is able to separate the wanted signal from the other mobile signals if it knows the
spreading code used in the generation of the wanted CDMA signal. This demodulation
process occurs in the presence of interference generated by other mobile users. This inter-
ference is a major limitation on the capacity of a CDMA system.
In this chapter the capacity of a CDMA system in tessellated hexagonal cells and city
street microcells is investigated. The system performance in terms of outage probability
for a bit error rate (BER) larger than a minimal required level is analysed. The number
of users that can be supported by a cell for a given outage probability is evaluated. The
corresponding capacity in terms of channels per cell per MHz is calculated according to this
number of users per cell. Our discussion concentrates on the capacity evaluation rather than
on other issues, such as code synchronisation. We begin by examining a single cell CDMA
system before moving on to a multiple cell CDMA system. Since the arrangement of the
up-link, or forward link, is different from the down-link, or reverse link, the performances
of both the up-link and down-link are considered. The effect of sectorisation and channel
coding on CDMA systems is also discussed.
290
CHAPTER 5. ANALYSIS OF IS-95
5.3 CDMA in a Single Macrocell
Consider a single cell CDMA communication system using binary phase shift keying (BPSK)
spread spectrum modulation. As shown in Figure 5.1, the BS uses the angular carrier fre-
quency ω
2
on the down-link to communicate with all its mobiles, while mobiles transmit to
their base stations (BSs) via the angular carrier frequency ω
1
.
5.3.1 The up-link system
The CDMA single cell system consists of N mobile users transmitting to a BS receiver on
the up-link. We consider a simplified mobile transmitter consisting of a BPSK modulator,
formed by multiplying the data sequence for the ith user b
i
(
t
)
, by a carrier cosω
1
t. Spread-
ing occurs when the BPSK signal is multiplied by the code c
i
(
t
)
. This is equivalent to
multiplying the data signal, b
i
(
t
)
,byc
i
(
t
)
and this spread data signal modulates the carrier
cos ω
1
t. Figure 5.2 shows the arrangement.
Let us consider a particular user, say the zeroth one. The spread BPSK signal s
0
(
t
)
is
applied to the radio channel shown in Figure 5.3. We have separated this channel into a part
that allows for path loss and slow fading and is represented by the multiplicative factor a
0
.
The fast fading is represented by a number of impulse responses h
j
(
t
τ
j
)
j
=
0
1
:::
L.
The input of the receiver consists of: interference from the other users in the cell and is
known as intracellular interference; the receiver noise n
(
t
)
; and the received signal for the
zeroth user. The sum of these signals, R
up
(
t
)
, is demodulated by multiplying by a recovered
carrier having the same frequency but different phase, relative to the transmitted carrier.
The resulting signal is applied to a RAKE receiver that may be considered to be composed
of L matched filters, one for each significant path in the impulse response of the channel.
We note that in general the number of matched filters and the number of channels will not
be the same, but it is desirable if there are at least as many matched filters as there are
significant paths in the channel. The RAKE receiver is a maximum ratio diversity system
if it can obtain accurate estimates of the complex impulse responses h
j
(
t
τ
j
)
. The RAKE
receiver is described in Section 2.3.2.6.
A CDMA system has other attributes to combat the effects of fast fading on the signal
s
0
(
t
)
. These include symbol interleaving, forward error correction (FEC) coding, space
diversity reception, power control, and so forth. Using this battery of techniques we can
effectively compensate for the effects of fast fading. The channel model is now reduced to
the multiplicative factor a
0
which accounts for path loss and slow fading. The BS receiver
may now be configured for our analysis as one having despreading followed by a matched
filter, i.e. single stage RAKE, which is an integrator and dump circuit for each mobile. Our
simplified model of the radio channel and the BS receiver is depicted in Figure 5.4.
Each user has a unique spreading code that is known to the BS. The spreading codes are
5.3. CDMA IN A SINGLE MACROCELL
291
ω
1
ω
2
ω
1
ω
1
ω
2
ω
2
BS
ω
1
Figure 5.1: Single cell mobile radio communications in a hexagonal cell.
c
i
(t)
spreader
modulator
spreading code
generator
carrier
generator
i-th user
b
i
(t)
s
i
(t)
cos(
ω
1
t
+
θ
i
)
2P
i
Figure 5.2: A mobile’s CDMA transmitter diagram.
of length M chips, or an M-chip segment from the long psuedo noise (PN) sequence [1,2].
As the mobiles are in different locations within the cell, the transmission delay for each
mobile is different. The signal transmitted from the ith user to its BS is
s
i
(
t
)=
p
2P
i
b
i
(
t
)
c
i
(
t
)
cos
(
ω
1
t
+
θ
i
)
(5.1)
where P
i
is the transmitted power of the ith user, b
i
(
t
)
is the data sequence of the ith user
where each bit has an amplitude of
1 and a duration of T
b
, c
i
(
t
)
is the spreading code
sequence of ith user and each of the M chips per code has a duration T
c
,andθ
i
is the random
phase of the ith mobile carrier and is uniformly distributed in
0
2π
)
. All the mobiles
transmit their signals to the BS receiver over the same radio channel, and the received signal
at the BS receiver is
R
up
(
t
) =
N
1
∑
i
=
0
a
i
s
i
(
t
τ
i
)+
n
(
t
)
=
N
1
∑
i
=
0
a
i
p
2P
i
b
i
(
t
τ
i
)
c
i
(
t
τ
i
)
cos
ω
1
(
t
τ
i
)+
θ
i
]
+
n
(
t
)
(5.2)
292
CHAPTER 5. ANALYSIS OF IS-95
T
b
1
(.)dt
T
b
1
(.)dt
T
b
1
(.)dt
c
0
(t-τ
1
)
c
0
(t-τ
L
)
c
0
(t-τ
0
)
h
0
(t-τ
0
)
fast fading
n(t)
a
0
s
0
(t)
R
up
(t)
h
L
(t-τ
L
)
interference from other users
2cos(ω
1
t+θ)
path loss &
slow fading
carrier
recovery
decision
matched filter
combiner
matched filter
matched filter
RAKE Receiver
cophaser
h
1
(t-τ
1
)
+
Figure 5.3: The up-link representation.
where a
i
represents the path loss and slow fading of the ith user, τ
i
is the random delay
of the ith user signal at the receiver and is uniformly distributed in
0
T
b
)
,andn
(
t
)
is the
additive white Gaussian noise (AWGN) of the receiver noise. The signal at the output of the
zeroth matched filter is given by
Z
(
T
b
) =
1
T
b
Z
T
b
+
τ
0
τ
0
R
up
(
t
)
c
0
(
t
τ
0
)
2cos
(
ω
1
t
+
θ
)
dt
=
(
1
T
b
Z
T
b
+
τ
0
τ
0
N
1
∑
i
=
0
a
i
p
2P
i
b
i
(
t
τ
i
)
c
i
(
t
τ
i
)
cos
ω
1
(
t
τ
i
)+
θ
i
]
c
0
(
t
τ
0
)
2cos
(
ω
1
t
+
θ
)
dt
)
+
1
T
b
Z
T
b
+
τ
0
T
0
n
(
t
)
c
0
(
t
τ
0
)
2cos
(
ω
1
t
+
θ
)
dt
)
(5.3)
where θ is the carrier phase angle in the receiver. Note that due to the propagation delay
5.3. CDMA IN A SINGLE MACROCELL
293
T
b
1
(.)dt
T
b
1
(.)dt
T
b
1
(.)dt
a
N-1
+
n(t)
channel
R
up
(t)
c
i
(t)
c
0
(t)
c
1
(t)
decision
decision
decision
b
N-1
(t)
i
b
i
(t)
b
1
(t)
2cos(ω
1
t+θ)
Base station receiver
decision
b
0
(t)
s
0
(t)
s
1
(t)
s
i
(t)
s
N-1
(t)
a
0
a
1
a
i
c
N-1
(t)
matched filter
matched filter
matched filter
matched filter
+
T
b
1
(.)dt
Figure 5.4: Simplified radio channel and BS receiver block diagram.
294
CHAPTER 5. ANALYSIS OF IS-95
of the radio path associated with the zeroth user, the integration is done from t
=
τ
0
to
t
=
τ
0
+
T
b
. Letting t
=
t
+
τ
0
in Equation (5.3), we have
Z
(
T
b
) =
(
1
T
b
Z
T
b
0
N
1
∑
i
=
0
a
i
p
2P
i
b
i
(
t
+
τ
0
τ
i
)
c
i
(
t
+
τ
0
τ
i
)
cos
(
ω
1
t
+
ˆ
θ
i
)
c
0
(
t
)
2cos
(
ω
1
t
+
ˆ
θ
)
dt
)
+
1
T
b
Z
T
b
0
n
(
t
+
τ
0
)
c
0
(
t
)
2cos
(
ω
1
t
+
ˆ
θ
)
dt
)
(5.4)
where
ˆ
θ
=
ω
1
τ
0
+
θ and
ˆ
θ
i
=
ω
1
(
τ
0
τ
i
)+
θ
i
are the changes in the phase angle of θ
and θ
i
, respectively. We define a relative time delay for the N
1 users with respect to the
zeroth user of τ
i0
=
τ
i
τ
0
, and on substituting into Equation (5.4) we have
Z
(
T
b
) =
(
1
T
b
Z
T
b
0
N
1
∑
i
=
0
a
i
p
2P
i
b
i
(
t
τ
io
)
c
i
(
t
τ
i0
)
cos
(
ω
1
t
+
ˆ
θ
i
)
c
0
(
t
)
2cos
(
ω
1
t
+
ˆ
θ
)
dt
)
+
1
T
b
Z
T
b
0
n
(
t
+
τ
0
)
c
0
(
t
)
2cos
(
ω
1
t
+
ˆ
θ
)
dt
)
:
(5.5)
Owing to the stationary property of the AWGN, n
(
t
+
τ
0
)
in the above equation can be
substituted by n
(
t
)
, and Equation (5.5) can be rewritten as
Z
(
T
b
) =
(
1
T
b
Z
T
b
0
N
1
∑
i
=
0
a
i
p
2P
i
b
i
(
t
τ
i0
)
c
i
(
t
τ
i0
)
cos
(
ω
1
t
+
ˆ
θ
i
)
c
0
(
t
)
2cos
(
ω
1
t
+
ˆ
θ
)
dt
)
+
1
T
b
Z
T
b
0
n
(
t
)
c
0
(
t
)
2cos
(
ω
1
t
+
ˆ
θ
)
dt
:
(5.6)
Assuming the receiver is chip synchronised to the zeroth mobile, then for the zeroth mobile,
c
i
(
t
τ
i0
)
becomes c
0
(
t
)
and from Equation (5.6) c
i
(
t
τ
i0
)
for i
=
0, multiplied by c
0
(
t
)
yields unity, and therefore the wanted component of Z
(
T
b
)
is
Z
w
(
T
b
) =
1
T
b
Z
T
b
0
a
0
p
2P
0
b
0
(
t
)
cos φ
0
+
cos
(
2ω
1
t
+
ˆ
θ
0
+
ˆ
θ
)
dt
5.3. CDMA IN A SINGLE MACROCELL
295
=
a
0
p
2P
0
b
0
cos φ
0
(5.7)
since the average of a cosine wave over many periods is zero, b
0
is the value of b
(
t
)
over a
symbol period having values of
+
1or
1, and φ
0
=
ˆ
θ
0
ˆ
θ. Note that the term Z
w
(
T
b
)
contains the original data sequence b
0
scaled by a
0
p
2P
0
cos φ
0
.
The intracellular interference at the output of the matched filter is
Z
int
(
T
b
) =
N
1
∑
i
=
1
1
T
b
Z
T
b
0
a
i
p
2P
i
b
i
(
t
τ
i0
)
c
i
(
t
τ
i0
)
c
0
(
t
)
cos
(
φ
i
)+
cos
2ω
1
t
+
ˆ
θ
+
ˆ
θ
i
]
dt (5.8)
and since the term involving cos2ω
1
t is averaged to zero,
Z
int
(
T
b
)=
N
1
∑
i
=
1
1
T
b
Z
T
b
0
a
i
p
2P
i
b
i
(
t
τ
i0
)
c
i
(
t
τ
i0
)
c
0
(
t
)
cosφ
i
dt
(5.9)
where
φ
i
=
ˆ
θ
i
ˆ
θ
:
(5.10)
We may express Z
int
(
T
b
)
as
Z
int
(
T
b
)=
1
T
b
Z
T
b
0
n
int
(
t
)
c
0
(
t
)
(5.11)
where
n
int
(
t
)=
N
1
∑
i
=
1
a
i
p
2P
i
b
i
(
t
τ
i0
)
c
i
(
t
τ
i0
)
cos φ
i
(5.12)
is the equivalent baseband intracellular interference. The receiver noise term is, from Equa-
tion (5.6),
Z
n
(
T
b
)=
2
T
b
Z
T
b
0
n
(
t
)
c
0
(
t
)
cos
(
ω
1
t
+
ˆ
θ
)
dt
:
(5.13)
Let us consider the intracellular interference shown in Equation (5.12) that comes from the
other N
1 users. We are cognisant that c
i
(
t
τ
i0
)
are the independent spreading codes
for different users and that the relative time offset of the data transmitted from each mobile
is a random variable, i.e. τ
i0
is an independent random variable that is uniformly distributed
over
0
T
b
)
. We further assume that b
i
(
t
)
represents random independent binary data, and
as a consequence the intracellular interference is a stationary random process. From the
Central Limit Theorem, the summation of N
1 independent random process means that
n
int
can be approximated as a Gaussian random variable [3, 4].
296
CHAPTER 5. ANALYSIS OF IS-95
5.3.1.1 Perfect power control
Since all users are sharing the same radio frequency, a strong signal from mobiles close
to the BS will mask weak signals from distant users. To reduce this so-called near–far
problem, as well as to reduce the interference from other users, it is important to exercise
a power control on the up- link of CDMA transmissions so that the received signal power
levels from all users remain close to a target power, P
tar
. Identically, the received power
from each user at the BS is controlled to be the constant target power, P
tar
, namely
a
2
i
P
i
=
P
tar
for i
=
0
1
:::
N
1
:
(5.14)
With the aid of Equations (5.14), (5.7), (5.9) and (5.13) we may express Equation (5.3) as
Z
(
T
b
)=
p
2P
tar
b
0
cos φ
0
+
Z
int
(
T
b
)+
Z
n
(
T
b
)
(5.15)
where the first term is the desired signal, the second term is the interference from the N
1
users in the cell, and the last term is the AWGN component. The bit error probability at
the output of the bit regeneration circuit depends upon the bit-energy-to-total-interference
power spectral density (PSD) ratio or signal-to-total-interference power ratio (SIR). Accord-
ing to Equation (5.15), the average power of the wanted signal component is
S
=
P
tar
b
2
0
=
P
tar
(5.16)
while the total noise power is the sum of the interference power coming from other users
and the AWGN power of the receiver. The AWGN power at the output of the matched filter
is given as
η
=
var
Z
n
(
T
b
)] =
var
2
T
b
Z
T
b
0
n
(
t
)
c
0
(
t
)
cos
(
ω
1
t
+
ˆ
θ
)
dt
(5.17)
where n
(
t
)
is the AWGN component. Consequently,
η
=
4
T
2
b
E
Z
T
b
0
n
(
t
)
c
0
(
t
)
cos
(
ω
1
t
+
ˆ
θ
)
dt
2
=
4
T
2
b
E
Z
T
b
0
Z
T
b
0
n
(
t
)
n
(
u
)
c
0
(
t
)
c
0
(
u
)
cos
(
ω
1
u
+
ˆ
θ
)
cos
(
ω
1
t
+
ˆ
θ
)
dudt
=
4
T
2
b
Z
T
b
0
Z
T
b
0
E
n
(
t
)
n
(
u
)]
E
c
0
(
t
)
c
0
(
u
)
cos
(
ω
1
u
+
ˆ
θ
)
cos
(
ω
1
t
+
ˆ
θ
)
dt du
:
(5.18)
But for an AWGN having a double-sided PSD of
1
2
N
0
,
E
n
(
t
)
n
(
u
)]=
1
2
N
0
δ
(
t
u
)
(5.19)
5.3. CDMA IN A SINGLE MACROCELL
297
where δ
(
t
u
)
is a delta function at t
=
u.So,
η
=
4
T
2
b
Z
T
b
0
Z
T
b
0
1
2
N
0
δ
(
t
u
)
E
c
0
(
t
)
c
0
(
u
)
cos
(
ω
1
u
+
ˆ
θ
)
cos
(
ω
1
t
+
ˆ
θ
)
dudt
=
2N
0
T
2
b
Z
T
b
0
c
2
0
(
u
)
cos
2
(
ω
1
u
+
ˆ
θ
)
du
=
2N
0
T
2
b
1
2
"
u
+
sin
(
2ω
1
u
+
2
ˆ
θ
)
2ω
1
#
T
b
0
=
2N
0
T
2
b
1
2
T
b
=
N
0
R
b
=
N
0
T
c
T
c
R
b
=
N
0
W
G
p
(5.20)
where R
b
=
1
=
T
b
is the bit rate of the message sequence b
i
(
t
)
, W
=
1
=
T
c
is the chip rate
and we assume it is also the bandwidth of the CDMA signal, and WN
0
is the noise power
at the receiver input. Thus, after despreading, the noise power η is the input noise power
decreased by the processing gain G
p
=
T
b
=
T
c
. The intracellular interference power is
I
int
=
var
1
T
b
Z
T
b
0
n
int
(
t
)
c
0
(
t
)
dt
=
1
T
2
b
E
Z
T
b
0
n
int
(
t
)
c
0
(
t
)
dt
2
(5.21)
since E
n
int
(
t
)
c
0
(
t
)] =
0. Because the n
int
(
t
)
in Equation (5.21) is a Gaussian random vari-
able, its variance can be found as
I
int
=
1
T
2
b
Z
T
b
0
Z
T
b
0
E
n
int
(
t
)
n
int
(
u
)]
E
c
0
(
t
)
c
0
(
u
)]
dudt
:
(5.22)
Since n
int
(
t
)
is Gaussian distributed having a power of E
n
2
int
(
t
)]
and a double-sided band-
width of W , its double-sided PSD is
E
n
int
(
t
)
n
int
(
u
)] =
E
n
2
int
(
t
)
W
δ
(
t
u
):
(5.23)
Substituting the above equation into Equation (5.22):
I
int
=
1
T
2
b
Z
T
b
0
Z
T
b
0
E
n
2
int
(
t
)
W
δ
(
t
u
)
E
c
0
(
t
)
c
0
(
u
)]
dudt
=
1
T
2
b
E
n
2
int
(
t
)
W
Z
T
b
0
du
=
E
n
2
int
(
t
)
G
p
(5.24)
298
CHAPTER 5. ANALYSIS OF IS-95
where the intracellular interference power is
E
n
int
(
t
)]
2
=
E
"
N
1
∑
i
=
1
2a
2
i
P
i
b
2
i
(
t
τ
i0
)
c
2
i
(
t
τ
i0
)
cos
2
φ
i
#
=
N
1
∑
i
=
1
a
2
i
P
i
(5.25)
because the expectation of cos
2
φ
i
is 0
:
5.
By applying voice activity detection (VAD) and thereby discontinuous transmitting (DTX),
the mobiles transmit only when speech signal is present. We introduce a voice activity vari-
able v
i
which is equal to 1 with probability of µ, and to 0 with probability of 1
µ,whereµ
is defined as the voice activity factor (VAF). By multiplying Equation (5.25) by v
i
, and with
the aid of Equations (5.14) and (5.16),
I
int
S
=
1
G
p
N
1
∑
i
=
1
v
i
a
2
i
P
i
S
=
1
G
p
N
1
∑
i
=
1
v
i
(5.26)
where S is the target power P
tar
of Equation (5.16) for this case of perfect power control.
Thus the intracellular interference-to-signal power ratio given by the summation term in
Equation (5.26) is also reduced by a factor of G
p
after the process of matched filtering.
The energy per bit E
b
measured at the output of the matched filter is a random variable
because of the variations in the path loss, slow fading and fast fading of the mobile chan-
nel. The interference PSD I
0
measured at the output of the matched filter is also a random
variable because it depends on the interference being generated by mobiles roaming within
the cell. We therefore need to take the expectation of the ratio of E
b
to I
0
, namely E
b
=
I
0
,in
determining the probability of symbol error. Now E
b
=
ST
b
and I
0
=
I
=
R
b
=
IT
b
,where
I is the total interference power at the output of the matched filter. Consequently,
E
b
I
0
=
S
I
=
SIR
:
(5.27)
Now the I is the sum of I
int
and η, enabling us to express
E
b
I
0
=
1
I
int
S
+
η
S
:
(5.28)
In Equation (5.26), the summation of v
i
over
(
N
1
)
users may be expressed, upon taking
its expectation, as
E
"
N
1
∑
i
=
1
v
i
#
=
µ
(
N
1
)
(5.29)
so that
E
b
I
0
=
1
µ
(
N
1
)
G
p
+
η
S
(5.30)
5.3. CDMA IN A SINGLE MACROCELL
299
From Equation (5.30), the bit error rate (BER) for the BPSK can be expressed as
p
b
=
1
2
erfc
r
E
b
I
0
(5.31)
where erfc
(
σ
)
is the complementary error function [5]. For a required BER, a required
E
b
=
I
0
, namely
(
E
b
=
I
0
)
req
can be determined from Equation (5.31). Given
(
E
b
=
I
0
)
req
,the
maximum number of active users, other than the zeroth user, that can be supported by the
system is
m
=
N
1
∑
i
=
1
ν
i
=
6
6
6
6
4
G
p
E
b
I
0
req
G
p
S
η
7
7
7
7
5
(5.32)
where
b
x
c
represents the largest integer that is smaller than x. Provided the number of active
users does not exceed m, the required BER is secured. However, when the number of active
users is larger than m, the BER will be greater than the required BER, and this situation is
referred to as system outage. The outage probability of the single cell system is defined as
p
o
=
Pr
(
BER
>
BER
req
)=
Pr
E
b
I
0
<
E
b
I
0
req
!
:
(5.33)
Since users in a cell are not active all the time, the number of active users is less than the
number of potential users. Consequently, a cell can support more than m users, but the
system will experience outage at those instances when the number of active users exceeds
m. The outage probability is then the probability of the number of active users being greater
than m,i.e.
p
o
=
Pr
N
1
∑
i
=
1
ν
i
>
m
!
(5.34)
and because ν
i
is a random variable having a binomial distribution, the outage probability
is
p
o
=
Pr
N
1
∑
i
=
1
ν
i
>
m
!
=
N
1
∑
i
=
1
N
1
i
!
µ
i
(
1
µ
)
N
1
i
:
(5.35)
5.3.1.2 Imperfect power control
In practice, the received signal power P
R
from the ith mobile at its BS will differ from the
target power level P
tar
by δ
i
dB. This error power δ
i
is a random variable that is normally
distributed with a standard deviation σ
e
and is discussed in detail in Section 5.6 and in Ref-
erences [6]– [8]. There are several reasons for δ
i
being non-zero, such as the inaccuracies in
measuring the received power, S, at a BS, and the inability to adjust the mobile transmitted
300
CHAPTER 5. ANALYSIS OF IS-95
power sufficiently fast to force δ
i
to zero. The relationship between P
R
and P
tar
for the ith
mobile may be expressed as
P
R
=
a
2
i
P
i
10
δ
i
10
=
P
tar
10
δ
i
10
:
(5.36)
According to Equation (5.36), the signal power at the output of the matched filter for the
wanted zeroth mobile is
S
0
=
P
tar
10
δ
0
10
(5.37)
and the intracellular interference is
I
int
=
1
G
p
N
1
∑
i
=
1
v
i
P
tar
10
δ
i
10
:
(5.38)
Consequently, the intracellular interference-to-signal ratio at the output of the matched filter
becomes
I
0
int
S
0
=
1
G
p
N
1
∑
i
=
1
v
i
10
δ
i
δ
0
10
(5.39)
where δ
0
and δ
i
are two mutually independent random variables of power control errors for
the signal and the intracellular interferers, respectively. By setting ε
=
δ
i
δ
0
, we have from
Equations (5.39),
I
0
int
S
0
=
1
G
p
N
1
∑
i
=
1
v
i
10
ε
10
=
I
int
S
10
ε
10
(5.40)
where ε is a random variable with zero mean and a normal distribution having a standard
deviation of σ
ε
=
p
2σ
e
. Following the same procedure as in the perfect power control case,
the signal-to-interference power ratio can be written as
E
b
I
0
im
=
1
I
0
int
S
0
+
η
S
0
=
1
I
int
S
10
ε
10
+
η
S
0
:
(5.41)
Owing to imperfect power control, there is an error, ε,in
(
E
b
=
I
0
)
im
. Because ε is a normally
distributed random variable, the BER varies accordingly. In order to evaluate the system
performance, we introduce the outage probability that is defined as the probability of a
system’s BER being greater than 10
3
,i.e.
p
o
=
Pr
(
BER
>
10
3
)
=
Pr
E
b
I
0
im
=
S
0
I
0
int
+
η
<
γ
req
5.3. CDMA IN A SINGLE MACROCELL
301
=
Pr
I
0
int
+
η
S
0
>
1
γ
req
=
Pr
1
G
p
10
ε
10
N
1
∑
i
=
0
v
i
>
1
γ
req
η
S
0
!
=
Pr
(
10
ε
10
N
1
∑
i
=
0
v
i
>
G
p
1
γ
req
η
S
0
)
(5.42)
where γ
req
is the required E
b
=
I
0
to ensure that the BER is less than 10
3
. If the number of
active users inside the cell is k,i.e.
∑
N
1
i
=
0
v
i
=
k, then Equation (5.42) can be rewritten as
p
o
=
Pr
(
k10
ε
10
>
G
p
1
γ
req
η
S
0
N
1
∑
i
=
0
v
i
=
k
!)
Pr
N
1
∑
i
=
0
v
i
=
k
!
=
p
1
p
2
:
(5.43)
The outage probability p
o
is the product of two probabilities, p
1
and p
2
. We will first
consider the probability that there are k active intracellular users,
p
2
=
Pr
N
1
∑
i
=
0
v
i
=
k
!
:
(5.44)
The variable v
i
is either 1 or 0 depending on whether the ith mobile user is active or not.
The probability that a user is active is µ, and is called the voice activity factor (VAF). It will
be recalled that for the case of tossing a coin the probability of k heads in
(
N
1
)
tossings
is
N
1
k
p
k
(
1
p
)
N
1
k
(5.45)
where p here is the probability of a head being tossed. In our case we replace p by the VAF,
µ, and observe that k can range from 0 to N
1. Hence,
p
2
=
N
1
∑
k
=
0
N
1
k
µ
k
(
1
µ
)
N
1
k
(5.46)
where
N
1
k
=
(
N
1
)(
N
2
) :::(
N
k
)
k!
:
(5.47)
Turning our attention to probability p
1
in Equation (5.43), we note that as ε is a Gaussian
random variable,
p
1
=
Q
2
6
6
4
G
p
1
γ
req
η
S
0
kE
h
10
ε
10
i
r
k var
h
10
ε
10
i
3
7
7
5
(5.48)
302
CHAPTER 5. ANALYSIS OF IS-95
where
Q
(
θ
)
1
p
2π
Z
∞
θ
e
λ
2
2
dλ (5.49)
is the Q-function. This follows for a Gaussian random variable X with mean µ and variance
σ
2
:
Pr
X
>
x
]=
Q
x
µ
σ
:
(5.50)
Because ε is a random variable with normal distribution, the mean of the term 10
ε
10
in
Equation (5.48) can be derived by following the same procedure as used in Section 3.3, i.e.
E
h
10
ε
10
i
=
Z
∞
∞
exp
εln
(
10
)
10
exp
ε
2
4σ
2
e
p
4πσ
2
e
dε
=
exp
σ
e
ln
(
10
)
10
2
Z
∞
∞
exp
1
2
h
ε
p
2σ
e
ln
(
10
)
p
2σ
e
10
i
2
p
4πσ
2
e
dε
=
exp
σ
e
ln
(
10
)
10
2
f
1
Q
∞
]g =
exp
σ
e
ln
(
10
)
10
2
(5.51)
where σ
e
is the standard deviation of the power control error. The variance of the 10
ε
10
is
var
h
10
ε
10
i
=
E
h
10
ε
10
E
h
10
ε
10
ii
2
=
E
h
10
ε
10
i
2
n
E
h
10
ε
10
io
2
:
(5.52)
From Equation (5.51) we have
var
h
10
ε
10
i
=
E
h
10
ε
5
i
"
exp
σ
e
ln
(
10
)
10
2
#
2
(5.53)
where
E
h
10
ε
5
i
=
Z
∞
∞
exp
εln
(
10
)
5
exp
ε
2
4σ
2
e
p
4πσ
2
e
dε
=
exp
σ
e
ln
(
10
)
5
2
8
>
>
<
>
>
:
Z
∞
∞
exp
1
2
h
ε
p
2σ
e
p
2σ
e
ln
(
10
)
5
i
2
p
4πσ
2
e
dε
9
>
>
=
>
>
=
exp
σ
e
ln
(
10
)
5
2
f
1
Q
∞
]g =
exp
σ
e
ln
(
10
)
5
2
:
(5.54)
5.3. CDMA IN A SINGLE MACROCELL
303
From Equations (5.53) and (5.54), the variance of the 10
ε
10
becomes
var
h
10
ε
10
i
=
exp
σ
e
ln
(
10
)
5
2
"
exp
σ
e
ln
(
10
)
10
2
#
2
:
(5.55)
The outage probability may now be expressed as
p
o
=
N
1
∑
k
=
0
N
1
k
µ
k
(
1
µ
)
N
1
k
Q
2
4
G
p
1
γ
req
η
S
0
kE
10
ε
=
10
q
kvar
10
ε
=
10
3
5
9
=
:
(5.56)
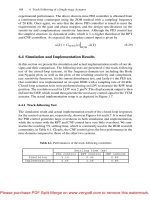
5.3.1.3 Performance of the up-link
The performance of the up-link in a single cell CDMA system having a processing gain
of 128 was evaluated over a channel having an inverse fourth power path loss law and
slow fading whose standard deviation was 8 dB. A signal-to-AWGN ratio of 20 dB at the
output of the matched filter was assumed and a BER outage threshold of 10
3
was used in
the calculations. Figure 5.5 shows the outage probability from Equation (5.35) for perfect
power control and VAFs of 3/8 and 1/2. For an outage probability of 2%, the single cell
CDMA system can support 48 users and 38 users for a VAF of 3/8 and 1/2, respectively.
The outage probability of the imperfect power controlled system having different standard
deviations of power control error in E
b
=
I
0
is show in Figures 5.6 and 5.7 for a VAF of 3/8
and 1/2, respectively. We observe that a standard deviation of the measured E
b
=
I
0
was found
to be 1.7 dB in a particular set of measurements [7]. For an outage probability of 2% and a
standard deviation of power control errors in E
b
=
I
0
of 2 dB, the single cell CDMA system
can support 37 users and 28 users per cell for a VAF of 3/8 and 1/2, respectively. The
capacity degradation due to imperfect power control is about 46%. This highlights the need
for an accurate power control technique for the up-link in this type of CDMA system.
5.3.2 The down-link system
The CDMA down-link, namely the forward link, has a coherent BPSK communication sys-
tem where the coherent demodulation is facilitated by a pilot signal. As shown in the system
arrangement of Figure 5.8, the BS transmitter adds the CDMA signals from the N
1traffic
channels with a CDMA pilot, then transmits this combined signal to all the mobile users in
its cell. A mobile can recover the portion of the signal intended for itself by coherently
demodulating and despreading the signal with its own code. The signal transmitted from
304
CHAPTER 5. ANALYSIS OF IS-95
Figure 5.5: Outage probability of a single cell CDMA system in the presence of a perfectly power
controlled up-link, with VAFs of 3/8 and 1/2.
Figure 5.6: Outage probability of the single cell CDMA system in the presence of imperfect power
controlled up-link, a VAF of 3/8, and different values of the standard deviation of power
control errors in E
b
=
I
0
.
5.3. CDMA IN A SINGLE MACROCELL
305
Figure 5.7: Outage probability of the single cell CDMA system in the presence of imperfect power
controlled up-link, a VAF of 1/2, and different values of the standard deviation of power
control errors in E
b
=
I
0
.
the BS is given by
s
dn
(
t
) =
N
1
∑
i
=
0
p
2P
i
b
i
(
t
τ
i
)
c
i
(
t
τ
i
)
cos
(
ω
2
t
+
θ
)
+
p
2P
p
c
p
(
t
τ
p
)
cos
(
ω
2
t
+
θ
)
(5.57)
where P
i
and P
p
are the transmitted power allocated for the ith mobile and the pilot signal,
respectively, τ
i
is the random time offset of the ith user, ω
2
is the down-link carrier fre-
quency, c
p
(
t
)
is the pilot code sequence, τ
p
is the time offset of the pilot signal and θ is an
arbitrary phase angle. Let us assume that the pilot signal is transmitted on the Nth channel,
then Equation (5.57) can be simplified to
s
dn
(
t
)=
N
∑
i
=
0
p
2P
i
b
i
(
t
τ
i
)
c
i
(
t
τ
i
)
cos
(
ω
2
t
+
θ
)
(5.58)
where
P
p
=
P
N
c
p
(
t
) =
c
N
(
t
)
τ
p
=
τ
N
and
b
N
(
t
τ
N
)=
1
:
306
CHAPTER 5. ANALYSIS OF IS-95
During the down-link transmission there is no relative time delay between each user’s
CDMA signal. For convenience we will set the signal delay on the down-link to zero.
While the signal is transmitted by the zeroth BS to its service area, the signal received by
one of its users, say, the zeroth mobile, has the form
R
dn
(
t
) =
a
0
s
dn
(
t
)+
n
(
t
)
=
a
0
p
2P
0
b
0
(
t
τ
0
)
c
0
(
t
τ
0
)
cos
(
ω
2
t
+
θ
)
+
N
∑
i
=
1
a
0
p
2P
i
b
i
(
t
τ
i
)
c
i
(
t
τ
i
)
cos
(
ω
2
t
+
θ
)+
n
(
t
)
(5.59)
where the first term is the signal for zeroth mobile, the second term is the intracellular inter-
ference, and the last term is the AWGN component. Assuming that the receiver is correctly
chip synchronised to the zeroth user, we can set τ
0
to zero without loss of generality. Af-
ter demodulating and despreading, the signal at the output of the matched filter is, after
following a similar procedure to that in Section 5.3.1,
Z
(
T
b
) =
a
0
p
2P
0
b
0
+
1
T
b
Z
T
b
0
n
int
(
t
)
c
0
(
t
)
dt
+
1
T
b
Z
T
b
0
n
(
t
)
c
0
(
t
)
2cos
(
ω
2
t
+
θ
)
dt
(5.60)
where
n
int
(
t
)=
a
0
N
∑
i
=
1
p
2P
i
b
i
(
t
τ
i
)
c
i
(
t
τ
i
)
(5.61)
is the equivalent baseband intracellular interference. The first term in Equation (5.60) is the
desired signal, the second term is the intracellular interference, while the last term is the
AWGN component.
The performance of the down-link can be obtained by following the same procedure as
used in the up-link. From Equation (5.60), the received signal power component for the
zeroth mobile receiver is
S
=
2a
2
0
P
0
(5.62)
and the power in the received pilot is
S
p
=
2a
2
0
P
p
:
(5.63)
If discontinuous transmission is applied to all the traffic channels, then the interference
is the summation of 2a
2
0
P
i
v
i
for i ranging from 0 to N
1. The pilot channel is usually
transmitted at a higher power level than a traffic channel and also at a constant power level.
The intracellular interference is therefore
5.3. CDMA IN A SINGLE MACROCELL
307
T
b
1
(.)dt
cos(
ω
2
t
+
θ)
cos(
ω
2
t
+
θ)
cos(
ω
2
t
+
θ)
c
0
(
t
)
b
0
(t
)
cos(
ω
2
t
+
θ)
c
1
(
t
)
2cos(
ω
2
t
+
θ)
2
P
0
b
1
(t
)
pilot
generator
s
dn
(
t
)
c
N
-1
(
t
)
2
P
N
-1
b
N
-1
(
t
)
Base station transmitter
2
P
p
a
0
channel
2P
1
c
i
(
t
)
2
P
i
b
i
(
t
)
R
dn
(
t
)
mobile’s receiver
c
0
(
t
)
decision
b
0
(
t)
n
(
t
)
matched filter
c
p
(
t
)cos(
ω
2
t
+
θ
)
Figure 5.8: Block diagram of the single cell down-link system.
308
CHAPTER 5. ANALYSIS OF IS-95
I
int
=
2a
2
0
∑
N
1
i
=
1
v
i
P
i
G
p
+
2a
2
0
P
p
G
p
(5.64)
and
I
int
S
=
1
G
p
"
N
1
∑
i
=
1
v
i
P
i
P
0
+
P
p
P
0
#
:
(5.65)
The AWGN power, η, is exactly the same as in Equation (5.20). Hence,
E
b
I
0
=
1
I
int
S
+
η
S
:
(5.66)
If each traffic channel and the pilot signal have the same power, i.e. P
i
=
P
p
for all i, we ob-
tain the average bit-energy-to-interference PSD ratio, or the average signal-to-interference
power ratio, as
E
b
I
0
=
1
1
G
p
∑
N
i
=
1
ν
i
P
i
P
0
+
η
S
=
1
1
G
p
∑
N
i
=
1
ν
i
+
η
S
:
(5.67)
Adopting a similar approach to the one used for the up-lnk, the outage probability of the
single cell down-link system is
p
o
=
Pr
N
∑
i
=
1
ν
i
>
m
!
=
N
∑
i
=
1
N
i
!
µ
i
(
1
µ
)
N
i
(5.68)
where the maximum number of active users for the down-link is
m
=
N
∑
i
=
1
ν
i
=
6
6
6
6
4
G
p
E
b
I
0
req
G
p
S
η
7
7
7
7
5
:
(5.69)
The performance of the down-link in a single cell CDMA system in terms of the BER is
calculated using Equation (5.35). For an inverse fourth power loss law, a slow fading whose
standard deviation is 8 dB, a signal-to-AWGN ratio of 20 dB, and a processing gain of 128,
the outage probability as a function of the number of users per cell for two different values
of VAF is displayed in Figure 5.9. For an outage probability of less than 2%, the single cell
system can support 47 and 37 users for VAFs of 3/8 and 1/2, respectively.
5.4CDMA Macrocellular Networks
In the previous section we addressed the performance of the single cell CDMA system. We
now consider the performance of the multiple cellular arrangement shown in Figure 5.10. In
addition to the intracellular interference, there is now interference from neighbouring cells.
This interference is referred to as intercellular interference. The effects of intercellular
5.4. CDMA MACROCELLULAR NETWORKS
309
Figure 5.9: Outage probability of a single cell down-link system.
interference must be determined for both the up-link and the down-link communication
systems.
5.4.1 The up-link system
The received signal at a BS includes the desired signal, intracellular interference, the AWGN
at the receiver input, and intercellular interference. Figure 5.11 shows the up-link communi-
cation system where the arrangement for the mobile transmitter and BS receiver are exactly
the same as those shown in Figures 5.2 and 5.4, respectively. The signal received at the
zeroth BS is given by
R
up
(
t
) =
N
1
∑
i
=
0
a
i
s
i
(
t
τ
i
)+
J
1
∑
j
=
1
N
1
∑
i
=
0
a
ij
s
ij
(
t
τ
ij
)+
n
(
t
)
=
N
1
∑
i
=
0
a
i
p
2P
i
b
i
(
t
τ
i
)
c
i
(
t
τ
i
)
cos
ω
1
(
t
τ
i
)+
θ
i
]+
n
(
t
)
+
J
1
∑
j
=
1
N
1
∑
i
=
0
a
ij
p
2P
ij
b
ij
(
t
τ
ij
)
c
ij
(
t
τ
ij
)
cos
ω
1
(
t
τ
ij
)+
θ
ij
]
(5.70)
where the intercellular interference from the J
1 surrounding cells is
J
1
∑
j
=
1
N
1
∑
i
=
0
a
ij
s
ij
(
t
τ
ij
)
(5.71)