Tài liệu HPLC for Pharmaceutical Scientists 2007 (Part 7B) pptx
Bạn đang xem bản rút gọn của tài liệu. Xem và tải ngay bản đầy đủ của tài liệu tại đây (470.31 KB, 37 trang )
310APPLICATIONS TO SMALL MOLECULES
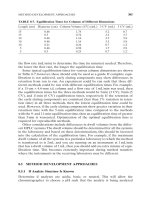
TABLE 7-5. Isotopic Abundances for Ions Containing Different Numbers of Sulfur, Chlorine, and Bromine Atoms
Number Number Number Number Number Number Number
Number of Br of Br of Br of Br of Br of Sulfur of Sulfur
of Cl Atoms Atoms Atoms Atoms Atoms Atoms Atoms
Atoms Mass (0) (1) (2) (3) (4) (1) (2)
0 A 100 51.5 34.3 17.6
A+2 97.3 100 100 68.5
A+4 48.7 97.3 100
A+6 31.6 64.9
A+8 15.8
1 A 100 77.3 44.2 26.5 14.4
A+2 32 100 100 85.8 60.8
A+4 24.1 69.3 100 100
A+6 13.4 48.5 79.4
A+8 7.8 30
A+10 4.1
2 A 100 62 38.7 20.8 12.1
A+2 64 100 100 74 54.8
A+4 10.2 45 88.8 100 100
A+6 6.2 31.2 63.1 93.3
A+8 3.8 18.3 46.4
A+10 2 11.5
A+12 1.1
A 100 100
A+1 0.8 1.6
A+2 4.4 8.8
A+3 0.07
A+4 0.19
molecular ions at m/z 521 ([M + H
+
]), 523, and 525, of relative abundances
100 : 70 : 14. The isotopic intensity pattern is in good agreement with that of
two chlorine atoms (Table 7-5), due to the ions C
27
H
31
O
6
35
Cl
2
,C
27
H
31
O
6
35
Cl
37
Cl,
and C
27
H
31
O
6
37
Cl
2
. The characteristic isotopic patterns resulting from combi-
nations of the isotope peaks can be used to ascertain elemental composition
of the corresponding ion.
7.6.1.3 Nitrogen Rule. If the nominal molecular weight of an analyte
appears to be an even mass number, the compound contains an even number
of nitrogen atoms (or no nitrogen atoms). On the other hand, if the nominal
molecular weight of an analyte appears to be an odd mass number, the com-
pound contains an odd number of nitrogen atoms. This so-called “Nitrogen
Rule” is very useful for determining the nitrogen content of an unknown com-
pound. In the case of Verapamil (Scheme 1), the molecular weight of the com-
pound is 420 Da, indicating an even number of nitrogen atoms in the molecule.
7.6.1.4 Hydrogen/Deuterium (H/D) Exchange. The exchange of hydrogen
for deuterium in organic molecules has been used in mass spectrometry for
structural studies in both solution phase and gas phase. It also has wide appli-
cations in the structural studies of proteins [24].This method measures the dif-
ference in molecular weight of a compound before and after the deuterium
exchange to determine the exchangeable hydrogens in a molecule for struc-
tural elucidations. For example, one can determine the number of labile hydro-
gen atoms from the mass shift X of [M + H
+
] in H
2
O to [M + D
+
] in D
2
O as X
− 1. The exchangeable hydrogens are usually bound to N, O, or S atoms in func-
tional groups such as OH, NH, NH
2
, or COOH. In the case of mometasone
furoate (structure shown in Figure 7-1), there is only one exchangeable hydro-
gen atom from the OH group in the molecule.
There are two general approaches to set up H/D exchange LC/MS experi-
ments. One is to use deuterium oxide as sheath liquid to introduce it to the
ESI/APCI source as a post-column addition. The actual exchange takes place
in the ion source. This method can enable some degree of H/D exchange
without change of chromatographic separation (i.e., retention time). However,
back-exchange can occur and contribute to incomplete exchange due to the
presence of H
2
O in solvents or inadequate amounts of D
2
O. The other
approach is to couple ESI/APCI-MS with deuterated mobile phases such as
D
2
O or CH
3
OD (less commonly used) for on-line LC/MS analysis of mixtures.
The change of chromatographic retention time due to the use of deuterated
mobile phases should not be an issue because of the use of mass identifica-
tions. This approach provides accurate measurements of exchangeable hydro-
gens in a molecule to assist structural elucidation (examples will be presented
in later section on identification of drug metabolites).
7.6.1.5 Accurate Mass Measurement. Mass accuracy measurement,typically
reported as parts per million (ppm), is essential for elemental-composition
MS INTERPRETATION 311
assignment. Traditional accurate mass measurements are carried out in a mag-
netic sector mass spectrometer, requiring relatively large quantities of materi-
als.The development of modern MS instrumentation (i.e., QTOF, FT-ICR, etc.)
has allowed accurate mass determinations of small molecules as well as bio-
molecules that are present at very low levels.
An internal mass calibration is generally needed to achieve mass measure-
ment accuracy of 5 to 10ppm with a Q-TOF MS analysis [62–64]. Internal cal-
ibration is based on mixing one or several internal standards or calibrants of
known molecular weight with the analyte and then using the known masses
to calibrate the mass measurements of unknowns that coexist in the sample
mixture.
Currently, FT-ICR MS provides the highest mass resolving power and mass
accuracy among all the mass spectrometric methods. Using external calibra-
tion, FT-ICR MS is capable of achieving mass measurement accuracies of 1
ppm or better. Internal calibration can provide an order-of-magnitude greater
mass accuracy than external calibration for the FT-MS analysis.
One example is the high-resolution ESI-FT-ICR MS analysis of a
mixture of Verapamil and peptide A. The following MS data were obtained
for the mono-isotopic molecular ion and the isotopic molecular ions of
peptide A using an external calibration (calculated mass; mass error in
ppm): (829.5393, 0.1 ppm), (830.5423, 1.3 ppm), (831.5450, 1.0 ppm), and
(832.5476, 1.2 ppm). Similar results were obtained for the Verapamil (data not
shown).
Accurate mass measurement is important in establishing compound iden-
tity. For example, an unknown with a mass of m/z 122.0606 ([M + H
+
]) can be
C
7
H
8
NO; it cannot be C
5
H
13
NCl (m/z 122.0731), C
3
H
8
NO
4
(m/z 122.0447),
C
4
H
12
NO
3
(m/z 122.0811), C
4
H
9
NOCl (m/z 122.0367), or C
8
H
12
N (m/z
122.0964).A mass measurement accuracy of 102ppm is required to distinguish
these elemental compositions. Thus, an unequivocal elemental composition of
a compound can be obtained with sufficient high mass measurement accuracy
(i.e., <5 ppm) along with other information.
7.6.1.6 Double Bond Equivalency (DBE). To evaluate whether a formula,
C
x
H
y
N
z
O
n
, is a reasonable elemental composition for a certain mass, one can
calculate the DBE (numbers of rings and double bonds) of the formula. The
calculation is based on the valences of elements involved, as shown in equa-
tion (7-1). For example, pyridine (C
5
H
5
N) has a calculated DBE of 4 (= 5 −
5/2 + 1/2 + 1), indicating the ring and three double bonds in this molecule. For
benzene (C
6
H
6
), its calculated DBE is 4 (= 6 − 6/2 + 1), suggesting the ring and
three double bonds in the molecule as well.
A more general case, I
y
II
n
III
z
IV
x
, was suggested by McLafferty [65], where
I = H, F, Cl, Br, I; II = O, S; III = N, P; and IV = C, Si.
(7-1)
DBE + Rd
b xy z
()
=− + +221
312 APPLICATIONS TO SMALL MOLECULES
The calculated value 12 found for mometasone furoate (C
27
H
30
O
6
Cl
2
) repre-
sents five rings and seven double bonds of this molecule [equation (7-2)]. Note
that although an oxygen atom is present in the formula of mometasone
furoate, it does not contribute to the calculation of DBE. The intensity of the
molecular ion usually parallels the chemical stability of the molecule, and com-
pounds with high numbers of rings and double bonds (DBE) often show
higher molecular-ion abundance than those with low DBE. This is consistent
with the abundant molecular ion peak observed in the CI-MS spectrum of
mometasone furoate (Figure 7-2).
(7-2)
7.6.2 Fragmentation Pattern
Fragmentation pattern of a molecule, after ionization in the mass spectrome-
ter, can be used to obtain structural information.The fragment ions from singly
charged parent ions are the ions observed at low-mass range of a MS/MS spec-
trum. The fragmentation chemistry and mechanisms are reasonably under-
stood. The prominent abundant fragment ions are the most stable fragments
that tend to be formed. The fragmentation processes also depend on the sta-
bility of the transition states by which the ions are produced.
Many of the fragment ions observed in the product-ion spectra are formed
by collision-induced heterolytic cleavage. For example, the formation of a
product ion, [M + H
+
− HX], can be explained by a 1,4 hydrogen rearrange-
ment mechanism (Scheme 3). The product ion is formed by the neutral loss of
HX, where X can be a heteroatom or a more electronegative group. A less
common fragmentation mechanism by homolytic cleavage is also observed in
tandem MS experiments. In this case, the driving force for the fragmentation
of an ion is dependent on the stabilities of the resulting ion and the radical
species relative to the energy of the initial ionic species. For instance, the for-
mation of stable product ions, including acylium ion, benzylic ion, and allylic
carbonium ion, are able to promote homolytic cleavage.
DBE + Rdb
()
=− +=27 32 2 1 12
MS INTERPRETATION 313
Scheme 3.
Charge-remote fragmentation is defined as a class of gas-phase decompo-
sitions that occur physically remote from the charge site [66–70]. Although the
mechanism of charge-remote fragmentation is still debatable (Scheme 4) [67],
It is possible to derive structural information from the fragmentation
pattern in a spectrum. The appearance of prominent peaks at certain mass
numbers is empirically correlated with certain structural features. For example,
the mass spectrum of an aromatic compound is usually dominated by a peak
at m/z 91, corresponding to the tropylium ion. Structural information can also
be obtained from the differences between the masses of two peaks in a spec-
trum. For instance, a fragment ion occurring 20 mass numbers below the mol-
ecular ion strongly suggests a loss of a HF moiety. Thus, a fluorine atom is
likely to be present in the substance analyzed.
In addition, the knowledge of the principles governing the mode of frag-
mentation of ions makes it possible to confirm the structure assigned to a com-
pound. This information is often used to determine the juxtaposition of
structural fragments and thus to distinguish between isomeric substances. Rea-
sonable guesses can be made as to which fragment ions to be expected in a
mass spectrum if the isomeric substances are known.
The molecular ions formed in ESI/APCI and their fragment ions are usually
even electron ions, that is, [M + H
+
]. In some cases, radical cations M
+•
can be
formed in ESI-MS [24], depending on their structures and ESI conditions. In
the case of Florfenicol (SCH 25298, Scheme 5, I), an antibacterial agent in
Animal Health, its product ion mass spectrum only displays a very low abun-
dant molecular ion peak at m/z 358 (data not shown). An abundant peak cor-
responding to the loss of water is formed by heterolytic fragmentation as
illustrated in Scheme 5 (II, m/z 340). The II likely decomposes to III (m/z 320)
by a neutral loss of HF, and this fragmentation is promoted by the formation
of a substituted tropylium ion (Scheme 5). The fragmentation pattern of Flor-
fenicol is characterized by an unusual feature of a most abundant peak occur-
ring at odd mass, that is, m/z 241. The IV, a radical cation, is likely formed by
homolytic cleavage of the sulfur–carbon bond in III, with loss of the methane-
sulfinic radical (Scheme 5).
314 APPLICATIONS TO SMALL MOLECULES
Scheme 4.
it has been proven useful in the structural determination of long-chain or poly-
ring molecules, including fatty acids, phospholipids, glycolipids, triacylglycerols,
steroids, peptides, ceramides, and so on.
7.7 PRACTICAL APPLICATIONS
Mass spectrometry is a powerful and effective technology in drug discovery
and development. This section will concentrate on the practical applications
of LC/MS in problem solving, including high-throughput LC/MS analysis for
combinatorial chemistry, structural characterization of impurities and decom-
position products in bulk drug substances, and identification and quantifica-
tion of drug metabolites.
7.7.1 High-Throughput LC/MS for Combinatorial Chemistry
The application of combinatorial chemistry to the synthesis of potential ther-
apeutic agents has received increasing attention such that combinatorial chem-
istry is now an important tool in modern drug discovery [71]. Automated
approaches capable of screening large libraries of small molecules have
resulted in the successful application of LC/MS in combinatorial chemistry.
Current trends for further integration of LC/MS techniques with new
instrumental development have generated structure-based assays for drug
discovery.
To assess the quality of a combinatorial chemistry library, it is essential to
determine the purity and quantity of the expected products. Commercial soft-
ware, developed by instrument manufacturers, has made possible the unat-
tended and rapid analysis of tens of thousands of individual components of a
specific library. The application of LC/MS in high-throughput screening of
combinatorial libraries has been reviewed by several authors [72–78].
An important application of LC/MS in relation to combinatorial synthesis
is the introduction of open-access LC/MS instrumentation. The dedicated
PRACTICAL APPLICATIONS 315
Scheme 5.
open-access software packages are available from most instrument manufac-
turers. Using an open-access LC/MS system, organic chemists can readily
obtain the molecular weight information of reaction products and monitor the
progress of chemical synthesis. The chemist just needs to log-in to the com-
puter system, assign an identification code to the sample, and select the type
of LC/MS experiments to be performed. The automatic sample analyses can
be performed rapidly using short HPLC columns and fast gradients, with run
times typically of 5 min or less.
Multichannel ESI inlets have been developed to enhance sample through-
put for large combinatorial library analysis. A multiplexed electrospray inter-
face (MUX), which enables four- and eight-channel parallel introduction from
four or eight LC systems into a multiplexed ESI source, was introduced in
1999. These systems, when coupled with TOF-MS, can provide not only the
high-throughput capacity needed for library analysis, but also accurate mass
determination of drug candidates and their synthetic by-products. Fang et al.
[79] reported that they had coupled a nine-channel MUX-TOF MS system to
conduct eight parallel high-throughput accurate mass LC/UV/TOF MS analy-
sis. They used one of the nine channels to introduce reference standard as the
lock mass to calibrate the instrument. The mass accuracies were found to be
better than 5 and 10 ppm for 50% and 80% of the samples, respectively, from
a single batch analysis of 960 samples [79]. The average root mean square
(RMS) errors of the accurate mass measurements of the molecular weight of
the combinatorial library samples were determined to be 10 ppm [79].
The use of FTMS has been growing rapidly in drug discovery and pharma-
ceutical development [80]. One opportunity for utilizing the ultrahigh mass
resolving power of FTMS is in characterization of complex mixtures, such as
combinatorial libraries. Burton et al. [81] conducted multiple accurate mass
measurements for 41 compounds, using three different approaches. The
absolute mean errors were 5.2 (σ=7.4 ppm), 0.7 (σ=0.9 ppm), and 0.8 (σ=
1.0 ppm) ppm for the external, conventional internal, and dual ionization inter-
nal calibrations, respectively. In another application, Nawrocki et al. [82]
employed a 4.7-T external-source ESI FT-ICR mass spectrometer to analyze
small-peptide libraries, demonstrating the feasibility of analyzing several com-
binatorial libraries containing 100 to 10,000 small peptides. Furthermore, by
comparing the FTMS data with computer-simulated combinatorial library
mass spectra, the authors were able to monitor the diversity and degeneracy
of the library syntheses.
A well-established method for drug discovery is the utilization of a biolog-
ical assay to screen a large library of small organic molecules for their ability
to bind target biopolymers (i.e., protein) in a specific assay [83, 84]. In general,
the MS-based technologies have the advantage that only small amounts of
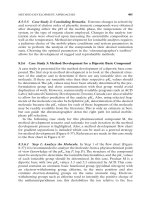
protein reagent are required. Recently, Annis et al. [85, 86] reported a high-
throughput affinity selection–mass spectrometry assay to screen mass-encoded
2500-member combinatorial libraries. A schematic representation of the
method is shown in Figure 7-12. Combination of the protein and a small
316 APPLICATIONS TO SMALL MOLECULES
molecule library leads to the formation of a complex of the protein with any
suitable library member. Size-exclusion chromatography (SEC) is then
employed to rapidly separate the protein target, along with any small mole-
cules bound to the target, from any unbound small molecules. The SEC band
containing the complex is immediately transferred to a reversed-phase chro-
matography column (60°C and pH 2). This step serves to denature the target,
thereby dissociating the previously bound small molecules from the complex.
The unbound small molecules are directly introduced into a high-resolution
mass spectrometer for analysis. By using the affinity selection–mass spectro-
metry method, Annis and co-workers discovered a bioactive ligand for the
anti-infective target Escherichia coli dihydrofolate reductase (DHFR) [85, 86].
7.7.2 Characterization of Impurities and Decomposition Products in Bulk
Drug Substances
One of the major applications of LC/MS in pharmaceutical analysis is the iden-
tification of impurities and degradation products in pharmaceuticals. Often,
impurities are synthetic by-products, starting materials, or degradation prod-
ucts. Drug regulatory agencies require the purity of a pharmaceutical to be
fully defined. Impurities that are present at a level of 0.1% or greater relative
to the active ingredient need to be characterized to comply with the regula-
tory requirements. This is important to ensure that the pharmacological and
toxicological effects are truly those of the drug substances and not due to the
impurities.
7.7.2.1 Characterization of Impurities by LC/MS. The impurities in phar-
maceuticals are mainly formed during the synthetic process from starting
materials, intermediates, and by-products. Generally, the impurities in staring
materials and intermediates are not required to be characterized by the
PRACTICAL APPLICATIONS 317
Figure 7-12. Diagram of the automated ligand identification system (ALIS) affinity
selection–mass spectrometry method. (Reprinted from reference 85, with permission
of Elsevier Science.)
regulatory agencies. These impurities, however, are likely to contain compo-
nents that affect the purity of the final manufactured pharmaceutical. By-
products are often generated during synthesis and are one of the major sources
of pharmaceutical impurities. The identification of the by-products often
allows the Development Operations to refine the manufacturing process to
minimize impurities and, thus, to maximize yield.
Traditionally, the impurities are isolated and purified by off-line HPLC
and then characterized by using FT-IR, NMR, MS, and X-ray crystallography,
among others. The main limitation associated with this approach is that
relatively large sample quantities are needed for analysis, and the process
can be very labor-intense. In contrast, LC/MS and LC/MS/MS are highly sen-
sitive techniques requiring typically less than 1 µg of material for analysis.
In certain cases, if the impurities are found at very low levels in the drug
substance, extraction procedures are used to concentrate them to detectable
levels.
The capabilities of separating a mixture containing highly varied concen-
trations of analyte and structural characterization of impurities have led to the
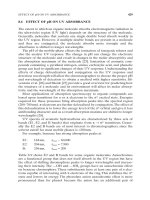
increased use of LC/MS. Nicolas and Scholz [87] illustrated the characteriza-
tion of a number of DuP 941 (Scheme 6) impurities by LC/MS(/MS). The five
unknown impurities were labeled A, D, E, F, and G along with the known
impurities B and C in the total ion chromatogram of DuP 941 obtained from
LC/MS analysis (Figure 7-13B). Because the UV-visible absorption and
response factor of related compounds tend to be similar, while their MS ion-
ization efficiencies can be significantly different, it is always useful to record
the UV chromatogram (Figure 7-13A) as well as the mass spectra for the iden-
tification of impurities. The protonated molecular ions ([M + H
+
]) of the impu-
rities A, D, E, F, G were found to be at m/z 392, 339, 324, 482, and 558,
respectively. The molecular ions of the impurities were selected for tandem
MS analysis in order to identify the unknown structures (Figure 7-13C). The
product-ion spectra for the five unknown impurities were shown in Figure 7-
14. The impurity A was found to be a by-product (Figure 7-15A) during the
synthetic process. Major fragment ions were observed at m/z 319, 305, and 261
318 APPLICATIONS TO SMALL MOLECULES
Scheme 6. Structure of DuP 941.
(Reprinted from reference 87, with permission of
Elsevier Science.)
(Figure 7-14A). The base peak at m/z 305 might arise from the neutral loss
of a 2-vinylamino-ethanol. The product ions formed by the neutral loss of 73
(2-methyleneamino-ethanol) and 44 (Ethenol) Da from the precursor ion of
m/z 392 were also consistent with the proposed structure (Figure 7-15A). The
production spectra of impurities D and E were similar in two ways. Both have
a base peak at m/z 88 which was produced when an N-(2-hydroxyethyl)
aminoethyl group was cleaved from the molecule. Both produce a less intense
product ion that was 61 Da less than the precursor ion (Figure 7-15; m/z 278
in D, and m/z 263 in E). This 61-Da loss was found to be the loss of a 2-
aminoethanol neutral. Further studies suggested that impurities D and E are
photo-decomposition products of DuP 941[87]. Based on the LC/MS/MS data,
PRACTICAL APPLICATIONS 319
Figure 7-13. DuP 941 lot 3 chromatograms: (A) LC/UV; (B) LC/MS; (C) LC/MS/MS.
A and B were acquired from a single injection using an HP 1090. UV and MS detec-
tors were in series. C was acquired from a subsequent injection. (Reprinted from ref-
erence 87, with permission of Elsevier Science.)
possible structures were also assigned to the other impurities (Figure 7-15F,G).
The fragmentation patterns of the product-ion spectra (Figure 7-14F,G) were
found to be consistent with the proposed structures. In addition, the same
group found that the MS/MS fingerprint reproducibility was very good for all
the unknowns examined and could be applied as a useful tool for the on-line
characterization of impurities in bulk drug substances [87].
7.7.2.2 Characterization of Decomposition Products by LC/MS. The use
of LC/MS and LC/MS/MS also has a significant impact on degradant charac-
terization. The degradation profiles are critical to the safety and potency
assessment of the drug candidate for clinical trials. Drug degradation in for-
mulations is highly complex and often unpredictable. The degradation prod-
ucts usually arise from the ingredients used in dosage formulation and/or in
the process of formulation where temperature, humidity, and light may all play
a role.The degradants can be generated from hydrolysis, oxidation, adduct for-
mation, dimerization, rearrangement, and often the combination of these
processes.
320 APPLICATIONS TO SMALL MOLECULES
Figure 7-14. LC/MS/MS spectra of unisolated DuP 941 impurities. (Reprinted from
reference 87, with permission of Elsevier Science.)
To accelerate drug development, various stress-testing protocols had been
designed to emulate stresses the compound might experience during manu-
facturing processes and storage. These methods exposed drug candidates to
forced degradation conditions such as acid, base, heat, oxidation, and expo-
sure to light. A successful identification of the degradation products can help
formulation scientists to understand the degradation mechanism of drug can-
didate and improve the clinical formulation development.
There had been numerous reports in the literature that involved LC/MS
and LC/MS/MS for characterization of degradation products [1, 88–97]. An
early example of the rapid structure elucidation of drug degradants induced
by acid, base and heat by LC/MS was reported by Rourick et al. in 1996 [90].
In general, the LC/UV/MS provided the UV and molecular weight data,
PRACTICAL APPLICATIONS 321
Figure 7-15. Possible structures of unisolated DuP 941 impurities showing proposed
CID fragmentations. (Reprinted from reference 87, with permission of Elsevier
Science.)
whereas the tandem LC/MS provided substructural information. The same
group demonstrated that the similar procedure could be applied to obtain the
structural information of the degradation products of paclitaxel (Taxol) [89].
Recently, Feng et al. [92] investigated the oxidative degradation products of
an antifungal agent, SCH 56592 (Scheme 7), by both LC/MS and LC/NMR
analysis. Four major oxidative degradation products of SCH 56592 were char-
acterized, and the oxidation was found to be occurred at the piperazine ring
in the center of the drug molecule.
322 APPLICATIONS TO SMALL MOLECULES
Scheme 7. Structure of SCH 56592.
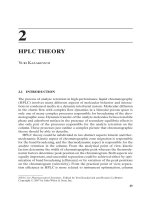
Shipkova et al. [94] demonstrated the use of on-line high-resolution
LC/ESI-MS using a magnetic sector mass spectrometer for analysis of minor
components in complex mixtures. Everninomicin (SCH 27899; Figure 7-16)
belongs to an important group of oligosaccharide antibiotics isolated from the
fermentation broth of Micromonospora carbonaceae. The compound was
degraded in ammonium hydroxide solution at pH 10, and the total ion chro-
matogram of the reaction mixture was obtained by LC/ESI-MS analysis
(Figure 7-17). The ESI-MS analysis was performed in the negative ion mode.
The deprotonated molecular ion of SCH 27899 was recorded at m/z 1628 ([M
− H]
−
), which indicated that the molecular weight of SCH 27899 was 1629Da.
Based on the LC/MS results of the base stressed sample, nine degradants
eluted at 6.1 min (MW 712), 7.5 min (MW 951), 10.2 min (MW 1496), 12.1 min
Figure 7-16. Structure of SCH 27899.
(MW 694), 13.3 min (MW 1478), 13.5 min (MW 854), 14.8min (MW 1616), 15.7
min (MW 1646), and 27.4 min (MW 1660) in the LC/MS chromatogram were
characterized as degradant 1 to 10, respectively (Figure 7-17). A mass mea-
surement accuracy of 0.4 to 1.9ppm was achieved for the exact mass mea-
surements, using PEG sulfates as internal calibration substance. Based on the
high-resolution MS information, empirical formulae were obtained for all
components (data not shown). The MS/MS spectra of source-produced frag-
ment ions were used to characterize the unknown structures due to the limit
sample quantities. The structures of the degradants were proposed based on
the fragmentation studies, as well as high-resolution data (Figure 7-18). The
authors found that degradants 1 to 5 were the hydrolysis products of SCH
27899, whereas degradant 6 was hydrolysis and oxidation products of SCH
27899. For example, degradant 2 was formed via ring opening of ortho-ester
C, whereas degradant 5 was formed by loss of a terminal aromatic group (2)
from SCH 27899.
The unique ability of FTMS to provide an exact-mass measurement for
each of the ions produced in multiple-stage tandem MS (MS
n
) assists greatly
in the structure determination of degradation products [97]. Winger et al. [96]
carried out LC FTMS and tandem MS experiments for the detection and iden-
tification of various degradants from drug candidates. This approach drasti-
cally reduced the time required for isolation and purification of substantial
quantities of material and expedited the identification process.
PRACTICAL APPLICATIONS 323
Figure 7-17. Reconstructed ion chromatogram (RIC) of a bulk drug substance (SCH
27899) degraded in ammonium hydroxide solution at pH 10, displaying all the identi-
fied mixture components 1–10. (Reprinted from reference 94, with permission of John
Wiley & Sons.)