Tài liệu HPLC for Pharmaceutical Scientists 2007 (Part 8B) pdf
Bạn đang xem bản rút gọn của tài liệu. Xem và tải ngay bản đầy đủ của tài liệu tại đây (658.19 KB, 17 trang )
Also the spectral homogeneity of the peak of interest must be taken into
consideration.
Diode array spectra at least three points across the peak should
be taken to ensure the peak is spectrally homogenous see Figure 8-14. If the
peak is not spectrally homogenous, the overlay of the spectra will show
368 METHOD DEVELOPMENT
Figure 8-13. Optimal wavelength selection for API and related impurities.
Figure 8-14. Determination of peak homogeneity: Diode array detection (DAD).
(Reprinted from reference 10, with permission.)
distinct differences (see Figure 8-15). However, even if the diode array spectra
do overlay, this does not absolutely ensure that the peak does not contain any
coeluting impurities, because the impurities could have similar diode array
spectra and/or if there is a low level of a coeluting species with a different
diode array spectrum, it may not be determined by this approach. In these
cases, MS detection needs to be employed to ensure MS spectral homogene-
ity. MS spectra are taken across the peak and the MS spectra across the peak
should not show the presence of any other coeluting species of different
masses. This does not absolutely ascertain that the peak is homogeneous since
isomers of the same compound will have the same [M + H] and is indistin-
guishable from the parent compound. Also, the impurity that may be coelut-
ing may not have an appreciable ionization efficiency at the particular
mobile-phase and mass spectrometric conditions.
An example of where using diode array detection may not be helpful is
shown in Figure 8-16. Note that for this reaction mixture (convergent synthe-
sis) the desired product 1 has the same diode array spectra as synthetic pre-
cursors 2 and 3. If these two synthetic precursors had coeluted with 1, they
would not have been able to be deconvoluted. This stresses the importance
of running LC-MS in a parallel to diode array studies during method
development.
8.4.3 Solution Stability and Sample Preparation
It should be determined if the drug substance being analyzed is stable in solu-
tion (diluent). During initial method development an autosampler tray cooler
METHOD DEVELOPMENT CONSIDERATIONS 369
Figure 8-15. Diode array detection for elucidation of coeluting species. (Reprinted
from reference 10, with permission.)
and preparations of the solutions in amber flasks should be performed until it
is determined that the active component is stable at room temperature and
does not degrade under normal laboratory conditions. Also, since it is not
known if dimeric species or more hydrophobic compounds are present in the
sample solutions during the initial method development or are formed in sta-
bility studies, gradient elution should always be performed with a hold at
higher organic conditions (or up to the buffer stability limit).
The reduction of downtime of the instrument (i.e., operations of pump com-
ponents, injectors, and detectors) can be controlled to some degree if sample
solutions are filtered and/or centrifuged; the use of a 0.2- or 0.45-µm-pore-size
filter is generally recommend for removal of particulates [15]. Filtration as a
preventive maintenance tool for HPLC analyses is well-documented in the lit-
erature [16–18].
Sample preparation is a critical step of method development that the
analyst must investigate. For example, the analyst should investigate if cen-
trifugation (determining the optimal rpm and time) shaking and/or filtration
of the sample is needed, especially if there are insoluble components in the
sample. This is usually more prevalent with excipient/DS mixtures and with
slurry solutions obtained during the synthesis steps of the API. Syringe filters
370 METHOD DEVELOPMENT
Figure 8-16. Reaction conversion of a convergent synthesis (2 + 3) to 1 and overlay of
diode array profiles.
are routinely used to remove particulate contamination/insoluble components
from samples prior to chromatographic analysis.
The objective is to demonstrate that the sample filtration does not affect
the analytical result due to adsorption and/or extraction of leachables. A word
of caution here is that filter studies should be performed to ensure that no
adsorption of the compound on the filter is observed. This is particularly the
case with protein and peptide samples. Note that for proteins and peptides the
impact of centrifugation (speed and time) must be investigated because this
may lead to increased aggregate formation. Also, for protein and peptides the
initial concentration of the sample could also have an impact on the concen-
tration gradient of the sample in the centrifuge tube, and the concentration of
the top, middle, and bottom portions should be assessed.
The effectiveness of the syringe filters is largely determined by their ability
to remove contaminants/insoluble components without leaching undesirable
artifacts (i.e., extractables) into the filtrate. Extractables are often the result
of inappropriate material construction and improper handling of the device
during the manufacturing process. Particular attention should be paid to
potential extractables from the membrane and housing material. The sample
preparation procedure should be adequately described in the respective ana-
lytical method that is applied to a real in-process sample or a dosage form for
subsequent HPLC analysis. The analytical procedure must specify the manu-
facturer, type of filter, and pore size of the filter media. Also, it must be known
if the particular filter type is compatible with the type of analyte, organic
solvents, and pH of the solution to be filtered.
The following procedure may be used to determine if there is any absorp-
tion on the filter.A stock solution is prepared at the target concentration. One
aliquot of the stock solution is centrifuged, and other aliquots from the cen-
trifuged stock solution are filtered through the desired filters (pre-wet with
5 mL of diluent) and the results compared. If any additional peaks are observed
in the filtered samples, then the diluent must be filtered to determine if a leach-
able component is coming from the syringe filter housing/filter. In Figure 8-17
a solid oral dosage form was prepared at 1 mg/mL concentration. The initial
stock solution was centrifuged (no filter) and two additional samples from the
centrifuged solution were filtered with a nylon filter and a cellulose filter. The
area counts (Table 8-4) of all three solutions were compared, and it was shown
that significant absorption was observed on the nylon 66 filter. Further opti-
mization of the sample preparation would include removing the centrifugation
step and just filtering the supernatant (solution above the undissolved excipi-
ents) with the cellulose acetate filter.
Another example includes the recovery (mass %) of API and degradation
products of API from two 100-mg tablet (5 tablets) sample solution clarified
by filtration and clarified by means of centrifugation. The data in the Table
8-5 demonstrates that the two methods of sample clarification are equivalent
and that the filtration procedure (0.2-µm Nylon filter, with 5mL pre-wet) is
METHOD DEVELOPMENT CONSIDERATIONS 371
372 METHOD DEVELOPMENT
Figure 8-17. Comparison of filtered (nylon filter versus cellulose filter) versus no filter
(centrifuged). Column: Luna C18 (2). Mobile phase: (A) 10 mM ammonium bicarbon-
ate, pH 7.5; (B) MeCN, linear gradient from 0 to 15 minutes, 20—70% of B. Sample
concentration: 1 mg/mL.
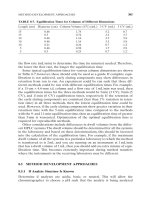
TABLE 8-4. Area Counts for Centrifuged/Filtered
Solutions
Type of Sample Preparation Area Counts
30-mm Nylon filter, 0.2 µm 484,155
No filter (supernatant solution) 5,612,755
13-mm Cellulose acetate filter, 0.45 µm 5,633,064
TABLE 8-5. Filter Evaluation Results for API Assay-Related Substance Samples
API Impurity 1 Impurity 2 Impurity 3 Impurity 4
Sample Name (%) (%) (%) (%) (%)
Filtered samples
1 99.0 0.079 0.082 0.025 0.042
2 99.4 0.079 0.082 0.025 0.042
3 99.5 0.079 0.084 0.025 0.043
Mean 99.3 0.079 0.083 0.025 0.042
% S
rel
0.3% 0.0% 1.4% 0.0% 1.4%
Centrifuged samples
1 99.1 0.080 0.080 0.025 0.042
2 98.9 0.081 0.080 0.025 0.042
3 100.0 0.078 0.078 0.025 0.042
Mean 99.3 0.080 0.079 0.025 0.042
%S
rel
0.6%
1.9% 1.5% 0.0% 0.0%
adequate and does not cause any specific absorption of the active and/or
impurities.
Other considerations for sample preparation include incorporation of
methanol in the sample preparation scheme, especially if a second dilution is
used (check for sample reactivity). The impact on peak shape (diluent/mobile
phase mismatch for components with k < 2) should also be considered. Sample
preparation usually constitutes approximately 70% of solvent usage, and
incorporating methanol for routine sample preparation can lead to reduction
in solvent costs.
8.4.4 Choice of Stationary Phase
Ideally for a reversed-phase separations, the retention factors (k) for all com-
ponents in a sample should lie between 1 and 10 to achieve separation in a
reasonable time. For a given stationary phase the k of a particular component
can be controlled by changing the solvent composition of the mobile phase.
However, the impact of eluent composition will depend on the type of sta-
tionary phase and the nature of the components in the mixture. In reversed-
phase HPLC the most common solvent mixtures are: water and acetonitrile,
water and methanol, and water and THF. The elution strength increases as the
organic portion of the modifier increases. Thus, to optimize a chromatographic
separation, the concentration of the organic modifier is adjusted so that the k
of the components in the sample are in the range of 1 to 10. However, some-
times due to the hydrophobic nature of the compound, even high concentra-
tions of organic modifier will not allow elution of all components in a single
run and the chromatographer can try one or a combination of the following
approaches: (1) Use a stronger modifier; (2) apply a steeper gradient; (3) use
a less hydrophobic stationary phase. Detailed discussion of the reversed-phase
separation principles and separation optimization is given in Chapter 4.
The type of column chosen for a particular separation depends on the com-
pound and the aim of analysis. Pharmaceutical companies may have a pre-
ferred list of columns that have good demonstrated performance in regard to
pH/temperature stability. These columns that have been selected by a specific
laboratory are known to be stable within predefined pH and temperature
regions in which method development/column screening are employed. A
good understanding of the chemical stability of the stationary phases is
needed, and some examples are shown in Section 8.10.
Screening columns from each of the following various column classes
should provide for the desired chromatographic selectivity, even for the most
challenging separations: (1–3) C8 or C18 stable at pH < 2, pH 2–8, and pH >
8–11; (4) phenyl; (5) pentafluorphenyl; (6) polar embedded and stationary
phases that could be run in 100% aqueous. A certain number of columns in
each of the six column classes and subclasses could be chosen as standard
columns that the chromatographers choose as a first choice for performing
method development.These standard columns could be chosen based on some
METHOD DEVELOPMENT CONSIDERATIONS 373