Tài liệu HPLC for Pharmaceutical Scientists 2007 (Part 9) pptx
Bạn đang xem bản rút gọn của tài liệu. Xem và tải ngay bản đầy đủ của tài liệu tại đây (313.42 KB, 48 trang )
9
METHOD VALIDATION
Rosario LoBrutto and Tarun Patel
9.1 INTRODUCTION
The method validation process is to confirm that the method is suited for its
intended purpose. Although the requirements of validation have been clearly
documented by regulatory authorities [ICH, USP, and FDA], the approach to
validation is varied and open to interpretation. Validation requirements differ
during the development process of pharmaceuticals. The method validation
methodologies in this chapter will focus on the method requirements for
preliminary and full validation for both drug substance and drug product.
Preliminary method validation is generally performed in the earlier phases of
development up to Phase IIa because at this time ICH Q2A and Q2B [1] are
not yet binding. A more extensive validation (full validation) is performed
for methods used in later stages of drug development (after Phase IIa) and
for methods that will be used to evaluate marketed products. Specific require-
ments or methodologies for validation depending on the life cycle of the
potential drug candidate in each specific area in the drug development process
will be addressed in the corresponding chapter.
An analytical method is a laboratory procedure that measures an attribute
of a raw material, drug substance, or a drug product. Analytical method vali-
dation is the process of demonstrating that an analytical method is reliable
and adequate for its intended purpose. Any method that is utilized to deter-
mine results during drug substance and formulation development will have to
be validated. Reliable data for release of clinical supplies, stability, and setting
shelf life can only be generated with appropriate validated methods.
455
HPLC for Pharmaceutical Scientists, Edited by Yuri Kazakevich and Rosario LoBrutto
Copyright © 2007 by John Wiley & Sons, Inc.
Validation of high-performance liquid chromatography (HPLC) methods
focus mainly on the following:
•
Identification tests
•
Quantitative measurements of the content of related substances*
•
Semiquantitative and limit tests for the control of related substances*
•
Quantitative tests for the assay of major components (e.g., drug substance
and preservatives) in samples of drug substance or drug product (assay,
content uniformity, dissolution rate, etc.)
Moreover, HPLC methods that are described in pharmacopeias may not have
to be validated but should be verified, if necessary. Well-characterized refer-
ence materials with documented purity should be used throughout the vali-
dation study, especially during full development. Validation experiments and
analyses must be carried out on fully qualified and calibrated instrumentation,
and some references have been published on this subject [2–6].
Analytical method validation is established through documented evidence
demonstrating the accuracy, precision, linearity, selectivity, ruggedness, and/or
robustness of that particular test method which will be utilized to generate test
results for a drug substance or drug product. Different test methods require
different validation parameters. All analytical procedures require some form
of method validation, regardless of whether the test method is utilized for the
testing of Good Laboratory Practice (GLP) toxicology, shelf-life determina-
tion (stability indicating), in-process controls [7], clinical release, or release of
products for open market [8]. As development of the project progresses and
as more analytical and product-specific information is acquired, the analytical
methods evolve and are gradually updated. The extent of validation increases
and the documentation is completed.
During the early development phase, depending on the analytical labora-
tory, generic validation protocols may be used because project-specific pro-
tocols are not required. Sometimes an internal Standard Operating Procedure
(SOP) suffices and a generic validation protocol does not need to be used.
Usually, for Phase I, validation experiments may be carried out concurrently
with the analysis of the first batch of clinical supplies or the first delivery of
drug substance to be used for clinical supplies. However, depending on the
pharmaceutical organization method validation may need to be performed
prior to the analysis of material that will be used for clinical supplies.
For analytical method validation during full development (after final syn-
thesis has been set for drug substance and after final market formulation has
been set for drug product) corresponding to the definitive control procedure
for new drug application (NDA), a specific validation protocol has to be
written. Before start of the experimental work, the protocols must be written
456 METHOD VALIDATION
*Related substances described in this chapter encompass degradation products, and synthetic
by-products.
by an analytical chemist and approved by a quality assurance department.
Some of the items that are necessary to be specified in the validation proto-
col are listed below:
•
The analytical method for a given product or drug substance
•
The test to be validated
•
The test parameters for each test, including type and number of solutions
and number of injections
•
The acceptance criteria for each parameter based on an internal SOP
(product or method-specific adaptations may be necessary and are accept-
able, if justified)
•
List of batches of drug substance and/or drug products
•
For a drug product the grade/quality of the excipients used in the
formulation
•
List of reference materials to be used in the validation experiments
•
Information on the instruments and apparatus to be used
•
Responsibilities [author, chemists, analytical research project leader,
quality assurance (QA), etc.]
Depending upon a company’s culture, a method validation protocol could be
simple (listed items above) or exhaustive (in addition to the listed items above,
each parameter to be validated is described in detail): How solutions are going
to be made, the experimental design, how the calculations are going to be
performed, any software to be utilized (e.g., Excel). If a full-length protocol is
required within a particular company, then the writing of this protocol and
approval of the protocol would need to be completed prior to the com-
mencement of the validation work. Otherwise, there may be many deviations
to the protocol which will be needed to be referenced to in the final method
validation report. Some companies also have templates for the validation
reports, thereby allowing for facile population of the results. Once populated,
the file is reviewed to determine if all validation parameters and acceptance
criteria were met. If they were not, then a deviation is added and the proper
justification must be given. If it is deemed that the justification is not ap-
propriate, then an action plan for the specific figure of merit in question is
determined (i.e., repeat analysis, change of the analytical procedure, and
revalidation). Also, if the analytical method has not yet been approved at the
time of writing the validation protocol, it is recommended to attach a final
draft of the method to the protocol. The final HPLC method must also be
approved with the validation report submission.
9.2 VALIDATION REPORT
A validation report is written during early and full development, and approval
by QA is required. Existing method validation data from earlier stages of
VALIDATION REPORT 457
development may be used for full development if the HPLC method has not
changed. Minor changes such as change in equilibration time may be accept-
able, and the preliminary validation performed for early phase may be used.
These data can be referred to in the validation report, and reference to the
original data must be given.
The validation report should contain reference to the analytical methods
(specific code number used as identifier within the pharmaceutical organiza-
tion) and the corresponding drug substance or product name. Note that for
early-phase method validation reports the results maybe filled in a predefined
table and compared against the acceptance criteria. However, for late-phase
validation, more explicit reports are generated explaining each and every
experiment, with detailed steps of sample and standard preparation.
The list of reference materials (reference standards with the appropriate
certificate of analysis) as well as the list of calibrated and qualified instruments
used in the validation experiments should be documented in the report.
For drug substances the list of the batches of drug substances, notebook
number/reference number for any individual impurities, or solutions or inter-
mediates used should be listed. For drug products the list of the batches of
drug substances, drug product, and the grade/quality of excipients should be
listed. The test parameters and acceptance criteria should be listed together
with the results for each test, and the results passed or failed should be indi-
cated. The validation report should also contain whether the method valida-
tion was successful and if any changes had to be applied to the analytical
method, and then the final analytical method must be resubmitted for QA
approval.
9.3 REVALIDATION
After any major changes in the HPLC method (solution preparation, experi-
mental conditions, etc.) or after change in route of synthesis of the drug sub-
stance or drug product manufacture (change of process, change of equipment,
change of analytical procedure), it must be assessed whether a new validation
or a partial validation is required, addressing all the validation parameters that
may be affected by the methodological change. If revalidation is not deemed
necessary, then the reasons behind the decision must be documented in the
revision history of the test method and the proper change control initiated.
The revision of the test method and any documents that refer to the original
method, such as the analytical specifications, will then be approved by QA.
When revalidation is deemed necessary, the reason for change must be docu-
mented and any new validation activities must be performed according to an
approved, updated HPLC validation protocol. The results would then be doc-
umented in an update of the validation report or a supplement to the original
validation report.
458 METHOD VALIDATION
9.4 ASSIGNMENT OF VALIDATION PARAMETERS
The type and degree of validation depends on the nature of the test. In par-
ticular, methods described in pharmacopeias may not have to be validated but
should be verified, if needed. Different test methods require different valida-
tion parameters. As development of the project progresses and as more ana-
lytical and product-specific information is acquired, the analytical methods
evolve and are gradually updated. The extent of validation increases and the
documentation is completed. Table 9-1 outlines the validation parameters that
are usually required for the early development stage, and Table 9-2 outlines
the validation parameters that are usually required for the full development
stage.
The proposed acceptance criteria in Table 9-3 should be included in the
validation protocol, especially for the full development stage.
There are numerous method validation examples in the literature [9–18].
Each company has their own approach and own set of acceptance criteria for
different analytical assays, but these approaches must be within the confines
of their line unit QA department and be in accordance with any regulatory
provisions. In the next section a description for each of the parameters to be
validated (figures of merit) are described in detail and examples are given
for each.
ASSIGNMENT OF VALIDATION PARAMETERS 459
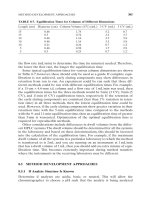
TABLE 9-1. Early Development
Type of Tests to Be Validated
Weight Percent/Assay/Content Impurity Testing:
Validation Parameters Identity Uniformity/Dissolution Quantitative Test
a
Specificity Yes Yes Yes
Linearity No Yes
b
Yes
b
Accuracy No Yes
c
Yes
d
Precision (repeatability) No Yes Yes
e
Limit of detection No No Yes
f
Limit of quantitation No
g
No Yes
d
Stability of the solutions No Yes Yes
a
If impurities not available, with drug substance.
b
Four points may be adequate.
c
For drug product only (assay/CU/dissolution).
d
A spiking experiment carried out is adequate at this stage (only possible if impurity/impurities
are available).
e
At least triplicate analysis.
f
Not required, but recommended.
g
For the identity test of a 0-mg formulation (placebo), it may be necessary to document the
absence of drug substance, and an LOQ determination will then be required.
9.4.1 Accuracy
The test for accuracy is intended to demonstrate the closeness of agreement
between the value found and the value that is accepted either as a conven-
tional true value or as an accepted reference value [19]. Therefore, accuracy
can be defined as the agreement between the result obtained with method
being validated and an accepted reference value. The accuracy can be inferred
from precision, linearity, and specificity. The results for the method being
validated can be compared to the results with those of a well-characterized,
independent method. These results may be compared to an alternate
reversed-phase HPLC method (phenyl versus C18 or separation run at dif-
ferent pH using the same column) using the same detection scheme. In some,
cases an orthogonal method is used to demonstrate accuracy. The methods
should differ with respect to separation mode and therefore provide orthog-
onal information concerning related substances and degradation products.
For example, one method would use reversed-phase (RP) separation mode on
a C18 column, and the second method would use a strong cation exchange
(SCX) column [20]. The orthogonal methods may show different selectivities
toward the degradation products, thereby demonstrating the orthogonal
nature of the two separation techniques. The accuracy would be demonstrated
460 METHOD VALIDATION
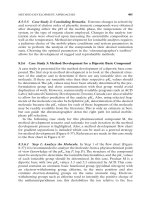
TABLE 9-2. Full Development
Type of Tests to Be Validated
Weight Percent/Assay/Content Impurity Testing:
Validation Parameters Identity Uniformity/Dissolution Quantitative Test
Specificity
a
Yes Yes Yes
Linearity No Yes Yes
Accuracy No Yes Yes
Precision (repeatability) No Yes Yes
Precision (intermediate No Yes Yes
precision)
b
Precision (reproducibility) No
cc
Range No Yes Yes
Limit of detection No No Yes
e
Limit of quantitation No
d
No Yes
Stability of the solutions No Yes Yes
Robustness
f
Yes Yes
a
Lack of specificity of one analytical procedure may be compensated for by other supporting
analytical procedures.
b
In cases where reproducibility has been performed, intermediate precision not needed.
c
In exceptional cases.
d
For the identity test of a 0-mg formulation (placebo) it may be necessary to document the absence
of drug substance and an LOQ determination will then be required.
e
Not required by ICH, but recommended.
f
May be required, depending on the nature of the test.
ASSIGNMENT OF VALIDATION PARAMETERS 461
TABLE 9-3. Proposed Acceptance Criteria for Drug Product (DP) and Drug
Substance (DS)
Quality
Characteristics Parameter to be Validated Acceptance Criteria
Identity Selectivity/specificity All known peaks are separated. Major
(API) peak is “pure” [Peak purity
angle ≥ peak threshold angle].
{DS and DP}
For the identity test of a 0-mg
formulation (placebo), it may be
necessary to document the absence
of drug substance, and an LOQ
determination will then be required.
{only DP}
Dissolution Accuracy (mean)
(drug
•
Recovery 95–105%
product)
•
S
rel
for recovery ≤2.5%
Precision
•
Repeatability S
rel
≤ 2.0%, n ≥ 6 {at Q time}
•
Intermediate precision Project specific.
Linearity n ≥ 6
•
Correlation coefficient r ≥ 0.990
•
y-intercept (absolute value) ≤5%
•
Residual standard deviation ≤2.5%
Stability of solutions
•
Sample ≤2.0% change over specified time
•
Reference standard ≤2.0% change over specified time
Specificity
•
HPLC No interference from placebo solution
at the retention time of API.
Range (basket/paddle) IR: ±30% of specified range
MR,SR: From 50% of Q-value to 130%
of label claim.
Content Precision As defined in assay
uniformity Accuracy
(CU) Stability of solutions
Drug product Specificity Chromatographic peaks are separated.
No indication of interference from
placebo solution at the retention
time of API.
Linearity n ≥ 6
•
Correlation coefficient r ≥ 0.990
•
y-intercept ≤5.0%
•
Residual standard deviation ≤2.0%
Range At least 70–130% of declared content
Assay—drug Accuracy (mean)—DP
product
•
Recovery 98.0–102.0%
•
S
rel
for recovery ≤2.0%, n ≥ 9 (at least three
concentrations)
462 METHOD VALIDATION
TABLE 9-3. Continued
Quality
Characteristics Parameter to be Validated Acceptance Criteria
Weight Accuracy—DS
percent—
•
Comparison of methods % difference of the mean of two
drug (i.e., titration, DSC, PSA) methods ≤2.0%
substance Precision
•
Repeatability S
rel
≤ 2.0%, n ≥ 6, DP
S
rel
≤ 1.0%, n ≥ 6, DS
•
Intermediate precision S
rel
≤ 2.0%, n ≥ 4 [when combined from
two analysts]
Linearity n ≥ 6
•
Correlation coefficient r ≥ 0.998
•
y-intercept ≤2.0%
•
Residual standard deviation ≤2.0%
Stability of solutions
•
Sample ≤2.0% change over specified time (DP)
•
Reference standard ≤2.0% change over specified time (DP)
•
Sample ≤1.0% change over specified time (DS)
•
Reference standard ≤1.0% change over specified time (DS)
Specificity
•
HPLC Chromatographic peaks are separated.
No indication of interference from
placebo solution at the retention time
of API.
No indication of another peak under
the API peak.
Range At least 80–120% of declared content
(100% = concentration X of final
sample stock solution)
Ruggedness/robustness ≤1.0% difference for a defined range of
intentionally altering sensitive
parameters (pH of mobile phase,
column, temperature, flow rate,
wavelength, etc.)
Drug product- Precision
Related
•
Repeatability Level < 0.1%, S
rel
≤ 30%, n ≥ 6
substances Level 0.1–<0.2%, S
rel
≤ 20%, n ≥ 6
(degradation Level 0.2–<0.5%, S
rel
≤ 10%, n ≥ 6
products) Level 0.5–<5%, S
rel
≤ 5%, n ≥ 6
Level ≥ 5%, S
rel
≤ 2.5%, n ≥ 6
Drug substance
•
Intermediate precision Level < 0.1%, S
rel
≤ 40%, n ≥ 4
(synthetic by- [all replicates combined Level 0.1–<0.2%, S
rel
≤ 30%, n ≥ 4
products and from two analysts] Level 0.2–<0.5%, S
rel
≤ 15%, n ≥ 4
degradation Level 0.5–<5%, S
rel
≤ 7.5%, n ≥ 4
products) Level ≥ 5%, S
rel
≤ 4.0%, n ≥ 4
Specificity Known peaks are separated.
•
HPLC No indication of interference from
placebo solution at the retention time
of API.
No indication of another peak under
the API peak.
ASSIGNMENT OF VALIDATION PARAMETERS 463
TABLE 9-3. Continued
Quality
Characteristics Parameter to be Validated Acceptance Criteria
Linearity n ≥ 6
•
Correlation coefficient r ≥ 0.990, DP and r ≥ 0.998, DS
•
y-intercept Level < 0.5%: ≤25%
Level 0.5–<1%: ≤10%
Level ≥1%: ≤5.0%
•
Residual standard deviation Level < 0.2%: ≤20%
Level 0.2–<0.5%: ≤10%
Level 0.5–<5%: ≤5.0%
Level ≥ 5%: ≤2.5%
Range LOQ to 120% of specification limit of
largest impurity or related substance
LOD Peak signal/noise ratio ≥3:1
LOQ Peak signal/noise ratio ≥10 : 1 and
S
rel
≤ 10%, n ≥ 5
Accuracy (mean) Level < 0.2%: 70–130%
•
Recovery Level 0.2–<0.5%: 80–120%
Level 0.5–<5%: 90–110%
Level ≥ 5%: 95–105%
•
S
rel
for recovery Level < 0.5%: ≤10%,
Level 0.5–<5%: ≤5%
Level ≥ 5%: ≤2.5%
For all, n = 9 (at least three
concentrations), a weighted average
maybe used based on the level and
the S
rel
.
Stability of solutions [report
two decimal places]
•
Reference standard Level < 5% of
theoretical 100% Change ≤10%
concentration over specified
time
Level ≥ 5% of
theoretical 100% Change ≤2.0%
concentration over specified
time
•
Sample Related substances (impurities)
Level < 0.5% Change ≤20% over
specified time
Level 0.5–<5% Change ≤10% over
specified time
Level ≥ 5% Change ≤5% over
specified time
No new peak ≥ reporting level
Ruggedness/robustness Defined based on an experimental
design and data (sensitive parameters
and a range for each parameter in
the final test method)
if the overall purity in both of the methods would still be the same according
to a predefined set of acceptance criteria. Different types of separation
methods could also be used to show accuracy. For example, if normal-phase
chromatography was used as the parent method, this could be compared to a
separation obtained using supercritical chromatography. In another example,
an electrophoretic method using capillary electrochromatography or capillary
electrophoresis could be compared to an HPLC separation.
Also, the HPLC weight percent (assay) method of the drug substance can
be compared to nonchromatographic methods such as nuclear magnetic
resonance (NMR) [21], Phase Solubility Analysis (PSA), and DSC [22] and to
nonspecific titration and spectrophotometric assay methods that may have
been used in early development before the qualification of a reference stan-
dard. Potentiometric titration methods using nonaqueous or aqueous titrations
are only amenable to ionizable compounds and are nonspecific because the
impurities may contain the same ionizable functionality as the parent com-
pound being titrated. Titration is a nonspecific method because synthetic by-
products in drug substance may have a pK
a
similar to that of the main
component (the endpoints for the by-products and the drug substance may
overlap in this case) and results may be biased, leading to a higher weight
percent of the material.
However, these titration methods can be used in early development when
a reference standard is not available. Also, the spectrometric-based assay
methods such as ultraviolet (UV) may be nonspecific because most of the drug
substance impurities contain a similar chromophore as the parent molecule. If
UV is used, UV absorption is measured at one or more wavelengths and the
absorbance value is recorded for a particular concentration. Sandor Gorog
has critically evaluated the difference between specific and nonspecific assay
methods in the European and US Pharmacopoeias [23]. The difference
between the mean and the accepted true value with a defined confidence inter-
val should be reported in the acceptance criteria.
The accuracy can also be demonstrated by recovery of drug substance
spiked into a placebo for a drug product. The accuracy can also be demon-
strated by recovery of the impurity spiked to a drug substance or into a
placebo with drug substance. The percentage recovery with the certain accep-
tance criteria at each defined level is reported.
Accuracy should be assessed using a minimum of nine determinations at a
minimum of three concentration levels covering the specified range (e.g., 3
concentrations/3 replicate preparations of each in the total analytical proce-
dure) within the ranges shown in Table 9-4.
Accuracy is performed to determine recovery of an active or degradation
products from a drug product or recovery of related substances from a drug
substance. The experiment is designed to recover the total amount of active
or degradation product from a drug product or a specific impurity or impuri-
ties from a drug substance. For recovery of the active for assay and CU, a
known amount of drug substance in solution is spiked into the placebo blend.
The influence of sample preparation steps for tablets must be taken into con-
464 METHOD VALIDATION
sideration such as grinding, sonication, and extraction. For assay determina-
tion, the experiment setup is straightforward. A minimum of three concentra-
tions (centered around the target concentration) and three replicates are
prepared at each concentration (one injection each) to make a total of nine
determinations.The minimum three concentrations should be 70%, 100%, and
130% of the target concentration. If this is used, then these accuracy solutions
could be used for both content uniformity and assay method if they are indeed
the same method. Usually in early development the same method is used. In
later development if a new fast CU method is developed (<5 min), it would
have to be revalidated for recovery. In the following theoretical example, for
a lyophilized drug substance, a placebo solution is made with the excipients
and is diluted with the drug substance X stock solution (2.67 mg/mL) and
further diluted to the desired concentration with the proper diluent. The
nominal 100% level solution without placebo is used as an external calibra-
tion standard. The range explored is shown in Table 9-5. An example of the
preparation is shown in Table 9-6. The percent recovery of drug substance X
from the nominal 70%, 85%, 100%, 115%, and 130% sample solutions was
then determined by an external calibration standard (shown in Table 9-7). The
average percent recovery is 99.3% (n = 15), and at each level the recovery is
found to be within the acceptance criteria of 98.0–102.0%. For validation of
HPLC analytical methods during the early phase, an acceptance criteria of
95–105% for recovery may be acceptable if the specifications are outside the
range of 95–105% (i.e., 90–110%).The specifications may never be tighter than
the acceptance criteria. Moreover, the S
rel
[%RSD (relative standard devia-
tion)] determined from the overall percent recovery is 0.18% (n = 15) and
passes the acceptance criteria of S
rel
≤ 2.0%.
For degradation products, the same procedure as the assay can be followed,
except the amount should be from reporting level to at least 120% of the
ASSIGNMENT OF VALIDATION PARAMETERS 465
TABLE 9-4. Minimal Concentration Ranges for Accuracy Test (Wider Range May
Be Used)
Type of Analytical Procedure Range, at Minimum, to Be Covered
Assay (content) 80–120% of declared content
Assay (CU) 70–130% of declared content
Assay (dissolution) ±30% of specified range (for immediate release
dosage form).
If the specification for a controlled release product
(modified release or sustained release) covers
a region from 20% (after 1 hr) to 90% (after
24 hr), the validated range would cover 50% of
1-hr limit (20% × 50% = 10%) to 130% of the
label claim (label claim × 1.3).
Degradation products/impurities Reporting level to at least 120% of specification
limit.
466 METHOD VALIDATION
TABLE 9-5. Range for Recovery Experiment for CU and Assay Method to Be
Defined in Method Validation Protocol
Target Concentration Number of
of Solutions Target Concentration Amount Preparations/Number
(%) of Solutions (mg/mL) Injected (µg) of Injections
130 1.30 13.0 3/1
115 1.15 11.5 3/1
100 1.00 10.0 3/1
85 0.85 8.5 3/1
70 0.70 7.0 3/1
TABLE 9-6. Example of Actual Sample Preparation in Method Validation Protocol
Milliliters of Stock Actual Final
Target Concentration Solution Placebo Volumetric Concentration
of Solutions (2.67 mg/mL) Added Flask Used of Solution
(%) used (mL) (mg) (mL) (µg/mL)
130 12 85.1 25 1281.6
115 11 85.1 25 1174.8
100
a
10 85.1 25 1068
85 8 85.1 25 854.4
70 13 170.3 50 694.2
a
Nominal 100% level without placebo is used as a calibration standard.
TABLE 9-7. Recovery Results for Assay and Content Uniformity Method
Actual Average Actual
Concentration Concentration Average
Sample Name (µg/mL) (µg/mL) % Found % Found % Recovery
70%-Recovery–1 694.2 694.2 69.4808 69.5036 99.29
70%-Recovery–2 694.2 69.5307
70%-Recovery–3 694.2 69.4992
85%-Recovery–1 854.4 854.4 84.3520 84.5353 99.45
85%-Recovery–2 854.4 84.5062
85%-Recovery–3 854.4 84.7478
100%-Recovery–1 1068 1068 99.2699 99.1599 99.16
100%-Recovery–2 1068 99.0610
100%-Recovery–3 1068 99.1488
115%-Recovery–1 1174.8 1174.8 114.566 114.4453 99.52
115%-Recovery–2 1174.8 114.3211
115%-Recovery–3 1174.8 114.4488
130%-Recovery–1 1281.6 1281.6 128.6508 128.8411 99.11
130%-Recovery–2 1281.6 128.8216
130%-Recovery–3 1281.6 129.0509
% Average
recovery = 99.31
SD 0.18
%RSD 0.18
specification limit. Note that the reporting level can never be lower than the
limit of quantitation (LOQ) of the method. However, during early-phase val-
idation for drug products, if authentic degradation products are not available,
then low amounts of API are added (LOQ to 120% specification limit of
largest impurity) to the placebo and the recovery experiment is performed.
Once degradation products of known purity become available (isolated or
synthesized), a spiked recovery experiment should be performed. For drug
substances these may be directly spiked into the drug substance (DS), and for
the drug product (DP) these may be spiked into the DS + placebo.This spiked
experiment is conducted to determine whether a sample preparation proce-
dure is able to completely extract active and degradation products from the
sample matrix. For drug substances, a known amount of spiked impurities
(authentic samples) is added to the active pharmaceutical ingredient and the
recovery experiment is performed.The purity (A% − water − residual solvents
− inorganic impurities) of the impurity that will be spiked must be known as
well in order to calculate the actual amount added to the respective DS so that
the theoretical amount of the impurity that would be in the solution can be
determined. This is because the API may have some amounts of the same
known degradation products may already present in the API drug substance.
This must be accounted for in the calculation. Therefore, the amount of the
impurity that is present in the matrix (DS) must be known. The total of
the spiked amount of impurity and the amount of impurity that is present in
the drug substance must be used to determine the overall amount of impurity.
Also, for drug products when authentic degradation products are added to
placebo in presence of API, the purity factor of the isolated degradation
product that is spiked needs to be taken into account.
In the example shown in Table 9-8 and Table 9-9, a recovery experiment is
performed for a drug substance that has 0.2% (area percent normalization) of
ASSIGNMENT OF VALIDATION PARAMETERS 467
TABLE 9-8. Spiked Recovery Experiment
Target concentration 1 100 mg in 100 mL
of DS (mg/mL) diluent
Stock solution of 0.1001 11 mg in 100 mL
impurity A (mg/mL) diluent
Purity of impurity A 91%
Concentration Spiked %
of Spiked of DS
Impurity target
Amount DS (mg) mL Stock A mL Diluent (mg/mL) (1 mg/mL)
100 1 99 0.001001 0.1001
100 2 98 0.002002 0.2002
100 4 96 0.004004 0.4004
impurity A. The specification limit for this impurity is 0.3%, and 120% of the
specification limit is 0.36%. Therefore a recovery experiment will be pre-
formed where 0.1%, 0.2%, and 0.4% of impurity A will be spiked into the DS
in solution. A stock solution of impurity A can be made. Depending on the
desired percent of the impurity to be spiked in the DS, an aliquot of stock
solution A is added to the 100mg of the DS and then diluted to volume with
the diluent. The purity factor of impurity A must be taken into account. In the
following example, 11mg was multiplied by the 0.91 (purity factor of the impu-
rity) to give a total of 10 mg of impurity A. This spiked amount is added to the
total (known as the theoretical overall total) as shown in Table 9-9. The actual
overall is the percent of the impurity determined by HPLC analysis. Then the
percent recovery can be determined (actual overall/theoretical overall) × 100.
9.4.1.1 Filter Check. If for the drug product the sample preparation proce-
dure (recovery procedure) requires filtering the sample solution prior to the
solution being injected into an HPLC system, then a check for adsorption of
the components onto the filter membrane must be performed.The experiment
should be set up to conduct the filter step and centrifuge on the same solu-
tion. So, for the same solution (reference standard solution as well as a sample
solution), an aliquot of solution is passed through a membrane filter and col-
lected after 2, 4, 6, 8, and 10 mL. In addition, the same solution (not filtered)
is centrifuged and supernatant is collected. All solutions are then injected on
a HPLC system. Since the identical solution has gone through different paths,
the peak areas from the chromatogram should be identical (with some accept-
able variability due to injection precision of the analytical instrumentation).
If there is no change in peak areas between centrifuged and filtered solutions,
then it can be stated that the membrane for that particular filter does not cause
adsorption of the analyte(s). If the peak areas between centrifuged and fil-
tered solution are different (filtered solution shows smaller peak areas than
the centrifuged solution), then it can be stated that the membrane in that par-
ticular filter is adsorbing the analyte(s). However, sometimes an increase in
peak areas is observed as greater volumes are passed through the filter (e.g.,
2–6 mL). Therefore, the minimum volume that needs to be passed through the
filter to get constant peak areas that are comparable to the centrifuged peak
areas must be determined. If those areas are within (2.0%), then the desig-
nated amount of volume that is needed to pass through the filter before the
468 METHOD VALIDATION
TABLE 9-9. Spiked Recovery Results
Impurity A Impurity A Theoretical Actual Recovery
% in Matrix % Spiked Overall Overall Overall
0.2 0.1 0.3 0.31 103.3%
0.2 0.2 0.4 0.42 105.0%
0.2 0.4 0.6 0.59 98.3%
solution can be collected for HPLC analysis must be noted. These types of
filter experiments must be performed every time the drug product formula-
tion has changed (change in excipients and/or ratios of excipients/DS). Also,
even the same membrane filter type from different vendors can give different
results due to changes in the housing of that particular membrane filter, and
these should also be investigated.
9.4.1.2 Completeness of Extraction. For drug products containing con-
stituents that are insoluble in the extraction medium used in the analytical
procedure, it may be deemed adequate to perform a separate test for com-
pleteness of extraction (in addition to recovery experiments as described
above). The completeness of extraction can be evaluated two ways: kinetically
(over some elapsed time t) and thermodynamically (change in volume).
For time experiments, when the initial recovery experiment is completed
(when using a real drug product, not from spiked experiments), the solution
that is left over is set aside for time t (usually 24 hours at a temperature con-
dition known not to affect the inherent stability of the solution). After time t,
the solution is re-shaken by hand and then re-injected to determine assay
value.
For the volume experiment, the initial recovery experiment is repeated
using the actual drug product using an increased volume of sample solvent.
For example, if the procedure is stated to extract the content of a drug product
with 50 mL of solvent, then further experiments would dictate the use of
75 mL or 100 mL of solvent for this experiment.
A generalized procedure to evaluate both kinetic and thermodynamic
factors is provided in Table 9-10. This would require that an actual drug
product sample is extracted and analyzed as per procedure described in the
analytical method with the extraction time of t
0
and extraction volume of V
0
stated in the method. Six more experiments would be conducted such that
longer extraction times t
1
,t
2
and t
3
are used and higher extraction volumes V
1
,
V
2
, and V
3
are used. The extraction volumes employed should use the same
extraction time specified in the method (t
0
).
ASSIGNMENT OF VALIDATION PARAMETERS 469
TABLE 9-10. Generalized Procedure to Evaluate Both
Kinetic and Thermodynamic Factors
Experiment
Number Extraction Time Extraction Volume
1 t
0
V
0
2 t
1
V
0
3 t
2
V
0
4 t
3
V
0
5 t
0
V
1
6 t
0
V
2
7 t
0
V
3
By performing these two experiments (time and volume), it will show
whether the initial extraction procedure is sufficient or has any shortcomings.
If any shortcomings are observed, then a new extraction procedure must be
included in the method (i.e., longer time and/or higher amount of extraction
solvent). Most likely, for modified release drug products, time is essential
(higher recovery is observed over time). Change in volume will usually have
an impact in cases where the solubility of an API is on the edge for that par-
ticular sample preparation solvent with the excipients present in the matrix.
If this is the case, then the procedure should be modified to extract with higher
volume of sample preparation solvent.
Lastly, to really prove that the sample preparation procedure or the recov-
ery procedure is completely extracting the API and degradation products, uti-
lization of a homogenizer must be considered.
In general, homogenizers are utilized for automated sample preparation
procedures in workstations such as TPWII (Caliper Life Sciences, 68 Elm
Street, Hopkinton, MA 01748 or www.caliperls.com). Homogenizers are made
up of a stainless steel blade that rotates up to 20,000 rpm. The following
example illustrates why homogenizers play a vital role in sample preparation.
A modified release (MR) product under development gives a drug release
profile for at least 8 hours. This corresponds to the release rate of drug sub-
stance or the API from the dosage form within 8 hours at 37°C in the disso-
lution media (apparatus I as described in the United States Pharmacopoeia
(USP) 〈711〉 at 100 rpm). For example, when a sample preparation procedure
was developed for assay and degradation products for a modified release drug
product, it was determined that a sonication time of about 30 minutes with
about 4 hours of mechanical shaking provided adequate extraction efficiency
of the drug from the dosage form. In contrast, if a stand-alone homogenizer
was utilized for the same procedure for this dosage form, then the total sample
extraction time was found to be about 5 minutes with intermittent stops
required by the system software (e.g., TPWII takes about 2 to 5 seconds from
end of one pulse to the start of another pulse). The homogenizer provides the
energy needed to break the dosage form and to extract the API very efficiently
when compared to conventional sonication and mechanical shaking. The final
sample preparation procedure was finalized as follows:
Two pulses at 8000 rpm for 10 seconds each
Six pulses at 15,000 rpm for 15 seconds each
Soak/settle time for 2 minutes (to allow all particles to settle to the bottom
of the vessel, which allowed for a facile filtration step)
9.4.2 Precision
Precision provides an indication of random errors and can be broken down
into repeatability and intermediate precision. This procedure should only be
performed when the entire analytical method procedure is finalized.
470 METHOD VALIDATION
Repeatability represents the simplest situation and involves analysis of
replicates by the same analyst, generally one injection after the other. Repeat-
ability tests are mandatory for all tests delivering numerical data. Repeatabil-
ity is divided into two parts: injection repeatability and analysis repeatability
(multiple preparations) [24].
Validation of the precision of an HPLC method occurs at three stages. The
first stage is injection precision (injection repeatability) based on multiple
injections of a single preparation of a sample on a particular sample on a given
day. The set of criteria is given for area (% area normalization) methods (DS
and DP) based on %RSD of peak area. The second stage is analysis repeat-
ability where multiple preparations and multiple injections of a sample are
analyzed by the same chemist on the same day. The third stage is intermedi-
ate precision and is usually performed by different analysts, on a different
system, on a different day on the same DP or DS batch to determine the vari-
ability of the analytical test. The intermediate precision test may give indica-
tions to potential issues that may arise during method transfer. Relative
standard deviation or coefficient of variation (S
rel
or %RSD) is used to assess
if the adequate precision has been obtained.
If automation is utilized, then an intermediate precision test is required to
compare results obtained through manual testing versus automated testing (if
all solvent composition and analyte concentrations of all actives are identical
in both methods).
9.4.3 Linearity
The purpose of the test for linearity is to demonstrate that the entire analyt-
ical system (including detector and data acquisition) exhibits a linear response
and is directly proportional over the relevant concentration range for the
target concentration of the analyte. It is recommended to perform the linear-
ity of the API and related substances independently; and once linearity has
been demonstrated, another linearity could be performed containing both API
and specific related substance if necessary. For this reason, a stock solution of
each substance (API, degradation products, synthetic by-product) must be pre-
pared separately (one per solution), and a serial dilution from this stock solu-
tion must be injected into an HPLC system (constant injection volume).There
are two major reasons to perform a linearity test on each solution indepen-
dently. First, each substance may not be pure and the linearity test for each
component may become confounded. This is especially true if the active drug
substance contains the impurity that linearity is being performed on and/or if
the impurity contains the active drug substance as an impurity. Second, when
each substance is studied independently, the calculation of relative response
factor (RRF) is much easier to determine. The ranges that should be covered
for the linearity test are described in Table 9-11.
At least five concentrations within the range specified above for the
linearity test should be used. When a linearity test is needed for an assay and
ASSIGNMENT OF VALIDATION PARAMETERS 471
degradation products test, it is generally recommended that five or more con-
centrations should be utilized to cover the entire range. The focus should be
on both (a) the lower limit (LOQ to 1.0%) for the degradation products and
(b) the higher limit (80–120%) for the assay of the active. If the assay method
is also used for content uniformity, the range 80–120% should be expanded
accordingly to 70–130%.
As stated in the recovery section, if authentic degradation products or
impurities are not available, then an API may be utilized to perform the lin-
earity test at the lower concentration range (reporting level to 1.0%). In addi-
tion for drug products, if assay and degradation products are calculated from
a single 100% reference standard solution (mass percent) or area percent nor-
malization, then two independent linearity tests must be generated to demon-
strate linearity at the degradation product level as well as at the assay level.
Hence, if the 100% standard is used to quantitate the levels of degradation
products, the slopes of the low-level linearity and the high-level linearity
curves must be compared. If the criteria for agreement between the two slopes
are not met, then for quantitation of the degradation products a lower con-
centration of standard (usually between 0.5% and 5.0%) is used to calculate
the degradation products (related substances). This will be further discussed
in the next section.
Acceptability of linearity data is often judged by examining the correlation
coefficient and y-intercept of the linear regression line for the area response
versus concentration plot and residual standard deviation (standard error
compared to the calculated y-value at a certain target % level). Correlation
coefficients of >0.990 (DP) or 0.998 (DS) are generally considered as evidence
of acceptable fit of the data to the regression line. The y-intercept and %RSD
acceptance criteria for DP and DS depend on the linearity range being tested,
472 METHOD VALIDATION
TABLE 9-11. Recommended Ranges for Linearity Tests
Type of Analytical Procedure Range to be Covered
Drug Substance
Weight percent 80–120% of target concentration
Impurities LOQ or reporting level to at least 120% of
specification
Drug Product
Assay (content) 80–120% declared content
Assay (CU) 70–130% declared content
Assay (dissolution rate) ±30% of specified range
Impurities/degradation products LOQ or reporting level to at least 120% of
specification
Assay and degradation products LOQ or reporting level to 120% of assay
content [only if 100% reference standard is
utilized to calculate low level of
degradation products]
and the proposed criteria are shown in Table 9-3.Although these are very prac-
tical ways of evaluating linearity data, they are not true measures of linearity
[25, 26]. The coefficient of correlation can be subject to misinterpretation and
may give a misrepresentation of linearity, since different datasets can yield
identical regression statistics [27, 28]. The parameters, correlation coefficients,
y-intercept, and %RSD by themselves can be misleading and should not be
used without a visual examination of the response versus concentration plot
[29]. A more statistically sound approach to examine linearity would include
examining the residuals from a linear regression. The residuals are the dis-
tances of the experimental points from the fitted regression line, measured in
a direction parallel to the response axis. Analysis of the residuals provides
further support that the calibration curve would be deemed linear if the resid-
ual response shows a normal distribution with a zero mean [30]. Although
correlation coefficients of the linear regression can be >0.99, the plots of the
response factor versus the concentration can shed light if there are any appar-
ent deviations from linearity.A slope close to zero (response factor versus con-
centration) would indicate that a linear response is obtained over the specified
concentration range. An additional acceptance criterion that could be consid-
ered is that the response factor will show %RSD of ≤2.0% across all concen-
tration levels between 80% and 120% of the target concentration (assay).
Also, this %RSD acceptance criterion could be applied to the low-level lin-
earity regions such that the response factor will show %RSD of ≤10% across
all concentration levels between LOQ to 120% of impurity specification level.
Additionally, this comparison of the response factor can be used to help justify
the LOQ above and beyond the typical S/N >10, injection precision require-
ments, and low-level linearity requirements.A simple test would be to compare
the response factor difference between the proposed LOQ and the 5× LOQ
value concentration and also to compare the response factor difference
between the proposed LOQ and the maximum concentration tested in the
low-level linearity experiment. Both of these percent difference values should
show ≤10% difference to provide additional support for qualifying the pro-
posed LOQ as the official LOQ for the method.
9.4.3.1 Linearity Example (Assay and Content Uniformity). An example
for linearity for Assay and Content Uniformity is given. The target concen-
tration is 1.0 mg/mL for this particular drug substance D. Table 9-12 shows the
table that could be included in a method validation protocol stating the con-
centrations that will be tested from 50–130% of the target concentration. The
sample preparation procedure is indicated in Table 9-13. The linearity results
and the relative response factors at each concentration are shown in Table
9-14. The response factor is calculated by peak area divided by concentration
at each concentration level. A typical graph for linearity is obtained such that
the concentration is plotted on the x axis and the area counts are plotted on
the y axis Figure 9-1. The %RSD of 0.51% for the calculated response factors
at all concentrations is reported in Table 9-14. In general, %RSD should be
ASSIGNMENT OF VALIDATION PARAMETERS 473