Tài liệu Web Application Design Patterns- P8 pdf
Bạn đang xem bản rút gọn của tài liệu. Xem và tải ngay bản đầy đủ của tài liệu tại đây (3.05 MB, 30 trang )
CHAPTER 7 Lists
196
Solution
Use a calendar-like format to present items. In addition, consider showing items
in a list view as well and allow users to switch between them ( Figure 7.23 ).
Why
Users generally know how to interact with calendars because of their familiar-
ity with desktop applications such as Outlook, Entourage, iCal, and so forth.
In addition, using a calendar view makes it easy for users to see scheduled
events and helps them with planning because they can clearly see available and
busy time slots.
How
Show users a calendar with an appropriate default view — for example, cal-
endars for personal or business use typically show a weekly view by default.
However, allow them to change it to a different view per their preference
( Figure 7.24 ).
(a)
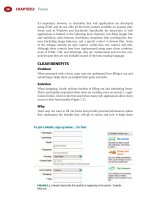
FIGURE 7.23
When users click “ Calendar, ” Clemson University’s web site shows users a
monthly events view by default (a) and allows them to switch to a weekly view or a daily view
(b). In all views, users may navigate to another month or day using the calendar control or
“ previous ” and “ next ” pagination controls.
(b)
197
When using a calendar control for navigation, highlight days with one or more
scheduled events to prevent unnecessary navigation ( Figure 7.25 ).
ALLOW USERS TO SWITCH BETWEEN CALENDAR AND
LIST VIEWS
Although events are typically shown in calendars because users may want to
print the events list for reference, offer users both a list view and a calendar
view ( Figure 7.26 ). In the list view, order events chronologically.
Event List
(a)
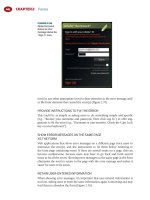
FIGURE 7.24
Google Calendar shows users a weekly view by default (a), but allows them to
change it on the “ Settings ” page (b).
(b)
FIGURE 7.25
Yahoo! Calendar highlights dates with entries by making them bold.
CHAPTER 7 Lists
198
If event information includes both location and schedule information, con-
sider showing users a location view as well. Although locations are often effec-
tive as maps (see the MAPS pattern later in this chapter), a list view may be
more suitable if many events are scheduled for the same location, which may
appear cluttered on maps ( Figure 7.27 ).
ALLOW USERS TO SEARCH CALENDAR ENTRIES
When the total number of events is too large to be reasonably shown in a cal-
endar view, allow users to search calendar entries ( Figure 7.28 ).
RELATED DESIGN PATTERNS
When showing events in a list format, instead of a calendar format, use either
the SIMPLE LIST or TABULAR LIST pattern depending on the number of attri-
butes that need to be shown to users. In addition, use the SEARCH RESULTS
pattern (see Chapter 6) when showing the results of event searches.
TIMELINES
Problem
Users need to be presented with time-based historical information (hours/min-
utes in a day, days of the week, months, years, etc.) to enable them to see trends
and/or the evolution of an event.
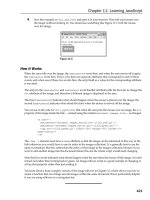
(a)
FIGURE 7.26
Pepsi Center shows scheduled sporting events in both (a) calendar view and (b)
list view.
(b)
199
Solution
Show historical information as a timeline ( Figure 7.29 ).
Why
Timelines are appropriate for presenting time-based data because they allow
users to see relationships between events and facilitate comparison. They can
also help users see the historical context or rationale, if any, for the current state.
Timelines
(a)
FIGURE 7.27
Agile University shows the course calendar using lists (a) but allows users to
view them by months as well as regions (b).
(b)
FIGURE 7.28
SanDiego.org
allows users to
search by date
range, event type,
and keywords.
CHAPTER 7 Lists
200
How
Show time along the horizontal axis and the data or event information along
the vertical axis. When available screen real estate is limited, allow users to
scroll or pan the timeline ( Figure 7.30 ) or compress the timeline and allow
them to zoom in and out as desired ( Figure 7.31 ).
ALLOW USERS TO ACCESS EVENT DETAILS
Because a lot of information may be compressed in a small area, it may be
diffi cult to show details on a timeline. Therefore, allow users to hover over
or click on an event (or a data point) in the timeline to view its details
( Figure 7.32 ).
FIGURE 7.29
National Geographic uses a timeline to help users navigate space travel content.
The design also incorporates a CAROUSEL pattern (see Chapter 8) to allow users to navigate the
timeline.
FIGURE 7.30
This example from the SIMILE Timeline project from MIT shows dinosaurs along
the geological scale. Users can pan the timeline by dragging horizontally and access information
not visible in the available viewport.
201
Timelines
FIGURE 7.31
Google Finance shows historical stock price information in two separate
timelines, making the most of limited screen real estate. The timeline in the bottom frame
(shown in gray) is the entire timeline for which the stock price was available. The timeline in the
top frame shows details of the selected timeline segment. Users can select a timeline segment
they want to view by manipulating the slider in the bottom frame.
FIGURE 7.32
In this “ Rise of Life ” timeline from National Geographic , users can click on an
event in the timeline to view its details in the bottom pane.
CHAPTER 7 Lists
202
Related design patterns
Large TIMELINES that don’t fi t within the available screen space often incor-
porate the OVERVIEW-PLUS-DETAIL pattern (see Chapter 8) to allow users to
zoom in and out to view details.
IMAGE LISTS/GRIDS
Problem
Items presented to users are visual in nature, and presenting them using only
their textual description may make it diffi cult for users to recognize and locate
desired items. In addition, users may be able to recognize an item by its image
but may be unfamiliar with the item’s name.
Solution
Show users items as image grids or image lists rather than a textual list.
However, complement images with a textual description ( Figure 7.33 ).
Why
A picture is worth a thousand words. – A proverb
Humans are able to recognize and recall images better than words (Paivio
et al., 1968). Therefore, when showing multimedia content, such as photos,
movies, music, and so forth, it’s easier for users to scan and fi nd the desired
item when all items are presented as images rather than just in a textual list.
The advantage of images over textual information — commonly referred to as
Picture Superiority Effect (Lidwell et al., 2003) — is particularly evident in sit-
uations where users may have been casually exposed to the image before or
know what the “ prototypical ” image they are searching for looks like. For
example, if users are looking for a photo, an artist, an album, or a video that
they have seen before or remember one or more elements of, it’d be faster for
them to fi nd it using images rather than text. Because memory for images and
text together is generally better than text or images by themselves, consider
FIGURE 7.33
Last.fm shows top videos as an image grid and includes brief textual
information about the videos.
203
complementing images with textual description (Childers and Houston, 1984;
Paivio et al., 1968).
In the early days of the Web, bandwidth was a limiting factor, and the focus
was on sharing textual information. With broadband becoming commonplace,
user interaction is changing, as users are not only viewing and uploading pho-
tos, music, and videos, but also sharing them. This has made the use of image
lists quite commonplace.
How
Facilitate the quick scanning of items by showing item thumbnails in an
image grid. Like other lists, consider providing users with necessary list pagi-
nation, sorting, and fi ltering options ( Figure 7.34 ; see also the PAGINATION,
SORTING, and FILTERING patterns in Chapter 6).
When space is limited, image lists may be implemented using the CAROUSEL
pattern, where users are shown fewer items at a time, but they can use naviga-
tion controls to view images hidden from their view ( Figure 7.35 ; see also the
CAROUSEL pattern in Chapter 8).
SHOW USERS A PREVIEW OF THE IMAGES
When thumbnails are used to represent actual images, consider showing users
a preview of the larger image on hover to minimize unnecessary navigation
( Figure 7.36 ).
Image Lists/Grids
FIGURE 7.34
Fotolia offers users several options to fi lter the image list, including by
categories, image orientation, fi le type, and so forth.
CHAPTER 7 Lists
204
Image previews can also be integrated when an image list is part of a slide-
show. Although the detailed image does not require navigating to another
page, showing a preview makes it easy for users to distinguish between similar
images, especially when thumbnails are relatively small in size ( Figure 7.37 ).
EXPLORE USING AN IMAGE LIST AS AN ALTERNATIVE
FOR OTHER LISTS
Increasingly, interaction with the Web is becoming visual. The assumption is
that users would be more effi cient and effective in their interaction if they can
FIGURE 7.35
Yahoo! TV uses a carousel for its image lists.
FIGURE 7.36
iStockphoto shows users image (or video) previews in a hover style.
205
view (or preview) content before navigating. Newer search engines have started
exploring use of images to show search results ( Figures 7.38 and 7.39 ).
Related design patterns
Unlike lists, especially tabular lists, which can be quite compact, IMAGE LISTS/
GRIDS usually require more space. When screen space is limited, consider
using the CAROUSEL pattern to accommodate more items (see Chapter 8).
Image Lists/Grids
FIGURE 7.37
This
example from Vertigo
SlideShow illustrates
a thumbnail gallery
to navigate images. It
also provides image
previews when users
hover over a thumbnail.
FIGURE 7.38
SearchMe shows
search results
primarily as a series
of thumbnails of web
pages that users can
fl ip through to fi nd
the desired page. In
addition, if they had
previously accessed
a useful one (or not
useful enough), it’s
easier to visually
recognize it when they
see the image rather
than just its title.
FIGURE 7.39
Viewzi, a search engine, groups results in several categories and uses various
types of image lists for different search result groups; the shopping view is shown here.
CHAPTER 7 Lists
206
MAPS
Problem
Items to be presented to users contain spatial information that refers to either
geographical (e.g., location of restaurants on a map) or physical locations (e.g.,
seating in an aircraft, a concert hall, or a stadium). In addition, for users, it’s
important to know the item’s location in a geographical or physical space as
well as its relation to other items in the same space.
Solution
Show items on either the map of a region or space in question ( Figure 7.40 ).
(a)
FIGURE 7.40
Roost shows location of homes on a map (a), and United Airlines allows users to
choose their seat by showing a seating map (b).
(b)
207
Why
Because users are presented with spatial information, showing them on a map
of the physical space eliminates the need for users to visualize its location. It
also makes information more meaningful and relevant to user goals, such as
fi nding a location, navigating to and from a location, and relating data to the
targeted region.
How
Maps are typically used as a background image on which geographical, physi-
cal, and statistical information are superimposed. Depending on users ’ needs,
maps may be represented as illustrations (using points, lines, and polygons),
photographic or satellite images, text, or a combination ( Figure 7.41 ).
SHOW DETAILED INFORMATION ON DEMAND
When showing several locations on a map, providing details of all of them at
the same time could clutter the map and may make it diffi cult for users to parse
relevant information. In addition, users may be interested in seeing details
of only a few locations. To minimize complexity, a common approach is to
provide users necessary details when they hover over or click on map markers.
Detailed information can then be presented as hovertips or pop-ups.
Hovertips are typically used when details are not extensive, are purely
informational in nature, and do not require users to take an action on the
presented information, whereas pop-ups are used when users can take actions
such as fi nd directions ( Figure 7.42 ). Another alternative is to show the
pop-up after a few seconds ’ delay to support relatively new users who may not
know what actions are available on the map markers (e.g., Microsoft’s Live
Maps).
FOR LARGE MAPS, PROVIDE USERS CONTEXT
BY SHOWING OVERVIEWS
When panning and zooming large maps, it is important that users do not feel
lost and are able to maintain their sense of location. Overviews within the map
help provide such context ( Figure 7.43 ). Most map overviews support panning
within them, allowing users to move the “ region ” box inside the overview, thus
affecting the map being viewed.
Some map overviews support zooming as well. However, using overviews for
panning and zooming is generally not as effi cient as panning and zooming on
the main map (Hornb æ k et al., 2002) (see also the OVERVIEW-PLUS-DETAIL
pattern in Chapter 8).
Maps