princ ch24 presentation
Bạn đang xem bản rút gọn của tài liệu. Xem và tải ngay bản đầy đủ của tài liệu tại đây (2.16 MB, 32 trang )
CHAPTE
R
24
Measuring the Cost of
Living
Economics
N. Gregory
PRINCIPLES OF
Mankiw
Premium PowerPoint Slides
by Ron Cronovich
© 2009 South-Western, a part of Cengage Learning, all rights reserved
In this chapter,
look for the answers to these
questions:
What is the Consumer Price Index (CPI)?
How is it calculated? What’s it used for?
What are the problems with the CPI? How serious
are they?
How does the CPI differ from the GDP deflator?
How can we use the CPI to compare dollar
amounts from different years? Why would we want
to do this, anyway?
How can we correct interest rates for inflation?
2
The Consumer Price Index
(CPI)
measures the typical consumer’s cost of living
the basis of cost of living adjustments (COLAs) in
many contracts and in Social Security
MEASURING THE COST OF LIVING
3
How the CPI Is Calculated
1. Fix the “basket.”
The Bureau of Labor Statistics (BLS) surveys
consumers to determine what’s in the typical
consumer’s “shopping basket.”
2. Find the prices.
The BLS collects data on the prices of all the
goods in the basket.
3. Compute the basket’s cost.
Use the prices to compute the total cost of the
basket.
MEASURING THE COST OF LIVING
4
How the CPI Is Calculated
4. Choose a base year and compute the index.
The CPI in any year equals
cost of basket in current year
100 x
cost of basket in base year
5. Compute the inflation rate.
The percentage change in the CPI from the
preceding period.
Inflation
=
rate
CPI this year – CPI last year
x 100%
CPI last year
MEASURING THE COST OF LIVING
5
EXAMPLE
basket: {4 pizzas, 10 lattes}
year
price of
pizza
price of
latte
2007
$10
$2.00
$10 x 4 + $2 x 10
2008
$11
$2.50
$11 x 4 + $2.5 x 10 = $69
2009
$12
$3.00
$12 x 4 + $3 x 10
cost of basket
= $60
= $78
Compute CPI in each year usingInflation
2007 base
rate:year:
2007: 100 x ($60/$60) = 100
2008: 100 x ($69/$60) = 115
2009: 100 x ($78/$60) = 130
115 – 100
x 100%
100
130 – 115
x 100%
13% =
115
15% =
MEASURING THE COST OF LIVING
6
ACTIVE LEARNING
1
Calculate the CPI
price price of
of beef chicken
CPI basket:
{10 lbs beef,
20 lbs chicken}
2004
$4
$4
The CPI basket cost $120
in 2004, the base year.
2005
$5
$5
2006
$9
$6
A. Compute the CPI in 2005.
B. What was the CPI inflation rate from 2005-2006?
7
ACTIVE LEARNING
1
Answers
price price of
of beef chicken
CPI basket:
{10 lbs beef,
20 lbs chicken}
2004
$4
$4
The CPI basket cost $120
in 2004, the base year.
2005
$5
$5
2006
$9
$6
A. Compute the CPI in 2005:
Cost of CPI basket in 2005
= ($5 x 10) + ($5 x 20) = $150
CPI in 2005 = 100 x ($150/$120) = 125
8
ACTIVE LEARNING
1
Answers
price price of
of beef chicken
CPI basket:
{10 lbs beef,
20 lbs chicken}
2004
$4
$4
The CPI basket cost $120
in 2004, the base year.
2005
$5
$5
2006
$9
$6
B. What was the inflation rate from 2005-2006?
Cost of CPI basket in 2006
= ($9 x 10) + ($6 x 20) = $210
CPI in 2006 = 100 x ($210/$120) = 175
CPI inflation rate = (175 – 125)/125 = 40%
9
What’s in the CPI’s Basket?
MEASURING THE COST OF LIVING
10
ACTIVE LEARNING
2
Substitution bias
CPI basket:
{10# beef,
20# chicken}
2004-5:
Households
bought CPI basket.
cost of CPI
beef chicken
basket
2004
$4
$4
$120
2005
$5
$5
$150
2006
$9
$6
$210
2006: Households bought {5 lbs beef, 25 lbs chicken}.
A. Compute cost of the 2006 household basket.
B. Compute % increase in cost of household basket
over 2005-6, compare to CPI inflation rate.
11
ACTIVE LEARNING
2
Answers
CPI basket:
{10# beef,
20# chicken}
Household
basket in 2006:
{5# beef,
25# chicken}
cost of CPI
beef chicken
basket
2004
$4
$4
$120
2005
$5
$5
$150
2006
$9
$6
$210
A. Compute cost of the 2006 household basket.
($9 x 5) + ($6 x 25) = $195
12
ACTIVE LEARNING
2
Answers
CPI basket:
{10# beef,
20# chicken}
Household
basket in 2006:
{5# beef,
25# chicken}
cost of CPI
beef chicken
basket
2004
$4
$4
$120
2005
$5
$5
$150
2006
$9
$6
$210
B. Compute % increase in cost of household basket
over 2005-6, compare to CPI inflation rate.
Rate of increase: ($195 – $150)/$150 = 30%
CPI inflation rate from previous problem = 40%
13
Problems with the CPI:
Substitution Bias
Over time, some prices rise faster than others.
Consumers substitute toward goods that become
relatively cheaper.
The CPI misses this substitution because it uses
a fixed basket of goods.
Thus, the CPI overstates increases in the cost of
living.
MEASURING THE COST OF LIVING
14
Problems with the CPI:
Introduction of New Goods
The introduction of new goods increases variety,
allows consumers to find products that more
closely meet their needs.
In effect, dollars become more valuable.
The CPI misses this effect because it uses a
fixed basket of goods.
Thus, the CPI overstates increases in the cost of
living.
MEASURING THE COST OF LIVING
15
Problems with the CPI:
Unmeasured Quality Change
Improvements in the quality of goods in the
basket increase the value of each dollar.
The BLS tries to account for quality changes
but probably misses some, as quality is hard to
measure.
Thus, the CPI overstates increases in the cost of
living.
MEASURING THE COST OF LIVING
16
Problems with the CPI
Each of these problems causes the CPI to
overstate cost of living increases.
The BLS has made technical adjustments,
but the CPI probably still overstates inflation
by about 0.5 percent per year.
This is important because Social Security
payments and many contracts have COLAs tied
to the CPI.
MEASURING THE COST OF LIVING
17
Two Measures of Inflation, 19502007
MEASURING THE COST OF LIVING
18
Contrasting the CPI and GDP
Deflator
Imported
Imported consumer
consumer goods:
goods:
included
included in
in CPI
CPI
excluded
excluded from
from GDP
GDPdeflator
deflator
Capital
Capital goods:
goods:
excluded
excluded from
from CPI
CPI
included
included in
in GDP
GDPdeflator
deflator
(if
(if produced
produced domestically)
domestically)
The
The basket:
basket:
CPI
CPI uses
uses fixed
fixed basket
basket
GDP
GDPdeflator
deflator uses
uses basket
basket of
of
currently
currently produced
produced goods
goods && services
services
This
This matters
matters ifif different
different prices
prices are
are
changing
changing by
by different
different amounts.
amounts.
MEASURING THE COST OF LIVING
19
ACTIVE LEARNING 3
CPI vs. GDP deflator
In each scenario, determine the effects on the
CPI and the GDP deflator.
A. Starbucks raises the price of Frappuccinos.
B. Caterpillar raises the price of the industrial
tractors it manufactures at its Illinois factory.
C. Armani raises the price of the Italian jeans it
sells in the U.S.
20
ACTIVE LEARNING 3
Answers
A. Starbucks raises the price of Frappuccinos.
The CPI and GDP deflator both rise.
B. Caterpillar raises the price of the industrial
tractors it manufactures at its Illinois factory.
The GDP deflator rises, the CPI does not.
C. Armani raises the price of the Italian jeans it
sells in the U.S.
The CPI rises, the GDP deflator does not.
21
Correcting Variables for Inflation:
Comparing Dollar Figures from Different
Times
Inflation makes it harder to compare dollar
amounts from different times.
Example: the minimum wage
$1.15 in Dec 1964
$5.85 in Dec 2007
Did min wage have more purchasing power in
Dec 1964 or Dec 2007?
To compare, use CPI to convert 1964 figure into
“today’s dollars”…
MEASURING THE COST OF LIVING
22
Correcting Variables for Inflation:
Comparing Dollar Figures from Different
Times
Amount
in today’s =
dollars
Amount
in year T
dollars
x
Price level today
Price level in year T
In our example,
year T = 12/1964, “today” = 12/2007
Min wage = $1.15 in year T
CPI = 31.3 in year T, CPI = 211.7 today
The minimum wage
in 1964 was $7.78
in today’s (2007) dollars.
$7.78 = $1.15 x
211.7
31.3
MEASURING THE COST OF LIVING
23
Correcting Variables for Inflation:
Comparing Dollar Figures from Different
Times
Researchers, business analysts and policymakers
often use this technique to convert a time series of
current-dollar (nominal) figures into constant-dollar
(real) figures.
They can then see how a variable has changed
over time after correcting for inflation.
Example: the minimum wage, from Jan 1950 to
Dec 2007…
MEASURING THE COST OF LIVING
24
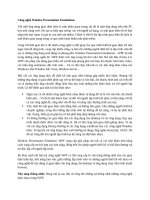
$ per hour
The U.S. Minimum Wage in Current
Dollars
and
Today’s
Dollars,
1950-2007
$9
$8
2007 dollars
$7
$6
$5
$4
$3
$2
current dollars
$1
$0
1950 1955 1960 1965 1970 1975 1980 1985 1990 1995 2000 2005