princ ch25 presentation
Bạn đang xem bản rút gọn của tài liệu. Xem và tải ngay bản đầy đủ của tài liệu tại đây (1.14 MB, 47 trang )
CHAPTE
R
25
Production and Growth
Economics
N. Gregory
PRINCIPLES OF
Mankiw
Premium PowerPoint Slides
by Ron Cronovich
© 2009 South-Western, a part of Cengage Learning, all rights reserved
In this chapter,
look for the answers to these
questions:
What are the facts about living standards and
growth rates around the world?
Why does productivity matter for living standards?
What determines productivity and its growth rate?
How can public policy affect growth and living
standards?
2
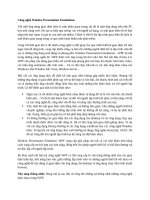
A typical family with all their possessions
in the U.K., an advanced economy
GDP per capita:
Life expectancy:
Adult literacy:
$35,580
79 years
99%
A typical family with all their possessions
in Mexico, a middle income country
GDP per capita:
Life expectancy:
Adult literacy:
$11,410
76 years
92%
A typical family with all their
possessions in Mali, a poor country
GDP per capita:
Life expectancy:
Adult literacy:
$1,130
50 years
46%
Incomes
and
Growth
Around
the World
China
Singapore
Japan
Spain
FACT 1:
India
Israel
There are
United States
vast
Canada
differences
Colombia
in living
New Zealand
standards
Philippines
Argentina
around the
Saudi Arabia
world.
Rwanda
Haiti
PRODUCTION AND GROWTH
GDP per
Growth rate,
capita, 2005 1960-2005
$6,572
29,921
30,821
26,125
3,486
25,670
41,854
32,886
7,769
22,511
4,920
14,421
14,729
1,333
1,836
5.8%
5.4%
3.8%
3.2%
2.7%
2.7%
2.2%
2.1%
1.8%
1.4%
1.4%
1.0%
0.8%
0.3%
–1.2% 6
Incomes
and
Growth
Around
the World
China
Singapore
Japan
Spain
FACT 2:
India
Israel
There is
United States
also great
Canada
variation
Colombia
in growth
New Zealand
rates across
Philippines
Argentina
countries.
Saudi Arabia
Rwanda
Haiti
PRODUCTION AND GROWTH
GDP per
Growth rate,
capita, 2005 1960-2005
$6,572
29,921
30,821
26,125
3,486
25,670
41,854
32,886
7,769
22,511
4,920
14,421
14,729
1,333
1,836
5.8%
5.4%
3.8%
3.2%
2.7%
2.7%
2.2%
2.1%
1.8%
1.4%
1.4%
1.0%
0.8%
0.3%
–1.2% 7
Incomes and Growth Around the
World
Since growth rates vary, the country rankings can
change over time:
Poor countries are not necessarily doomed to
poverty forever – e.g., Singapore, incomes were
low in 1960 and are quite high now.
Rich countries can’t take their status for granted:
They may be overtaken by poorer but
faster-growing countries.
PRODUCTION AND GROWTH
8
Incomes and Growth Around the
World
Questions:
Why are some countries richer than others?
Why do some countries grow quickly while others
seem stuck in a poverty trap?
What policies may help raise growth rates and
long-run living standards?
PRODUCTION AND GROWTH
9
Productivity
Recall one of the Ten Principles from Chap. 1:
A country’s standard of living depends
on its ability to produce g&s.
This ability depends on
productivity, the average quantity of g&s
produced per unit of labor input.
Y = real GDP = quantity of output produced
L = quantity of labor
so productivity = Y/L (output per worker)
PRODUCTION AND GROWTH
10
Why Productivity Is So
Important
When a nation’s workers are very productive,
real GDP is large and incomes are high.
When productivity grows rapidly, so do living
standards.
What, then, determines productivity and its
growth rate?
PRODUCTION AND GROWTH
11
Physical Capital Per Worker
Recall: The stock of equipment and structures
used to produce g&s is called [physical] capital,
denoted K.
K/L = capital per worker.
Productivity is higher when the average worker
has more capital (machines, equipment, etc.).
i.e.,
an increase in K/L causes an increase in Y/L.
PRODUCTION AND GROWTH
12
Human Capital Per Worker
Human capital (H):
the knowledge and skills workers acquire through
education, training, and experience
H/L = the average worker’s human capital
Productivity is higher when the average worker
has more human capital (education, skills, etc.).
i.e.,
an increase in H/L causes an increase in Y/L.
PRODUCTION AND GROWTH
13
Natural Resources Per Worker
Natural resources (N): the inputs into production
that nature provides, e.g., land, mineral deposits
Other things equal,
more N allows a country to produce more Y.
In per-worker terms,
an increase in N/L causes an increase in Y/L.
Some countries are rich because they have
abundant natural resources
(e.g., Saudi Arabia has lots of oil).
But countries need not have much N to be rich
(e.g., Japan imports the N it needs).
PRODUCTION AND GROWTH
14
Technological Knowledge
Technological knowledge: society’s
understanding of the best ways to produce g&s
Technological progress does not only mean
a faster computer, a higher-definition TV,
or a smaller cell phone.
It means any advance in knowledge that boosts
productivity (allows society to get more output
from its resources).
E.g., Henry Ford and the assembly line.
PRODUCTION AND GROWTH
15
Tech. Knowledge vs. Human
Capital
Technological knowledge refers to society’s
understanding of how to produce g&s.
Human capital results from the effort people
expend to acquire this knowledge.
Both are important for productivity.
PRODUCTION AND GROWTH
16
The Production Function
The production function is a graph or equation
showing the relation between output and inputs:
Y = A F(L, K, H, N)
F( ) – a function that shows how inputs are
combined to produce output
“A” – the level of technology
“A” multiplies the function F( ),
so improvements in technology (increases in “A”)
allow more output (Y) to be produced from any
given combination of inputs.
PRODUCTION AND GROWTH
17
The Production Function
Y = A F(L, K, H, N)
The production function has the property
constant returns to scale: Changing all inputs
by the same percentage causes output to change
by that percentage. For example,
Doubling all inputs (multiplying each by 2)
causes output to double:
2Y = A F(2L, 2K, 2H, 2N)
Increasing all inputs 10% (multiplying each by 1.1)
causes output to increase by 10%:
1.1Y = A F(1.1L, 1.1K, 1.1H, 1.1N)
PRODUCTION AND GROWTH
18
The Production Function
Y = A F(L, K, H, N)
If we multiply each input by 1/L, then
output is multiplied by 1/L:
Y/L = A F(1, K/L, H/L, N/L)
This equation shows that productivity
(output per worker) depends on:
the level of technology (A)
physical capital per worker
human capital per worker
natural resources per worker
PRODUCTION AND GROWTH
19
ACTIVE LEARNING 1
Discussion Question
Which of the following policies do you think would
be most effective at boosting growth and living
standards in a poor country over the long run?
a. Offer tax incentives for investment by local firms
b.
”
”
”
”
”
by foreign firms
c. Give cash payments for good school attendance
d. Crack down on govt corruption
e. Restrict imports to protect domestic industries
f. Allow free trade
g. Give away condoms
20
ECONOMIC GROWTH
AND PUBLIC POLICY
Next,
Next, we
we look
look at
at the
the ways
ways
public
public policy
policy can
can affect
affect
long-run
long-run growth
growth in
in productivity
productivity
and
and living
living standards.
standards.
PRODUCTION AND GROWTH
21
Saving and Investment
We can boost productivity by increasing K,
which requires investment.
Since resources scarce, producing more capital
requires producing fewer consumption goods.
Reducing consumption = increasing saving.
This extra saving funds the production of
investment goods. (More details in the next chapter.)
Hence, a tradeoff between current and future
consumption.
PRODUCTION AND GROWTH
22
Diminishing Returns and the Catch-Up
Effect
The govt can implement policies that raise saving
and investment. (Details in next chapter.)
Then K will rise, causing productivity and living
standards to rise.
But this faster growth is temporary,
due to diminishing returns to capital:
As K rises, the extra output from an additional
unit of K falls….
PRODUCTION AND GROWTH
23
The Production Function & Diminishing
Returns
If workers
Output per
have little
K,
worker
giving
them more
(productivity)
increases their
productivity a lot.
If workers already
have a lot of K,
giving them more
increases
productivity
fairly little.
PRODUCTION AND GROWTH
Y/L
K/L
Capital per worker
24
The catch-up
the property whereby poor
effect:
countries
tend to grow more rapidly than rich ones
Y/L
Rich country’s
growth
Poor country’s
growth
Poor country
starts here
PRODUCTION AND GROWTH
K/L
Rich country starts here
25