Tài liệu Bản báo cáo cùa World Bank về tình hình Đông Nam Á tháng 4 năm 2008 ppt
Bạn đang xem bản rút gọn của tài liệu. Xem và tải ngay bản đầy đủ của tài liệu tại đây (954.31 KB, 83 trang )
p
eap
p
up
dat
e
East Asia:
Testing Times Ahead
East Asia & Pacific Update April 2008
Contents
ExecutiveSummary……………………………………………………………………………………………………………………… 1
Introduction………………………………………………………………………………………………………………………………… 5
Globalfinancialturmoil……………………………………….……………………………………….……………………………… 7
EastAsiandevelopments...acaseforguardedoptimism?……………………………………….………………… 11
Stronggro wthmoment umundercloudedskies……………………………………….………………………… 11
Financialli nkages:USturmoilaffectsEastAsiansecuritiesmarkets,notsomuchbanks……… 13
Tradelinkages:WeakeningUSdemandoffsetbyothermarkets––sofar……………………………… 18
Volatilecommo ditypricesnowatthefor efrontofpolicymakersattention………………………… 22
EastAsianOutlook……………………………………….……………………………………….…………………………………… 29
CountrySections……………………………………….……………………………………….……………………………………… 33
AppendixTables……………………………………….……………………………………….………………………………………… 53
KeyIn dicatorsTables……………………………………….……………………………………….…………………………………. 67
ThisRegionalUpdatewaspreparedbyMilanBr ahmbhatt,
LeadEco nomist,EastAsiaPREM,withthe
assistance ofAntonioOll ero,AlessandroMagnoli,,Cyru sTalatiandSung‐sooEun,drawingonin putsand
commentsfromcountryeco nomis tsandsectorspecialist st hrougho uttheEastAsiaandPacificRegionof
theWorldBank.Thereportwaspreparedunderthegeneralguidanceof
VikramNehr u,ActingChief
Economist,andJamesAdams,RegionalVicePresident,EastAsiaandPacificRegion.
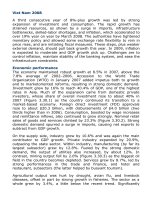
Executive Summary
ast year Developi ng East Asia re corded its high est growth rate in over a decade (10.2
percent),cappingadecadeofimprovementsfollowingitshome‐grownfinancialcrisisin
1998.
1
Yetthis is hardlya timeforcel ebratio n,butrather one fo rc o ncer n.The global
economy is once again facing a testing time, with soaring fuel and food prices, on th e one
hand, and, on the other, an unfolding sub‐prime crisis emanating in the Unite d States and
spreading to
other countries and ass et classes, bringing in its wake a plunging doll ar and a
slowdowninglob altradeandgr owth.
AlthoughEast Asi awill undoubtedlybeaf fected, itis reasonably well positione dtonavigate
thiscrisiswi thoutincurringsignificantdamagetoitsprospects.True,muchde pe nds onhow
the crisis un fol ds,
and of course, some countries in th e region will be a ffected more tha n
others.But,broadlyspeaking,the region’sinvestmentinsoundmacroeconomicpoliciesand
structuralreformsov erthelastdecadehasadd edeconomicresili enceandflexibilitythatwill
helpdealwiththesechallengesoverthenex tyearortwo.
Foreignex changereservesareatall
time highs, non‐performi ng loans of banks have been steadily lo wered, exte rnal and pub lic
debtburdensareataccep table levels,mostgov er nmentshave unusedfis calspace,thereal
economy has momentum, and diversification of trade and financial flows provides some
flexibilityinadjustingtothe
impendi ngglobalslowdown.
Yetthechallengesahead should notbe un derestimated.Thecrisi sinthe UnitedStates has
deepened as asset prices struggle to find a new equilibrium and financial institutions go
throughapai nfulpr o cessofde ‐leveraging and recapitalization.Further surprisescan not be
ruledout.Previousex pe riencesof
reales tat epricebu stssuggestthe ycanlasttwiceas long
andtwiceas deepasequi t ypri cebu sts.Andthisisalso the firstfi nanci alcris isinthepost ‐
securitized world, in which most intermediation is done through securities markets not
depositar yinstitutions— which means itco uldtakeeven
longerto resolv e.Fortun ately,the
authoritiesoftheaffe ctedco u ntrieshave responded speedilytothecrisis ,loweri nginterest
ratesaggressively,providingfiscalstimulus,andusinginnovativeapproachestoinjectliquidity
and rescue failing financial institutions.But even if these interventions help stabilize the
financial system and prevent a downward spiral
in asset prices and asset values on balance
sheets, th e impact of the financial turmoil on glob al growth, trade, and financial fl ows will
1
DevelopingEastAsiacomprisesalllowandmiddleincomeeconomiesinEastAsia,includingChina,
Indonesia,Malaysia,Philippines,Thailand,Vietnamandanumberofsmallereconomiesincluding
PacificIslandeconomies.EmergingEastAsiareferstoDevelopingEastAsiaplusfourNewly
IndustrializedEconomiesorNIEs(HongKong,Korea,Singaporeand
Taiwan,China).
L
2
East Asia: Testing Times Ahead
undoubtedly be adverse, although the magnitude of the impending effects remains hi ghl y
uncertain.
This heightened uncertainty makes forecasting the impact on Eas t Asia a particularly
challengingtaskatthistime.Thelatestdatafromtheregionindicatesthatthemomentumof
output and trade remains strong, but this is hardly
surprising.The impact of a slowing US
economywill ta ketimetofeedthro ughtradingandfinancialchannelsand itsfullforcemay
onlybefeltinthesecondhalfofthisyear.Yeteveninthefirstcoup leofmo nths of2008,data
indicate adjustments in trade patterns that are
suggestive of emerging trends that may
become more evident with ti me.For exam ple , export growth is shifting from the United
Statestoothermarketsinindustrialanddevelopingcountries,encouragedbythede preci atin g
dollarandbycontinuedstrongmomentuminthedevelopingworld(includingEastAsiaitself),
aswell as
inEu rop e.
In addition, the underlying trend in East Asia’sgr owthhas long been much higher than the
trend in industrial country growth, even as East Asian cycles around that tre nd have often
been correlated with cycles in industrial coun tries, and ma y become more so as the re gion
continuestointegrate
withtheworldeconomy.Theregion’sstronglongrungrowthtrendis
not dr iven by year to year fluctuations in worl d demand, but, rather, by improvements in
productivity, innovation, quality control, education and skills.These underlying sources of
trendgrowthareunlikelytobeaffectedbythefinancialturmoilor
byaslowingglobalmarket
– suggesting that, with continued prude nt economic ma nagement, East Asia, and especially
China,cancontin ueto eme rgeas agrowt hpole in the worl dec onomy,pr ovidingaposs ible
counterw eigh ttotheslowin gindustrialeconomies.
Whilethesu b‐prim ecrisisinth eUnitedStateshashadr elatively
littledirectimpactonbanks
andfinancialinstitutionsinEastAsia,perha psthe most immediateand visibleimpact ofthe
financialturmoilinthe UnitedStates hasbee nth esteep declineinsecuritiesmarketsacr oss
EastAsia ,espe ciall y equity and, to a lesser extent, offshorebo ndmarkets.This declinehas
beendri vennotjustbyuncertaintyandtheliquidatio nofportfolioholdingsofforeignfinancia l
institutions , but als o by a more realistic re valuation of r isk in global financial markets as a
whole and an adjustment in expe cted returns of the underlying in vestments.At the same
time domestic credit — supported by
ample domestic savings — continues to provide
resourcesforinvestment even asportfolioinflows and loans frominternationalbankstaper
off.Morew orryingwoul dbeifthedeclineinstock priceshadaconta gioneffectthroughth e
balancesheetsofcorporationsand/orbanks,oneamongthemanyfinancialsectorissues
that
theauthoritiesinEastAsiawillneedtokeepasharpeyeon.
Building on our analysis of expectedtrade and financialflow s, and the future course of key
economicvariables,wepro jectDev elopi ngEastAsi angr owth coul dde clin eby1‐2percentage
pointstoaround8½percentin
2008comparedto2007.Whilesuch adeclineingrowthisa
matterofconcern,especial lyforthepoorinthesecountrie sforwhomeveryper centa gepoint
ofgrowthcounts,theresulting growthrate is stills ignificantandconsiderablyhi gher thanin
otherregionsofthedevelopingworld.Ofcou rse,
theUSfinancialturmoil coulds tilltakean
unexpectedturnthatmayaffectthisoutlook—especiallyiftheco nt agionwereto spreadto
other industrial countries in a major way — and this may require further downward
adjustmentsintheforecast.Butinsuchaci rcumsta nce ,thestrongfiscalsituation
inmos tEast
Asiancountrieswillallowthemthespacetosoftentheblowbystimulatingdomesticdemand
throughtaxandpublicexpenditurepolicies.
3
EAST ASIA & PACIFIC UPDATE
Quite ap art from the challenge of growth, the East Asian countries also have to deal with
current very high fuel and food prices.In virtually every East Asian country, inflation is
climbingtouncomfortablelevelsduetothesecost‐pushpressures,whilemonetaryandcredit
growthisdifficulttocontainowing
tosubsta ntialcapitalinflows.Somecountriesareresorting
to pricecontrols and otheradministr ative measures to temporaril ycurb inflation, but these
onlydistortmarketsignalsandencourageblackmarketsoverthelongerterm,andeventually
havetoberemoved.Inot hercountries ,fuelsubsidieshaveclimbedtothe pointwhere
they
arebecomin galargefiscalburden.
Dealing with high food and fuel prices probably constitutes a greater challenge to
governmentsinEas tAsiathanthe financialturmoilintheUni tedStatesandaslowingglobal
economy.Inthemediumterm,theanswerclearlyliesingreaterfuelefficiency,strongerand
moreproductiveglobalagricultureandanopeninternationaltradingsystem.Butintheshort
term,thebiggerconcernistoalleviatetheharshburdenthisimposesonthepoor.True,some
economiesinth eregionarenetexportersofthesecommodi tiesandsoare enjoyinggainsin
overall nation al income.
And true, hig her food prices do help farmers – although small
farmersareusuallynetconsumersoffo odandarethushurt.Butthenon‐farmpoorlivingin
ruralandurba nareas(andsmallfarmers)—whodevot ebetwee nathirdtotwo‐thirdsoftheir
expenditures tofo od—
are s eeingtheirre al incomes de cli nes ubs tantiallyas aresultof the
increaseinfo odprices.Simil arly,wh ilehig herfuelpri cesaffectever yone ,thepoorarehurt
disproportionately.Alth oug hthi sdifficultpr oblemhas neithereasyanswersnora one‐size‐
fits‐allsolution,EastAsiahasfacedthesechallengesbefore
andadoptedavarietyofsolutions
inth epast tofitdifferentcircumstances,rangingfromtargetedsubsidiestoconditionalcas h
transfersto school lunch programs.These programs now need to be considered aga inand
reintroducedbeforethepro blembecomesto oacute.
4
East Asia: Testing Times Ahead
Introduction
espitefall inggr owthinex portsto the US,risingvolatility in globalfinancialmarkets,
highandvolatileinternationalcommodityprices,andanincreasinglycloudedoutlook
forthewo rldec onomy,economicac tivityin mostEastAsian economiescontinuedat
strongratesthroughthe endof 2007andintoearly 2008.Fortunately,the
co untriesof East
Asia are generally better prepared than ever to deal with the vicissitudes of the global
economyinthismoreunc ertaintime.ReflectinglessonslearnedfromtheEastAsianfinancial
crisis of a dec ade ago, to da y most eco nomi es in the region have st rong external payments
positions and large
international reserves, prudent fiscal and monetary policies, better
regulatedbankingsystems,andprofitableandcompetitivecorporations.EastAsia’stradeand
financialrelationswiththerestoftheworldhavebecomesteadilymorediverse.Theregionis
becomingmoreofagrowthpoleintheworldeconomy,provingtobeaforce
forstabilityata
timewhentheindustrialeconomiesareslowing.
ThisisnottosaythatEastAsiaisimmunefromdevelopmentselsewhere.Onthecontrary, its
increased integrationintheworld’s trading and financial systemmakesit sensitive to global
economic condition s. Whether the un folding turmoil in US
and other financ ial markets will
gatherforceorstarttoabate,andhowlargeitsimpactsonworldeconomicactivitywillbe,is
still uncertain. On balance, however, the financia l turmoil has substantially increased the
likelihoodof aUSrecessi onandasignifi cantslowdowninworldgrowth in2008,includingin
EastAsia.Economiccyc lesinEa stAsia ha veindeedoften beencorrelatedwithcycles inthe
industrialcountries.Butth esehavegenerallybeencyc lesaroundanEastAsiantre ndrateof
economicgrowththathasformanydecadesrunat4–5.5percentage pointsfasterthantrend
growthinindustrialcountries.
Hightrendgr owth hasbeendrivenbyfundamentalfactorssuch
as robust productivity gains, ability to absorb knowledge from abroad, high savings, and
growing education and skills. And these fundamentals are unlikely to be displace d by the
presentfinancialturmoilandcyclicalslow down.
Looking forward, grow th in Developing East Asi a in
2008 is expe cted to co me do wn fr o m
2007’s exceptional pace of over 10 perc ent by a hefty 1.5 percentage points. Nevertheless,
thatdeclines tillwouldleavere gionaloutputexpandingbyahealthy8.5pe rce ntorso (table
1). GrowthinChina isex pect edto comedown by2 fullpercentage
pointsto9. 4percent.A
furtherslowinginexportgrowth willlikel ybealeadingelem entintheimpendingEastAsian
slowdown.Oneofthe striking features of the past six monthshasbe enhow modestly East
Asianexportshavedecelerated,asweakerexpor tstotheUSbyhavebeenoffset
byincreasing
exports to Europ e, other East Asian economies, and––a notable development––surging
exports to other developing regions , especially those benefiting from high oil prices. It is
D
6
East Asia: Testing Times Ahead
nevertheless likely that exports will turn
lowermore distinctlyincomingmonths,
as US impor ts themselves begin to fall
(rathertha nmerelygrowingmoreslowly
or stagnating), and as the US downturn
and financial market turmoil begin to
affectmoredecisivelyot herre gionsthat
areEastAsianexportmarkets.
The US
financial market turmoil has
alreadyled to increased volatilityinEast
Asian equities markets and to rising
offshorebondfina ncingco sts .Howe ver ,
given that lending by dom es tic banks––
the main source of financing in the
region––has been little affected so far,
the impact of these developments on
domestic activity may be
limi ted. Rising
oil, metals, and food prices will also
impose alossofincomeonEastAsiaofperhapscloseto1 percentofGDP. (Of course,the
region contains a number of net commodity‐ex porti ng economies that will enjoy gains in
nationalincomeduetohigher commodityprices.)Risi ng
foodpricesareexa cerbatinghe adl ine
inflationandhurtingtheincomesofthepoor.Thes edevelopmentscoul dstallorevensetback
the progress made in reducing poverty over the last decade while heightening political
tensions.
The task of macroeconomic management in this environment will not be an easy one,
although policy
‐ makers in mo st East Asian countries will be able to confr ont the problems
fromarelativelystrongpositi on.
Current account surpluses and large foreign reserves provide a buffer that will enable
economiesto accommodatevolatilityininternationalcapi tal flo wswithoutforcingthekindsof
sudden large ad justments in domestic demand
that bec ame inevitable during the 1997 –98
financial crises. Fiscal positions generall y also have become stronger over recent years,
creatingthesco peformorestim ulativefiscalpoliciesshoul danun expectedfall‐offin private
sectordomes tic makethemdesirable.
The role of monetary policy is likely to be especially challenging. In principle,
the rise in
headline inflation caused by higher international commodity prices should be temporary,
reflectingachangeinrelativepricesthat,byitself,doesnotcallforactionbythecentralbank.
However,monetarypolicywillneedtorem ainvi gilanttoensurethattheriseinfuel,food,and
other
commoditypri cesdoes notset off an inflationary spiralleadingto ri singcorein flation
rates,especiallyineconomiesalreadyshowingsignsofdomesticover‐heatingandexcessively
rapid credit growth. Continued movements toward greater exchange rate flexibility will
provide countries greater fl exi bility in us in g monetary policies to meet inflation challenges.
Countries
alsofacedif ficul tchallengesinaddr essingthehar mful distributionaleffectsofhigher
foodandfuelprices onthelivingstandar dsofthepoor. Well‐targetedcashtransferschemes
may be helpful, although they need to be considered within the context of the country ’s
overallfiscalposition.
Table1.East Asiaeconomicgrowth
2006 2007 2008 2009
Emerging EastAsia 8.4 8.7 7.3 7.4
Develop.E.Asia 9.8 10.2 8.6 8.5
S.E.Asia 5.5 6.1 5.6 6.0
Indonesia 5.5 6.3 6.0 6.4
Malaysia 5.9 6.3 5.5 5.9
Philippi nes 5.4 7.3 5.9 6.1
Thailand 5.1 4.8 5.0 5.4
TransitionEcon.
China 11.1 11.4 9.4 9.2
Vietnam 8.2 8.5 8.0 8.5
SmallEconomies 7.2 6.6 6.4 6.1
NewlyInd.Econ. 5.6 5.6 4.6 5.0
Korea 5.0 4.9 4.6 5.0
3otherNIEs 6.1 6.2 4.6 5.0
Japan 2.2 2.1 1.5 2.0
Source:WorldBankEastAsiaRegion;March
2008ConsensusForecastsforNIEs.
Global Financial Turmoil
heturmoilintheUSsub‐primemortgagemarketthatbegan lastAugusthascontinued
to br oaden and i ntensify, leadi ng to a tighteni ng in global credit markets and failing
financial institutions – most dramatically with the collapse of the Bear Stearns
investmentbankinmidMarch2008.Howthiswillplay
outanditspotential effectsonworld
economic growth, tra d e and fin ancial fl ows is one of the two or three major uncertainties
facingeconomicpolicymakersinEastAsia atpresent.
Theroots ofthecri sisar eta ngledbut one certainly liesinthe longboom inth eUShousing
marketthatcameto anendin200 6.Onecategoryof loansthathadexpandedrapidlysi nce
themid‐1990s wasUSsub‐primemortgages—mortgagesowedbypeoplewitha riskycredit
profile or mortgages that are to o large to be eligible for reinsurance through government
backed mortgage agencies.Issuance of
such mortgages surged in the latter years of the
housingboom,in2004‐2006inparticular.
Housepricesbeganfallingfrommid2006,whiletherateofdefaultsonsub ‐primemortgages
soared(figur e1).Byearly2007 therateofseriousdelinquenciesonsub‐primemortgageswith
adjustable interest
rates climbed to 11 percent, about double th e rate in mid‐2005. These
risingmortgage delinquencieswerethetriggerforavirtual collapseinthepriceofmortgage
backedsecurities insecondar ymarkets thatbe ganinthethird quarteroflastyear.Lehm an
Brothersestimatesthatlossesontheexistingstock
ofmortgagescouldtotal$250billionwith
a 15 percent housing price decline.Greenlaw, Hatzius et al (20 08) estimate that mo rtgage
creditl ossesonthecurre ntstock ofmor tgages couldtotal$400billion.
2
They estimatethat
losseswillbesplitroughlyhalfandhalfbetweenUSandforeignleveragedinstitutionssuchas
investmentbanks,commerci albanks,andhedgefunds.
Asecondbroadsetoffactorswerefinancialinnovationsinthe1990sand2000swhich,while
they have played a key role in promoting
deep and more efficient capital markets and
providing instruments for trading and spreadi ng risk, have also been instrumental in
transmittingtheshockofrising delinquenciesin th emo rt gagemarketmorebr oa dlythrough
the financial system. One of these is securitiz ation, which involves the transformati on of
illiquidassetslikemortgageloansinto
securiti esthatcanbetradedincapitalmarkets. Another
2
DavidGreenlaw,JanHatzius,AnilK.Kashyap,HyunSongShin.(2008).“LeveragedLosses:Lessons
fromtheMortgageMarketMeltdown.”USMonetaryPolicyForumConferenceDraft.(February29).
T
8
East Asia: Testing Times Ahead
isthedevelopmentofnewrisktransfer
instruments tha t have allowed market
participantstoslicetherisksembedded
in traditional financial instruments and
trade them separately, thereby
allowingtheseriskstobespreadacross
alar genu mb erof marketparticipants.
A sizeable proportion of sub‐prime
mortgages were securi tized in
collateralized
debt obligations (CDOs )
and found their way onto the balanc e
sheets of banks, investment funds or
‘structured investm ent vehicles’ (often
affiliates of banks) andinstitutional
investors such as pension funds,
insurance companies, and individuals
worldwide. It is estimated that at the
time the crisis started sub‐prime
securitiesmadeup
some15‐20percent
of total CDOs, which, in turn, wer e
estimated toamountto US$ 1 trillion
in the US and US$ 1.5‐2.0 trillion
worldwide.
Rising mortgage delinquencies would
certainly have hurt th e balance sheets
of mortgage lenders in any case, but,
withsecuritization,market p articipants
havefoundit
difficultto estimate‘who
holds what’ and the magnitude of the
exposure to risk of different financial
institutions.Hei ghtene d uncertainty
thenledtonegativespilloversandafall
in prices of a broader set of
instruments such as CDOs, mortgage
backed securities, jumbo mortgages
and asset backed commercial paper,
imposing
further balance sheet losses.
Risinguncertaintyaboutthedistributionofl o ssesandthecreditworthinessofborrowersalso
contribu tedtoa sharp rise in spreads and adryi n g of credit in a number of key short term
fundingmarketssuchastheinterbankmarketandtheassetbackedcommercialpapermarket.
Reflecting
thefundingsqueezeintheinterbankmarket,thespreadbetweenthe 3monthUS
dollar LI BOR rate (at which banks lend to each other) and the OIS rate (a me asure of the
expectedovernightfederalfundspolicyrate)surgedfromlessthan15basispointsonAugust8
2007at
over50onAugust10andover90basispointsbymidSeptember.AsFigure2shows,
theLIBOR‐OISspreadhas remainedhigh,surgingwhenevernewwavesofconcernaboutth e
creditwort hine ssoffinancialinstitutionsaffectthemarket.EurodenominatedLIBORspreads
havealsowidenedsharply.
Figure1.S&P/Case‐ShillerComposite HomePriceIndex
(Jan.1987–Jan.2008)
0
50
100
150
2
00
2
5
0
Jan-87
Jan-89
Jan-91
Jan-93
Jan-95
Jan-97
Jan-99
Jan-01
Jan-03
Jan-05
Jan-07
Source:Bloomberg,Datastream.
Figure2.Termliquidityspreads:3‐monthLibor/3‐monthOIS.
Jan.2007–Mar.2008
0
20
40
60
80
100
120
Jan-07
Feb-07
Mar-07
Apr-07
May-07
Jun-07
Jul-07
Aug-07
Sep-07
Oct-07
Nov-07
Dec-07
Jan-08
Feb-08
Mar-08
US dollar
Euro
basis points
Source:Bloomberg,Datastream.
9
EAST ASIA & PACIFIC UPDATE
Athirdfa ctorin theamplificationandspreadofthecr isisistheprocessofpro‐cyclicalact ive
balancesheetmanagem entbyleveragedfinancial institutions.Whenthevalueofassets in
balancesheetsaremarkedtomarket,ariseinthepriceofassetsheldbyfinancialinstitutions
will be reflected
in an increase in their net worth.Withactivebalance sheet management,
banks then borrow more (to maintain a target ra tio between leverage and net wor th) and
acquiremoreassets,whichtendstopushassetpricesupevenmore.When–astoday‐asset
pricesare falli ng,thismultipliergoes
intoreverse.Aslever agedinsti tuti onssuffer loss eson
their assets their net worth falls and they are obliged to pay down th eir borrowin gs,which
theydobysellingassets.Thispushesdownassetprices,whichfurtherdamagestheassetside
ofbankbalancesheets.
Greenlaw, Hatzius et al (2008) suggest that
is the active balance sheet management and
develera ging pr oc esswhichexplai nsth eprogressive broadeningof cl assesof assetsaffected
bypricedeclinesandtighteningcreditconditionsinlate2007andearly2008,includingwider
classesofmortgageloans,corporatedebt,sovereigndebtandequities.Thesedevelopments
haveresulted,overall,in
asignificanttighteningofcreditavailability,especiallyinth eUSand
the Euro Area.How far could the delever agin g proc ess go? Under a plausible scenario,
Greenlaw,Hatziusetal(2008)calculatetha tbalancesheets ofUSfinancialins tituti onscould
contractby$1.98trillion.Theyestimatethatthis,inturn,couldreduce
GDPgrowthby1‐1½
percentag epointsover thecourseof ayear.
The Federal Reserve has undertaken a series of strong and innovative actions aimed at
maintaining the liquidity of leveraged financial institutions and the flow of credit in the
economy– slashing thebenchmark interest rate to
just over2percent,wide ningtheasse ts
againstitiswillingtolendtoincludemortgagebackedsecurities ,andall owingawidersetof
financialinsti tutionstoborrowdirectlyfromitsdiscountwi ndow.Buthowsuccessfulthe se
actions will be in staunc hing the cri sis in cr edi t markets is not yet cl ear.
There is now an
unusuall yhighlevelofuncertaintyaboutth eeconomicoutlook,giventh evastinnovationsin
financial ma rkets ov er the past decade and th e as‐yet poor un derstanding of the new and
complex linkages within the post‐securitization financial system and between the fi nancial
systemandthereal
economy.
Given the high level of uncertainty
surrounding the global outlook we
haveassumedaninterimscenariowith
a range of outcomes for the external
environment facing East Asia rather
than point forecasts.(Table 2).This
scenario sees gr owth in th e industrial
world in 2008 slowing from 2007 by
roughly1.0
‐1. 5per centa gepo ints ,with
the sharpes t slowdowns fro m 2007
occurring in the US and Europe, the
two areas most seriousl y affected by
thefi nancial turmoil.
Table2.InternationalEconomicEnvironment
2007 2008 2009
GDPGrowth(%):
World 3.6 2.4–2.8 2.8–3.2
HighInc omeOECD 2.5 1.1–1.6 1.4–2.0
USA 2.2 0.5‐1.4 1.0 ‐2.0
Euro‐zone 2.7 1.3‐1.7 1.5‐1.9
Japan 2.1 1.3‐1.7 1.6‐2.0
Worldtrade(%) 7.5 4.0–5.0 5.0–6.0
Oilprice($/bbl) 71.1 80‐90 80‐90
Non‐oilcommodity 15.8 10‐20 ‐10‐0
WorldBankEastAsiaandPacificRegion.
Interimsc enari oMarch2008.
10
East Asia: Testing Times Ahead
East Asian Developments …
A Case for Guarded Optimism?
STRONG GROWTH MOMENTUM UNDER CLOUDED SKIES
Developin gEast AsianGDPgrowthreached10.2percentin2007,thehighestsi ncetheearly
1990s.Growthgenerallycon tin uedatstrongratesinthethirdandfourthquartersoftheyear,
despitegrowin g concer ns about the potential impactsofthe financial turmoil in the United
States.GrowthinChinaexceeded
11percentthrougho uttheyear,easingonlygraduallyover
the cours e of the ye ar as moderating ex port gro wth was mostl y of fset by ri sing domestic
investment and consumption growth.Low income economies such as Cambodia, Lao PDR,
MongoliaandViet namalsocontinued to see strong growthina 7‐10pe r cen trange
for the
thirdorfo urt hyearinsuccession.
Mostmiddleincomeco untries inSo ut hEastAsia enjoyed an increase inthepace ofoutput
growth over the course of 2008 (Figure 3), generally on the basis of accelerating domestic
demand. Rising remittances flows in the Philippines sup ported robust c o nsum pti on growth,
while recent improvem ents in the fiscal position allowed a str ong increase in public
infrastructure spendi ng.Gr owth in Indonesia accelerated to a 10 year high of 6.3 percent,
principall yonthebasisofboomingprivateinvestmentandconsumption.Runni ngcounterto
there gi onaltrend,private consumptionandinvestmentinThai landwerege nerall y
weakfor
much of the year because of unsettled political conditions, but growth still came in at a
respectable4.8percentbecauseofresilientoverallexportgrowth,despiteweakerexportsto
the US and a 9 percent appreci atio n of the baht against the dollar.Growth in Thailand
acceleratedtoan
unexpectedlystrong5.7percen tinthefourthquarterbecauseofalateyear
surgeinexportstoEurope,Japan,therestofEastAsiaand–reflectingatrendacrossEastAsia
–inexportstoot herdevelopingregionsan dcountries,es peci allythosebene fitingfromhigh
oilpri ces,suchasthe
MiddleEast andRussia.
Growthinmostofth ehi ghincomeNe wl yIndustrializedEconomie s(N I Es) in there gionalso
pickedup to anav er agepaceofaround6percentinthesecondhalfof 2007, supportedby
robustco ns um ptio ngrowthandunexpectedstrength in ex ports. Real growthinexpor tsof
goods and ser vices in Taiwan (Chi na) and Korea acc elerated to 13 percent and 16 perc ent
12
East Asia: Testing Times Ahead
respectively in the fourth qu arter, for ex am ple.Sin gapo re however saw year on ye ar GDP
growthdeceleratesharplyfromcloseto10percentinthethirdquartertojustover5percent
in the fourth because of falling manufacturing sector growth. Fourth quarter output
contracte d at a seasonally adjusted annual rate of
‐4.8 percent from the third quarter,
contributingtothedownturninquarteronquartergrowthofNIEsasagro upshowninFigure
4.Singa pore’sMinistryofTr adeandIndustryobservedthatthefallreflectedasharpdeclinein
biomedical manufacturingratherthantheimpactoftheslowingUSeconomy.
Figure3.East Asia–QuarterlyGDPGrowth(%ChangeYearAgo)
Q1 1999
Q3 1999
Q1 2000
Q3 2000
Q1 2001
Q3 2001
Q1 2002
Q3 2002
Q1 2003
Q3 2003
Q1 2004
Q3 2004
Q1 2005
Q3 2005
Q1 2006
Q3 2006
Q1 2007
Q3 2007
-3.0
0.0
3.0
6.0
9.0
12.0
E. Asia NIEs
SE Asia China
Source:WorldBankda taandstaffestimates.
Figure4.East Asia–QuarterlyGDPGrowth
(%ChangeQuarterAgo,SAAR)
Q1 2001
Q4 2001
Q3 2002
Q2 2003
Q1 2004
Q4 2004
Q3 2005
Q2 2006
Q1 2007
Q4 2007
-3
0
3
6
9
12
1
5
NIEs
SE Asia
Source:WorldBankda taandstaffestimates.
13
EAST ASIA & PACIFIC UPDATE
FINANCIAL LINKAGES: US TURMOIL AFFECTS EAST ASIAN
SECURITIES MARKETS, NOT SO MUCH BANKS
ThemostobviouseffectsoftheUSfinancialturbulenceonEastAsiahavebeensharpdeclines
inEastAsianequitymarkets.Risinguncertaintyandriskaversionhavealsopushedspreadson
sovereign and private offshore borrowings higher. A number of economies experien cednet
portfoliooutflowsinthelatterpartof
theyear,areversaloflargeinflowsearlierintheyear.A
number of banks in the region have written off losses on US sub‐prime mortgage‐related
assets, althoughtheim pacton overall bankin gsystem profits and balance sheetshassofar
been small. However, it remains to be seen
what additionallossesbank sin the region may
experienceastheUScre ditmarketturmoilaffectsawidenin garrayofassets.
ThemacroeconomiceffectsofUSandglobal
financial volatility and associated financial
sector losses in East Asia seem relatively
limited.Thisas sessmentcouldch angeif the
global credit market
turmoil intensifies in
coming months in ways tha t more se verely
affect domesti c financial systems in East
Asia.At the broad macro level, most of the
region’s larger economies are running large
current account surpluses an d have sha rply
reducedtheirnetexternalliabilitiesoverthe
lastdecade.EastAsiais alarge
netsupplier
offundstotheglobalfinancialsystemrather
than a borrower. In 2007 net current
accountsu rplusesto taled closeto9pe r ce nt
of regional GDP (or a median 7.4 percent
among the 9 largest economies), while net
capital inflows were worth an additional
percentag epointofreg ional GDP
(figure5).
In many economies, lower private capital
inflows actually will reduce the monetary management and exchange rate appreciation
pressuresthattheircentralbankshavebeen grapplingwith.Mostbusinessinvestmentinthe
region continues to be financed from internal ea rnings or domestic bank borrowing , where
thereisthusfarlittle
signofadomesticcredit crunch.Thiscouldchangeifbankssufferbigger
lossesonforeignmort gage ‐relatedasse tsthanhavebeenexpose dthusfar.
Equity markets sell off
Looking at so me of the se financial linkages and im pacts in more detail, equity prices in the
major economies have fall e n a median 19 percent between their peak (generally October
2007)andearlyMarch2008.ThesteepestfallswereinChina,HongKong,thePhilippines,and
Singapor e,andsmallerdeclinesin
Indonesi aandThailand(figure6).Themajorfactorsbehind
theequitypricedeclinesar ehe ightene duncertaintyabouttheglobaleconomicoutlook,ris ing
riskaversion,andasignificantpullbackinportfolioequityandbondflowstoemergingmarkets
Figure5.East Asiabalanceofpayments.1997–2007
-4.0
-2.0
0.0
2.0
4.0
6.0
8.0
10.0
1997 1999 2001 2003 2005 2007
Current account
Capital account
Source:WorldBankda taandstaffestimates.
14
East Asia: Testing Times Ahead
afterthestartoftheUSfinancialturbulenceinAugust2007.Inmostcases,though,therecent
pricedeclinesarebutapartialreversalofpreviouslargeandprobablyunsustainableincreases
betweenthe end of 2006 and October 2007 .In some cases, pric e‐earnings (PE) ratios have
comedownfromprobably
excessivetomorerealisticlevels.Forexample,thePEratioonthe
IFC’sChinainvestibleindexfellfrom43inOctober2007to28inJanuary2008.
Initialpublicofferi ngs(I P Os)in
regional financ ial ce n ters su ch
as Hong Kong and Singapore
have plumm ete d. IPOs in
Singapor e totaled only $24
million
in the first 6 weeks of
2008, down from $283 million
in the same period of 2007.
3
Equity markets play a
significant role in corporate
finance in the high‐income
economiesofEastAsiasuchas
Hong Kong, Korea, and
Singapor e. Ho wever, equity
markets are less important in
most of the developin g
economies, for which internal
corporate earnings and ban k
lending are more important
sourcesoffinancing.
3
BusinessWeek,“Asia’sIPOsHitbyaDrought,”February22,2008.
Figure6. Equity MarketIndexes
(Jan.2004(=1)toMarch2007)
0.5
1.0
1.5
2.0
2.5
3.0
3.5
4.0
Philippines Singapore
Hong Kong China
J
an-2004
Apr-2004
Jul-2004
Oct-2004
J
an-2005
Apr-2005
Jul-2005
Oct-2005
J
an-2006
Apr-2006
Jul-2006
Oct-2006
J
an-2007
Apr-2007
Jul-2007
Oct-2007
J
an-2008
0
.5
1
.0
1
.5
2
.0
2
.5
3
.0
3
.5
4
.
0
Indonesia
MalaysiaThailand
Korea
Jan-2004
Apr-2004
Jul-2004
Oct-2004
Jan-2005
Apr-2005
Jul-2005
Oct-2005
Jan-2006
Apr-2006
Jul-2006
Oct-2006
Jan-2007
Apr-2007
Jul-2007
Oct-2007
Jan-2008
Source:HaverAnal ytics.
15
EAST ASIA & PACIFIC UPDATE
Offshore bond financing costs rise
Spreads foroffsho reborrowing
also have widened s ignificantly
for both sovereign and other
borrowers (figure 7). Spreads
moved from exceptionally low
levels of approximately 140
basis points in mid‐2007 to
approximatel y 270 and 320
basis points by early March
2008 for Philippines and
Indonesia, respectively.
Nevertheless, the latter remain
well below historical levels in
the early‐mid 2000s and also
well below spreads in US high‐
yield debt markets. Spreads
also have moved higher for
China, Malaysia, and Thailand.
However, appropriately for
countries with much lower net
externaldebt ,,at100–150basis
points, their spreads remain
considerably lower than those
of Philippines and Indonesia.
4
The iTraxx Asia ex‐Japan Credit
Default Swap (CDS) Index
measures how the cost of
offshore financin g has
increasedforabasketofissuers
that includes East Asian banks
and non‐ban ks as well as
governments (figure 8). The
premium on such contracts
surged almost 300 basis points
between mid‐
2007 and early
March 2008, a much larger
move than for spreads on
sovereignsalo ne.
4
Indeed,foreignreservesheldbyChina,Malaysia,andThailandexceedtheirtotalstocksofexternal
debtbysignificantmargins.InIndonesiaandPhilippines,foreignreservesstandat30percent–40
percentoftotalexternaldebt.
Figure7.Emergi ngMarketSpreads(Jan.2001–March200
J
an-
2001
Jul-
2001
J
an-
2002
Jul-
2002
J
an-
2003
Jul-
2003
J
an-
2004
Jul-
2004
J
an-
2005
Jul-
2005
J
an-
2006
Jul-
2006
J
an-
2007
Jul-
2007
J
an-
2008
0
200
400
600
800
China
Malaysia
Indonesia
Philippines
Thailand
Source:JP Morgan EMBI+;WorldBankdata.
Figure8.iTraxxAsiaex‐JapanCDSIndex
(Premium(bid)inbasispoints)
0
50
100
150
200
250
3
00
3
50
09/20/2006
11/20/2006
01/20/2007
03/20/2007
05/20/2007
07/20/2007
09/20/2007
11/20/2007
01/20/2008
03/20/2008
Source:Da tast ream.
16
East Asia: Testing Times Ahead
…but domestic credit conditions little affected
How fully rising of fshor e spr eads are refl ecte d in domestic borrowing costs remains to be
seen. In Indonesia, yields for dom estic governmen t borrowing have risen fr om le ss than 9
percentinmid ‐2007 to over10percent in early2008.Asregardspriva tesectorborrowing,
however,retainedearningsanddomesticbank
borrowingremainthemostimportantsources
ofexternalfinancingforfirmsinmostofdev el opin gEas tAsia.Hereitisdifficulttoseeobvious
signs of bank credit becoming more costly or harder to obtain. Average bank lendi ng rates
generallytrendedlower orwerebr oa dlyflat throughtheendof2007,
trac kingthetr e ndof
policy interest rates (fig ure 9). Bank lending rates trended highe r in China, but again this
reflected the gover nment’s policy of tightening monetary policy to avert the danger of
economic overheatingand higherinflation.Growthin bank credit to the private sector was
acceleratingstronglyinChina,
HongKong,Indonesia,andSingap oreinlate2007orearly2008,
whilerunninginlinewithtrendsof recentyearselsewhere(table3).
Figure9.BankLendingRates(%)(January2006‐Februar y2008)
5
6
7
8
9
10
11
12
0
2
4
6
8
10
12
14
16
1
8
China
Malaysia
Philippines
Thailand
Indonesia (RHS)
Jan-06
Mar-06
May-06
Jul-06
Sep-06
Nov-06
Jan-08
Jan-07
Mar-07
May-07
Jul-07
Sep-07
Nov-07
Source:IMFIFSandWorldBankdata.
Table3.Bank Creditto PrivateSector(%changeyearago)
2003 2004 2005 2006 2007*
China 20.8 11.2 9.2 14.3 19.3
Indonesia 21.1 33.0 24.8 12.5 22.4
Malaysia 6.8 6.6 9.2 6.9 11.2
Philippines 1.1 9.3 ‐2.2 7.4 1.9
Thailand‐1.3 11.3 7.7 4.0 4.6
HongKo ng ‐2.8 3.7 6.0 1.8 12.4
Korea 8.9 1.3 7.4 14.5 12.4
Singapore 5.4 4.4 2.0 4.9 17.6
So urce :IMFI nter nati onalFinanceStatistics.
*Latestavaila bleinlate2007orearly2008.
17
EAST ASIA & PACIFIC UPDATE
Impact on East Asian bank balance sheets seems limited so far – but needs monitoring
HowwellEastAsianbankscontinuetoperformtheirintermediationandotherkeyeconomic
functions also will depend on the quality of their balance sheets. This introduces another
potential channel through which the US creditmarketcrisis could affect EastAs ianfinancial
systems by damaging the quality of assets on
bank balance sheets. Measures of non‐
performing loan ratios and capital adequac y in the larger economies ge nerally continue to
show improvements (figure 10). Nevertheless, past experience shows that underlying
deteriorati oninbankassetqualitycanremainobscuredduringaperiodoffastgrowthsuchas
EastAsiahasexperie ncedinrecent
years.
Initialassessmentsbyregulators,creditratingagencies,andinvestmentbankssuggestedthat
emerging East Asian financ ial sector expo sure to US sub ‐prime‐related assets was rel ativ ely
limited.Suchexposurewasconcentrated insomemore develop edfi na ncial markets suchas
KoreaandSin gapore ,aswellasinChina,andin
afewinstitutionsineachcountry:WooriBank
inKorea,DBSinSingapore,and BankofChinaandIndustrialand Co mmercialBa nkofChina.
Indeed,Chin aisthelarg estoverse asholderofUSmortgage ‐backedsecurities–– approximately
$260 billion––mostly through the central bank ’s international reserve holdings and also
through holdings of commercial
banks. However, mo st of th ese holdings are backed by US
governmentagenciessuchasFannieMaeandFreddieMac.Amongcommercialbanks,Ban kof
Chinadisclosedanexposure of$7.95billioninassetsrelatedtoUSsub‐primemortgagesatthe
end of Septem ber2007.AttheendofDecember,
these assets had been reduced to$4.99
billion,against whichthebank booked charges of$1.3billion.Never theless,Ba nkofChina’s
netprofitsroseanunexpectedlystrong31percentto56.3billionyuan($7.99billion)in2007.
This increase came despite the write‐off on sub‐primeasse tsdrivenby strong
loan volume,
higherinterestmargins,andsurgingfeeandcommissionincome(the latter drivenbytherapid
developmen tofChi na’sdomesticcapi talmarket).
Figure10.EastAsianon‐performingloanratios,2002–07
0.0
5.0
10.0
15.0
20.0
25.
0
Dec 2002
Dec 2003
Dec 2004
Dec 2005
Dec 2006
Dec 2007
China
Indonesia
Korea
Malays ia
Philippines
Thailand
Source:WorldBankda taandstaffestimates.
18
East Asia: Testing Times Ahead
Finally, there is also a ris k that ba nks in emergi ng ma rkets could suf fer li quidity or f undi n g
problems on the liability si de of the ir balance sheets if the tu rmoil in global credit markets
causes international banks suffering large losses on mortgage related assets to begin
liquidating their loans to emerging market banks.
5
However, Bank for International
Settlemen ts (BIS ) data suggest that external borrowings by banks in so me of the main East
Asiandevelopingeconomiesareconsiderablylowertodaythan,forexample,beforethe1997
financialcrisis.ThaibankliabilitiestoBISre porti ngbanksst oodatapproximately9percentof
GDPinlate
2007,forexample,compare dto48percentofGDPinJune1997.EastAsianbanks
alsohav ebu iltupth eirownloansanddeposits withinternational banks. Thus,for exam ple,
whilePhilippinebanks’net borrowing sfro minter nationalbankswere 8.4 percentof GDPin
June1997,theywer e‐4. 4percentof
GDPinSeptember2007,thatis,anetcreditposition.
Overall, theinitialassessmentofrelativelylimitedspilloversfromtheUScreditmarketturmoil
ontotheEastAsianfinancialsectorappearstobeholdinginearly2008.However,itwillneed
tobecloselymonitoredandre‐ev alua tedasthe
creditmarketturmoilintensifiesandsp reads
fromstartingpointofsub‐pri memort gages toaf fect increasinglywiderclassesofassets.
TRADE LINKAGES: WEAKENING US DEMAND OFFSET BY OTHER
MARKETS – SO FAR
Although exports from a number of
economies were showing unexpected
resilience and revival late in 2007 and
early 2008, gr o wth in East Asian expo rts
asawholeeas edlowerove rthecourseof
2007. In US$ terms, Emergi ngEa stAsian
exportsslowedfromyear‐on‐yeargrowth
of approximately 22
percent in January
2007 to 15 percent–16 percent in the
third quarter. Expo rt growth eased in
China as well as in the Sou th East Asian
middle‐incomeeconomiesandthenewly
industrialized economies (NIEs) (figur e
11).Mo rerecently,th ough,areboundin
export growth in South East Asian
economiesincl udingIndonesia,
Malaysia,
and Thailand and in NIEs such as Korea
and Taiwan (China) has pushed overall
regionaldollarexport growth backup to
18percent–19percen t.
5
TheWorldBank’sforthcoming“GlobalDevelopmentFinance2008”reportstudiesthislinkagein
moredetail.
Figure11.EastAsiaExportGrowth (US$3mo.avera ge‐ %
changeyearago.Jan.00‐Jan08)
-10
0
10
20
30
40
Jun-2001
Nov-2001
Apr-2002
Sep-2002
Feb-2003
Jul-2003
Dec-2003
May-2004
Oct-2004
Mar-2005
Aug-2005
Jan-2006
Jun-2006
Nov-2006
Apr-2007
Sep-2007
E. Asia
SE Asia
China
NIEs
Source:WorldBankda taandstaffestimates.
19
EAST ASIA & PACIFIC UPDATE
Giventhesteepdeclineofthe
dollarin2007,it al soisworth
looking at exports in local
currency terms.And to get a
more detailed view of export
momentum, consider
seasonally adjusted quarter‐
on‐quarter growth in the
rollingthree ‐monthlyaver age.
The local curre ncy ex port
momentumforEm er gin gEast
Asiaasawholeeasedofffrom
approximatel y 16 percen t in
the fourth qu arter of 2 006 to
11 percent in the fourt h
quarter of 2007 (figure 12).
The analysis confirms that
export momentum in South
East Asia and the NIEs was
reboundi nginlate2007,while
also suggesting that export
momentum from China
continued to gradually ease
intolate2007andear ly2008.Interestingly, recent months are amongtherare tim es when
exportgrowthinothermainEastAsianeconomiesisrunninghi gherthaninChina.
ThispatternofagradualeasinginEastAsianexportgrowth,orevenofexport
recoveryduring
aglo baleconomicslowdown,is verydi fferentfro mthe last major US downturnin2001.At
thattime ,EastAsi anloc alcurrencyex portmomentumplungedfrom25 percenttonegative
10percentover12mo nt hs.Butifth emorere centpatterncontinuesinto2009,itcouldhelp
the
regionachievemore ofa“soft
landing”thanasteepdownturnor
recession as experienced in 2001 .
Several factors explain the
difference between the recent
shallow descent of East Asian
export growth compared to its
sudden,steeppl ung ein2001.
First, US import growth itself
eased lower gradually in 2007
(figure
13).Year‐on‐year US$
import growth will doubtless
become negative as US economic
growthslowsfurtherin2008 .Yet,
the pace of decline may remain
shallower than in 2001. One
reason is that US electro nics and
high‐technology imports,
Figure12.EastAsiaExportMomentum(Localcurre ncy.
3mo/3mo‐%changeSAAR.Jan.04‐Jan08)
-10
0
10
20
30
40
5
0
Jan-2004
Apr-2004
Jul-2004
Oct-2004
Jan-2005
Apr-2005
Jul-2005
Oct-2005
Jan-2006
Apr-2006
Jul-2006
Oct-2006
Jan-2007
Apr-2007
Jul-2007
Oct-2007
Jan-2008
E.Asia
SE Asia
China
NIEs
Source:WorldBankda taandstaffestimates. CencusX‐12
trend‐cyclecomponent.Regionalweightsusin g2000US$
exports
Figure13. USImportGrowth
(%changeyearago.Oct2000‐Jan2008)
Oct-00
A
pr-01
Oct-01
A
pr-02
Oct-02
A
pr-03
Oct-06
Oct-03
A
pr-04
Oct-04
A
pr-05
Oct-05
A
pr-06
Oct-07
Apr-07
-30
-20
-10
0
10
20
3
0
US Imports - High Tech (SITC 75-77)
US Imports - Ex fuel and high tech
Source:WorldBankda taandstaffestimates.
20
East Asia: Testing Times Ahead
especiallyimportantmarkets forEastAsianexporters,ha vedeclinedatab outthe samepace
as overallnon‐fuel/non‐hi ghtech exports.This is quite unlike the 2001 recession, when the
endofahigh‐techspendingboomledtoasuddenandsteepcollapseinUShigh‐techimports,
followedby
asharp fall in other imports.Re cen tdataonhig h‐tech equipmen torders in G3
countriesandonwo rldsemiconduc torsalessuggeststh atglobalhigh‐techdemandindeedis
waninginlinewiththebr oad erdownshiftindomesticdemandgrowthindevelopedcountries.
Thisdeclineislikelytobere flected
inweakerEastAsianexportgrowthinthemonthsahead.
However, there is little in the data so far to suggest a steep high‐tech‐led downturn of the
2001type.
Asecondfactor explai ningtherece ntresilience
of East Asian exports is that export markets
otherth antheUShave
held upwell,andEast
Asianexportershavenimblymadethemostof
the opportunity. Figure 14 shows that US$
import grow th in non‐US industrial countries
ran at approximately 13 percentin 2007, well
above the 5 percent import pace in the US.
Imports by developing countries outside East
Asiaals ogrewbyapproximately17percentin
2007. Strong East Asian exports to booming
developin g country markets elsewhere––in
particular tooil‐richmarketsintheMiddleEast
andRussia–– areoneofthefactorscontributing
to the unexpected strengthening of exports
from many EastAsi aneconomies in late 2007
andearly
2008.
The growing importance and resilience of
emerging countries as factorsin world output
andtra degrowthare2ofth emost important
globaleconomicdevelopmentsover thelas t5
years.In fact, while US imports have fallen
from 19 percent in 2000 to less than 15
percent of total
world imports, developing
countries outside East Asia now comprise 22
percent of the tot al, and East Asi a comp rises
another19percent(figure 15).
What about intra‐East Asian trade, which
comprises a little over 40 percent of overall
East Asian exports? Can it help sustain East
Asian growth during a US
recession, in
particular , through expor ts from the rest of
East Asia to China? As many observers
(including the authors of this report) have
pointed out, a significant part of intra‐East
Asianexports,perhap stwo‐thirds,comprises
Figure14. EastAsi anExportandGlobalImpor t
(%change1990‐2007)
-15
-5
5
15
25
East Asia Exports
Ind.Countries ex USA Imports
Developing ex East Asia Imports
1990 1992 1994 1996 1998 2000 2002 2004 2006
USA Imports
Source:IMFIFS.
Figure15.ShareofWorldImport(percent,1990‐2007)
10
15
20
25
1990 1993 1996 1999 2002 2005
40
45
50
55
6
0
East Asia
Developing ex East Asia
USA
Industrial Countries ex USA - RHS
Source:IMFIFS.
21
EAST ASIA & PACIFIC UPDATE
trade in intermediate products
that are ultimatel y exported
outside the region.
6
Thus, a
significant slowdown in exports
outsidethe region alsowould be
reflected in slower intra‐Asian
exportswithintheregion.
Two provisos coul d be added to
this widely accepted story. First ,
theshareofEastAsianexportsto
the US is declini ng even after
accounting for intra‐Asia n trade.
A simpl e way to see this is to
imagine East Asia as a single
integrated economy, netting out
all intra‐East Asian trade.Ex ports
totheUSasashareofEastAsia’s
purely extra‐regional exports
have fallen from 34 percent in
1999 to 29 percent in 2006
(figure
16).Meanwhile,theshare
of other developing countries
surged from 17 percent in 1999
to26percentin2006––almostas
importantas theUSmarket.
Second, the character of intra‐
East Asian tra de flows also is
likely to undergo structural
change over time. Observers
have noted that Ch ina’s
increasingly sophisticated
domestic
production capacity is
allowing it to so urce more of its
input needs from within China.
Thishasmeantthatimportshave
become increasingly delinked
from exports in the last 2–3
years.TheassociationofChina’simportswithitsexportsfellsharplyinbothsizeandstatistical
significance between 1994–99 and
2000–05, while the association with domestic demand
increasedjustasdram ati cally.
7
Ifth istrendcontin uesand ifot herEastAsi aneconomiesare
abletoexploitthesenewopportunitiesinChina’sdomesti cmarket,then,ove rtime,Chinaalso
islikel ytobecomeanincreasinglyimportantinde pen dentgrowthpolefortherestofEastAsia.
Figure17showsinterestingdi fferencesinthepattern
ofChina’sim portsfromthoseoftherest
6
WorldBankEastAsiaUpdate,November2006.
7
LiCuiandMurtazaSyed,“TheShiftingStructureofChina’sTradeandProduction,”IMFWorking
PaperWP/07/214,September2007.
Figure16. IntegratedEastAsia’sEx por tMarkets*
(Percentoftotalexports;1990‐2006)
USA
Japan
Other Industrial
Developing ex East Asia
* Exports to various markets as % of total East Asian
exports excluding intra-East Asian exports.
10
15
20
25
30
35
1990 1994 1996 1998 2002 20061992 2000 2004
Source:IMFDOTandWorldBankstaffes tima tes.
Figure17. China
–
ImportsfromEastAsia
(US$.3.mo.averages‐%changeyearago)
-
10
0
10
20
30
40
50
6
0
Jan-2001
Jun-2001
Nov-2001
Apr-2002
Sep-2002
Feb-2003
Jul-2003
Dec-2003
May-2004
Oct-2004
Mar-2005
Aug-2005
Jan-2006
Jun-2006
Nov-2006
Apr-2007
Sep-2007
Feb-2008
China's imports from East Asia *
China's exports to the USA
East Asia includes Indonesia, Korea, Malaysia,
Philippines, Singapore, Taiwan (China) and Thailand
Source:WorldBankda taandstaffestimates.