Tài liệu Troubleshooting TCP/IP – Show and Debug pptx
Bạn đang xem bản rút gọn của tài liệu. Xem và tải ngay bản đầy đủ của tài liệu tại đây (55.52 KB, 16 trang )
1-1 Semester 8 Internetwork Troubleshooting v1.0 - Lab 4.6.3 Copyright 2001, Cisco Systems, Inc.
Lab 4.6.3: Troubleshooting TCP/IP – Show and Debug
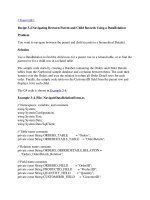
SanJose1 SanJose2
#2#1
S0/0 S0/0
192.168.1.10 192.168.2.10
Objective
There are many commands that are useful for troubleshooting TCP/IP. It is likely
that you have used some of them in earlier classes. In this exercise you will look
at some options, but we will save most commands for later chapters when you
are looking at specific protocols. This lab covers:
• show commands
• debug commands
Warning: The debug command because of its heavy use of CPU cycles can be
devastating to a production router’s performance. It is possible that a command
such as debug IP packet running, during a moderate to heavy traffic period
could literally consume all CPU cycles and effectively stop routing, resulting in
discarded frames. This discussion is included primarily as a tool to help you
visualize how and why certain network processes occur. We will also look at
options that can reduce the impact of the debug commands.
Scenario
You have been asked to consult on a small network and offer suggestions on
how performance might be improved. You are gathering information about the
network.
Note: The configuration file used for this lab will be used for other module 4 labs,
so please do not change any configuration settings. The configuration contains
several components for testing purposes and is not intended to represent a good
production configuration.
2-2 Semester 8 Internetwork Troubleshooting v1.0 - Lab 4.6.3 Copyright 2001, Cisco Systems, Inc.
If the lab is done in pairs, each person can run the lab steps each may get
slightly different results. It might be beneficial to coordinate your efforts and
compare results.
Step 1
Cable the lab as shown in the diagram.
Load the configuration files Lab4-6-3-SanJose1Config.txt and Lab4-6-3-
SanJose2Config.txt into the appropriate routers.
Configure the workstations as follows (same as the last lab):
Host #1 Host #2
IP Address: 192.168.1.10 IP Address: 192.168.2.10
Subnet mask: 255.255.255.0 Subnet mask: 255.255.255.0
Default Gateway: 192.168.1.1 Default Gateway: 192.168.2.1
Step 2
The show ip access-list and clear ip access-list counters
commands
On either router type show ip access-list and look over the results. You
may notice a message indicating matches after some entries like those
highlighted below:
SanJose1#show ip access-list
Standard IP access list 50
deny 192.168.60.0, wildcard bits 0.0.0.255
deny 192.168.70.0, wildcard bits 0.0.0.255
deny 192.168.80.64, wildcard bits 0.0.0.31
permit any
Extended IP access list 100
deny tcp any 192.168.90.0 0.0.0.255 eq www
deny tcp any 192.168.90.0 0.0.0.255 eq ftp
deny tcp any 192.168.91.0 0.0.0.255 eq www
deny tcp any 192.168.91.0 0.0.0.255 eq ftp
deny icmp any host 192.168.60.1
permit ip any any (8571 matches)
Extended IP access list protect_acctg_servers
deny tcp 192.168.60.0 0.0.0.255 192.168.10.0 0.0.0.7 eq www
deny tcp 192.168.70.0 0.0.0.255 192.168.10.0 0.0.0.7 eq www
deny tcp 192.168.80.0 0.0.0.255 192.168.10.0 0.0.0.7 eq www
deny tcp 192.168.90.0 0.0.0.255 192.168.10.0 0.0.0.7 eq www
deny tcp 192.168.91.0 0.0.0.255 192.168.10.0 0.0.0.7 eq www
permit ip any any (44294 matches)
SanJose1#
These “matches” messages indicate the results of the access list since the last
time the counters were cleared or the router rebooted. The clear ip
access-list counters command can be used to clear the counters. Try it.
You may find that like the following example a routing update or some other
activity immediately started the counters again.
SanJose1#clear ip access-list counters
SanJose1#show ip access-list
3-3 Semester 8 Internetwork Troubleshooting v1.0 - Lab 4.6.3 Copyright 2001, Cisco Systems, Inc.
Standard IP access list 50
deny 192.168.60.0, wildcard bits 0.0.0.255
deny 192.168.70.0, wildcard bits 0.0.0.255
deny 192.168.80.64, wildcard bits 0.0.0.31
permit any
Extended IP access list 100
deny tcp any 192.168.90.0 0.0.0.255 eq www
deny tcp any 192.168.90.0 0.0.0.255 eq ftp
deny tcp any 192.168.91.0 0.0.0.255 eq www
deny tcp any 192.168.91.0 0.0.0.255 eq ftp
deny icmp any host 192.168.60.1
permit ip any any
Extended IP access list protect_acctg_servers
deny tcp 192.168.60.0 0.0.0.255 192.168.10.0 0.0.0.7 eq www
deny tcp 192.168.70.0 0.0.0.255 192.168.10.0 0.0.0.7 eq www
deny tcp 192.168.80.0 0.0.0.255 192.168.10.0 0.0.0.7 eq www
deny tcp 192.168.90.0 0.0.0.255 192.168.10.0 0.0.0.7 eq www
deny tcp 192.168.91.0 0.0.0.255 192.168.10.0 0.0.0.7 eq www
permit ip any any (5 matches)
SanJose1#
Step 3
The show ip arp command.
Type the show ip arp command and look over the results. Notice that only the
LAN interfaces and any hosts connected to them appear in the ARP table. You
also get the MAC address, encapsulation type, and the local interface to which
the address has been mapped. There is a show arp command that seems to
yield the same result.
SanJose1#show ip arp
Protocol Address Age (min) Hardware Addr Type Interface
Internet 192.168.1.10 1 00a0.cc23.fe40 ARPA Ethernet0
Internet 192.168.1.1 - 0010.7b3a.3f60 ARPA Ethernet0
Internet 192.168.4.1 - 0010.7b3a.3f60 ARPA Ethernet0
SanJose1#
Type the show appletalk arp command and look over the results. You
should only get a single entry unless you have attached some Mac hosts.
SanJose1#show appletalk arp
Address Age (min) Type Hardware Addr Encap Interface
57.76 - Hardware 0010.7b3a.3f60.0000 SNAP Ethernet0
SanJose1#
An attempt to type the show ipx arp command will remind you that IPX does
not use ARP.
Step 4
The show ip route command.
Type the show ip route command to display the IP route table. Because of a
series of loopback addresses and a variety of protocols configured on both
routers, you should see a pretty extensive display. Note that on SanJose1 there
are some EX - EIGRP external and IA - OSPF inter area routes.
SanJose1#show ip route
Codes: C - connected, S - static, I - IGRP, R - RIP, M - mobile, B - BGP
D - EIGRP, EX - EIGRP external, O - OSPF, IA - OSPF inter area
N1 - OSPF NSSA external type 1, N2 - OSPF NSSA external type 2
E1 - OSPF external type 1, E2 - OSPF external type 2, E - EGP
i - IS-IS, L1 - IS-IS level-1, L2 - IS-IS level-2, ia - IS-IS inter area
4-4 Semester 8 Internetwork Troubleshooting v1.0 - Lab 4.6.3 Copyright 2001, Cisco Systems, Inc.
* - candidate default, U - per-user static route, o - ODR
P - periodic downloaded static route
Gateway of last resort is not set
R 192.168.91.0/24 [120/1] via 192.168.0.2, 00:00:21, Serial0
R 192.168.90.0/24 [120/1] via 192.168.0.2, 00:00:21, Serial0
C 192.168.30.0/24 is directly connected, Loopback2
D EX 192.168.60.0/24 [170/2297856] via 192.168.0.2, 05:49:49, Serial0
C 192.168.10.0/24 is directly connected, Loopback0
C 192.168.40.0/24 is directly connected, Loopback3
192.168.95.0/32 is subnetted, 1 subnets
O IA 192.168.95.1 [110/65] via 192.168.0.2, 05:49:49, Serial0
C 192.168.4.0/24 is directly connected, Ethernet0
D 192.168.80.0/24 [90/2297856] via 192.168.0.2, 05:49:49, Serial0
C 192.168.20.0/24 is directly connected, Loopback1
192.168.96.0/32 is subnetted, 1 subnets
O IA 192.168.96.1 [110/65] via 192.168.0.2, 05:49:50, Serial0
C 192.168.0.0/24 is directly connected, Serial0
C 192.168.50.0/24 is directly connected, Loopback4
C 192.168.1.0/24 is directly connected, Ethernet0
R 192.168.2.0/24 [120/1] via 192.168.0.2, 00:00:24, Serial0
D EX 192.168.70.0/24 [170/2297856] via 192.168.0.2, 05:49:51, Serial0
R 192.168.3.0/24 [120/1] via 192.168.0.2, 00:00:24, Serial0
SanJose1#
Type the show ip route summary command to see the routes summarized
plus overhead and bytes used. Note that it also provides an additional summary
of OSPF network information.
SanJose1#show ip route summary
IP routing table name is Default-IP-Routing-Table(0)
Route Source Networks Subnets Overhead Memory (bytes)
connected 8 0 416 1120
static 0 0 0 0
eigrp 90 3 0 156 420
ospf 100 0 2 104 280
Intra-area: 0 Inter-area: 2 External-1: 0 External-2: 0
rip 4 0 208 560
igrp 90 0 0 0 0
internal 2 2320
Total 17 2 884 4700
Type the show ip route ? command to see the parameter options available.
Adding parameters like connected, static, or the routing protocols filters the
output.
SanJose1#show ip route ?
bgp Border Gateway Protocol (BGP)
connected Connected
egp Exterior Gateway Protocol (EGP)
eigrp Enhanced Interior Gateway Routing Protocol (EIGRP)
igrp Interior Gateway Routing Protocol (IGRP)
isis ISO IS-IS
list IP Access list
mobile Mobile routes
odr On Demand stub Routes
ospf Open Shortest Path First (OSPF)
profile IP routing table profile
rip Routing Information Protocol (RIP)
static Static routes
summary Summary of all routes
supernets-only Show supernet entries only
traffic-engineering Traffic engineered routes
vrf Display routes from a VPN Routing/Forwarding instance
| Output modifiers
<cr>
5-5 Semester 8 Internetwork Troubleshooting v1.0 - Lab 4.6.3 Copyright 2001, Cisco Systems, Inc.
Type the following commands: show ip route eigrp, show ip route
ospf, and show ip route rip to see that you can be selective about what is
displayed.
SanJose1#show ip route eigrp
D EX 192.168.60.0/24 [170/2297856] via 192.168.0.2, 05:55:25, Serial0
D 192.168.80.0/24 [90/2297856] via 192.168.0.2, 05:55:25, Serial0
D EX 192.168.70.0/24 [170/2297856] via 192.168.0.2, 05:55:25, Serial0
SanJose1#
SanJose1#show ip route ospf
192.168.95.0/32 is subnetted, 1 subnets
O IA 192.168.95.1 [110/65] via 192.168.0.2, 05:55:38, Serial0
192.168.96.0/32 is subnetted, 1 subnets
O IA 192.168.96.1 [110/65] via 192.168.0.2, 05:55:38, Serial0
SanJose1#
SanJose1#show ip route rip
R 192.168.91.0/24 [120/1] via 192.168.0.2, 00:00:23, Serial0
R 192.168.90.0/24 [120/1] via 192.168.0.2, 00:00:23, Serial0
R 192.168.2.0/24 [120/1] via 192.168.0.2, 00:00:23, Serial0
R 192.168.3.0/24 [120/1] via 192.168.0.2, 00:00:23, Serial0
SanJose1#
Type the show ip route address command for a host or network address
on the other router to see the source and detail information about that route.
SanJose1#show ip route 192.168.2.51
Routing entry for 192.168.2.0/24
Known via "rip", distance 120, metric 1
Redistributing via rip
Last update from 192.168.0.2 on Serial0, 00:00:01 ago
Routing Descriptor Blocks:
* 192.168.0.2, from 192.168.0.2, 00:00:01 ago, via Serial0
Route metric is 1, traffic share count is 1
SanJose1#
Step 5
The show ip interface command.
Type the show ip interface command to display the IP interfaces. While the
command displays all interfaces, let’s look at the LAN interface. Not only can we
see the IP address, but we see that a second IP address has been assigned to
the interface (192.168.4.1/24). We can see that there are both inbound and
outbound access lists implemented – we would refer back to our show ip
access-list to see what they do. Finally, the Multicast reserved group
(224.0.0.9) tells us that this interface participates in RIP version 2 routing
updates.
SanJose1#show ip interface
Ethernet0 is up, line protocol is up
Internet address is 192.168.1.1/24
Broadcast address is 255.255.255.255
Address determined by setup command
MTU is 1500 bytes
Helper address is not set
Directed broadcast forwarding is disabled
Secondary address 192.168.4.1/24
Multicast reserved groups joined: 224.0.0.9
Outgoing access list is 50
Inbound access list is 100
Proxy ARP is enabled
Security level is default
Split horizon is enabled
ICMP redirects are always sent
ICMP unreachables are always sent
6-6 Semester 8 Internetwork Troubleshooting v1.0 - Lab 4.6.3 Copyright 2001, Cisco Systems, Inc.
ICMP mask replies are never sent
IP fast switching is enabled
IP fast switching on the same interface is disabled
IP Flow switching is disabled
IP Feature Fast switching turbo vector
IP multicast fast switching is enabled
IP multicast distributed fast switching is disabled
Router Discovery is disabled
IP output packet accounting is disabled
IP access violation accounting is disabled
TCP/IP header compression is disabled
RTP/IP header compression is disabled
Probe proxy name replies are disabled
Policy routing is disabled
Network address translation is disabled
WCCP Redirect outbound is disabled
WCCP Redirect exclude is disabled
BGP Policy Mapping is disabled
SanJose1#
Using the same skills, we can see that Loopback 2 is participating in OSPF while
Loopback 3 is participating in EIGRP. SanJose2 should have a similar variety of
routing protocols.
Loopback2 is up, line protocol is up
Internet address is 192.168.30.1/24
Broadcast address is 255.255.255.255
Address determined by setup command
MTU is 1514 bytes
Helper address is not set
Directed broadcast forwarding is disabled
Multicast reserved groups joined: 224.0.0.5 224.0.0.6
Loopback3 is up, line protocol is up
Internet address is 192.168.40.1/24
Broadcast address is 255.255.255.255
Address determined by setup command
MTU is 1514 bytes
Helper address is not set
Directed broadcast forwarding is disabled
Multicast reserved groups joined: 224.0.0.10
Outgoing access list is not set
Make sure that you know the difference between the show ip interface
command and the show interface command. As you saw in the examples the
show ip interface command displays the status of features and options on
the interface. The show interface command includes the MAC address and a
variety of performance counters that can be used to gauge the device’s usage.
For example, the sample data below shows both the input and output statistics. It
also shows that the queuing strategy is FIFO (first in / first out).
SanJose1#show interface
Ethernet0 is up, line protocol is up
Hardware is Lance, address is 0010.7b3a.3f60 (bia 0010.7b3a.3f60)
Internet address is 192.168.1.1/24
MTU 1500 bytes, BW 10000 Kbit, DLY 1000 usec,
reliability 255/255, txload 1/255, rxload 1/255
Encapsulation ARPA, loopback not set
Keepalive set (10 sec)
ARP type: ARPA, ARP Timeout 04:00:00
Last input 00:00:12, output 00:00:04, output hang never
Last clearing of "show interface" counters never
Queueing strategy: fifo
Output queue 0/40, 0 drops; input queue 0/75, 0 drops
5 minute input rate 0 bits/sec, 0 packets/sec
5 minute output rate 0 bits/sec, 0 packets/sec
413 packets input, 98679 bytes, 0 no buffer
7-7 Semester 8 Internetwork Troubleshooting v1.0 - Lab 4.6.3 Copyright 2001, Cisco Systems, Inc.
Received 294 broadcasts, 0 runts, 0 giants, 0 throttles
0 input errors, 0 CRC, 0 frame, 0 overrun, 0 ignored
0 input packets with dribble condition detected
766 packets output, 73002 bytes, 0 underruns
0 output errors, 0 collisions, 4 interface resets
0 babbles, 0 late collision, 0 deferred
0 lost carrier, 0 no carrier
0 output buffer failures, 0 output buffers swapped out
Step 6
The show ip protocols command.
Type the show ip protocols command to display the supported protocols.
While the command displays all protocols, let’s look at the OSPF. The command
displays the process ID (100), the networks using OSPF and the Administrative
Distance.
SanJose1#show ip protocols
Routing Protocol is "ospf 100"
Sending updates every 0 seconds
Invalid after 0 seconds, hold down 0, flushed after 0
Outgoing update filter list for all interfaces is
Incoming update filter list for all interfaces is
Redistributing: ospf 100
Routing for Networks:
192.168.0.0
192.168.10.0
192.168.20.0
192.168.30.0
Routing Information Sources:
Gateway Distance Last Update
192.168.96.1 110 06:20:51
Distance: (default is 110)
The IGRP output displays the AS number (90), the network using IGRP, that it is
redistributing EIGRP, the various timers and the Administrative Distance. The
IGRP metric weights show that the metric has not been modified.
Routing Protocol is "igrp 90"
Sending updates every 90 seconds, next due in 28 seconds
Invalid after 270 seconds, hold down 280, flushed after 630
Outgoing update filter list for all interfaces is
Incoming update filter list for all interfaces is
Default networks flagged in outgoing updates
Default networks accepted from incoming updates
IGRP metric weight K1=1, K2=0, K3=1, K4=0, K5=0
IGRP maximum hopcount 100
IGRP maximum metric variance 1
Redistributing: igrp 90, eigrp 90
Routing for Networks:
192.168.50.0
Routing Information Sources:
Gateway Distance Last Update
Distance: (default is 100)
The EIGRP output displays the AS number (90), the networks using EIGRP, that
it is redistributing IGRP, that automatic address summarization is on, the various
timers and both Administrative Distance. The IGRP metric weights show that the
metric has not been modified.
Routing Protocol is "eigrp 90"
Outgoing update filter list for all interfaces is
Incoming update filter list for all interfaces is
Default networks flagged in outgoing updates
Default networks accepted from incoming updates
8-8 Semester 8 Internetwork Troubleshooting v1.0 - Lab 4.6.3 Copyright 2001, Cisco Systems, Inc.
EIGRP metric weight K1=1, K2=0, K3=1, K4=0, K5=0
EIGRP maximum hopcount 100
EIGRP maximum metric variance 1
Redistributing: igrp 90, eigrp 90
Automatic network summarization is in effect
Automatic address summarization:
192.168.0.0/24 for Ethernet0, Loopback0, Loopback1
Loopback2, Loopback3, Loopback4
192.168.40.0/24 for Ethernet0, Loopback0, Loopback1
Loopback2, Loopback4, Serial0
Routing for Networks:
192.168.0.0
192.168.40.0
Routing Information Sources:
Gateway Distance Last Update
192.168.0.2 90 06:20:55
Distance: internal 90 external 170
The RIP output displays the networks using RIP, that version 2 is being used, the
various timers and the Administrative Distance. The IGRP metric weights show
that the metric has not been modified.
Routing Protocol is "rip"
Sending updates every 30 seconds, next due in 24 seconds
Invalid after 180 seconds, hold down 180, flushed after 240
Outgoing update filter list for all interfaces is
Incoming update filter list for all interfaces is
Redistributing: rip
Default version control: send version 2, receive version 2
Interface Send Recv Triggered RIP Key-chain
Ethernet0 2 2
Serial0 2 2
Routing for Networks:
192.168.0.0
192.168.1.0
Interface Send Recv Triggered RIP Key-chain
192.168.4.0
Routing Information Sources:
Gateway Distance Last Update
192.168.0.2 120 00:00:25
Distance: (default is 120)
Note there is no similar command for either AppleTalk or IPX.
Step 7
The show protocols command.
Type the show protocols command to summarize each interface and the
network protocols associated with them. There is a Global values: summary of
all network protocols enabled on the router.
SanJose1#show protocols
Global values:
Internet Protocol routing is enabled
Appletalk routing is enabled
IPX routing is enabled
Ethernet0 is up, line protocol is up
Internet address is 192.168.1.1/24
AppleTalk address is 57.76, zone A
IPX address is 30.0010.7b3a.3f60
Loopback0 is up, line protocol is up
Internet address is 192.168.10.1/24
IPX address is 31.0000.1111.1111
Loopback1 is up, line protocol is up
Internet address is 192.168.20.1/24
IPX address is 32.0000.1111.1111
9-9 Semester 8 Internetwork Troubleshooting v1.0 - Lab 4.6.3 Copyright 2001, Cisco Systems, Inc.
Loopback2 is up, line protocol is up
Internet address is 192.168.30.1/24
IPX address is 33.0000.1111.1111
Loopback3 is up, line protocol is up
Internet address is 192.168.40.1/24
Loopback4 is up, line protocol is up
Internet address is 192.168.50.1/24
Serial0 is up, line protocol is up
Internet address is 192.168.0.1/24
AppleTalk address is 18.153, zone A
IPX address is 20.0000.1111.1111
Serial1 is administratively down, line protocol is down
SanJose1#
Step 8
The show ip traffic command.
Type the show ip traffic command to summarize IP protocol activity since
the last clear command or the router rebooted. The IP statistics summarizes the
broadcast and multicast activity as well as revealing that there were
encapsulation failures.
SanJose1#show ip traffic
IP statistics:
Rcvd: 50588 total, 20545 local destination
0 format errors, 0 checksum errors, 1 bad hop count
0 unknown protocol, 0 not a gateway
0 security failures, 0 bad options, 0 with options
Opts: 0 end, 0 nop, 0 basic security, 0 loose source route
0 timestamp, 0 extended security, 0 record route
0 stream ID, 0 strict source route, 0 alert, 0 cipso
0 other
Frags: 0 reassembled, 0 timeouts, 0 couldn't reassemble
0 fragmented, 0 couldn't fragment
Bcast: 2403 received, 378 sent
Mcast: 13923 received, 15700 sent
Sent: 21297 generated, 26539 forwarded
Drop: 10 encapsulation failed, 0 unresolved, 0 no adjacency
555 no route, 0 unicast RPF, 0 forced drop
Type the ICMP statistics will vary depending on whether you did the ping and
trace exercises during this session
ICMP statistics:
Rcvd: 0 format errors, 0 checksum errors, 0 redirects, 4 unreachable
2891 echo, 15 echo reply, 16 mask requests, 0 mask replies, 0 quench
0 parameter, 0 timestamp, 0 info request, 0 other
8 irdp solicitations, 0 irdp advertisements
Sent: 0 redirects, 262 unreachable, 22 echo, 2831 echo reply
0 mask requests, 0 mask replies, 0 quench, 0 timestamp
0 info reply, 0 time exceeded, 0 parameter problem
0 irdp solicitations, 0 irdp advertisements
UDP statistics:
Rcvd: 3051 total, 1263 checksum errors, 1787 no port
Sent: 2723 total, 0 forwarded broadcasts
TCP statistics:
Rcvd: 1343 total, 0 checksum errors, 0 no port
Sent: 2104 total
Probe statistics:
Rcvd: 0 address requests, 0 address replies
0 proxy name requests, 0 where-is requests, 0 other
Sent: 0 address requests, 0 address replies (0 proxy)
0 proxy name replies, 0 where-is replies
10-10 Semester 8 Internetwork Troubleshooting v1.0 - Lab 4.6.3 Copyright 2001, Cisco Systems, Inc.
EGP statistics:
Rcvd: 0 total, 0 format errors, 0 checksum errors, 0 no listener
Sent: 0 total
IGRP statistics:
Rcvd: 0 total, 0 checksum errors
Sent: 303 total
OSPF statistics:
Rcvd: 2508 total, 0 checksum errors
2446 hello, 3 database desc, 0 link state req
14 link state updates, 14 link state acks
Sent: 2477 total
IP-IGRP2 statistics:
Rcvd: 10577 total
Sent: 10580 total
PIMv2 statistics: Sent/Received
Total: 0/0, 0 checksum errors, 0 format errors
Registers: 0/0, Register Stops: 0/0, Hellos: 0/0
Join/Prunes: 0/0, Asserts: 0/0, grafts: 0/0
Bootstraps: 0/0, Candidate_RP_Advertisements: 0/0
IGMP statistics: Sent/Received
Total: 0/0, Format errors: 0/0, Checksum errors: 0/0
Host Queries: 0/0, Host Reports: 0/0, Host Leaves: 00
DVMRP: 0/0, PIM: 0/0
ARP statistics:
Rcvd: 351 requests, 0 replies, 0 reverse, 0 other
Sent: 0 requests, 10 replies (0 proxy), 29 reverse
SanJose1#
Step 9
The show cdp neighbor [detail] command.
Type the show cdp neighbor command to use the Cisco Discovery Protocol
to gather information on adjacent devices. The lab output should show a router
on one side and a switch on the other. Keep in mind that only Cisco devices will
be detected.
SanJose1# show cdp neighbors
Capability Codes: R - Router, T - Trans Bridge, B - Source Route Bridge
S - Switch, H - Host, I - IGMP, r - Repeater
Device ID Local Intrfce Holdtme Capability Platform Port ID
Switch Eth 0 143 T S WS-C2924M-Fas 0/22
SanJose2 Ser 0 164 R 2524 Ser 0
SanJose1#
Type the show cdp neighbor detail command to get a more in depth view
of the neighbor devices. In the following output we see that the unnamed switch
is a model 2924M-XL running version 12.0(5) of the IOS. The router SanJose2 is
a 2524 running version 12.0(5)T of the IOS and is configured to support IP,
Novell, and Appletalk. We also have one interface address for each protocol.
SanJose1# show cdp neighbors detail
Device ID: Switch
Entry address(es):
Platform: cisco WS-C2924M-XL, Capabilities: Trans-Bridge Switch
Interface: Ethernet0, Port ID (outgoing port): FastEthernet0/22
Holdtime : 136 sec
11-11 Semester 8 Internetwork Troubleshooting v1.0 - Lab 4.6.3 Copyright 2001, Cisco Systems, Inc.
Version :
Cisco Internetwork Operating System Software
IOS (tm) C2900XL Software (C2900XL-C3H2S-M), Version 12.0(5)XU, RELEASE SOFTWARE
(fc1)
Copyright (c) 1986-2000 by cisco Systems, Inc.
Compiled Mon 03-Apr-00 16:37 by swati
advertisement version: 2
Protocol Hello: OUI=0x00000C, Protocol ID=0x0112; payload len=27, value=0000000
0FFFFFFFF010121FF000000000000000216A7E140FF0001
VTP Management Domain: 'test'
Device ID: SanJose2
Entry address(es):
IP address: 192.168.0.2
Novell address: 20.0000.2222.2222
Appletalk address: 18.185
Platform: cisco 2524, Capabilities: Router
Interface: Serial0, Port ID (outgoing port): Serial0
Holdtime : 152 sec
Version :
Cisco Internetwork Operating System Software
IOS (tm) 2500 Software (C2500-D-L), Version 12.0(5)T, RELEASE SOFTWARE (fc1)
Copyright (c) 1986-1999 by cisco Systems, Inc.
Compiled Fri 23-Jul-99 03:53 by kpma
advertisement version: 2
SanJose1#
Step 10
The show tcp commands.
Type the show tcp ? command to see TCP activity. Particularly the show
tcp statistics command gives a good summary of TCP traffic sent and
received.
SanJose1#show tcp ?
<0-6> Line number
aux Auxiliary line
brief Brief display
console Primary terminal line
statistics TCP protocol statistics
tcb TCB address
vty Virtual terminal
| Output modifiers
<cr>
SanJose1#show tcp statistics
Rcvd: 60 Total, 0 no port
0 checksum error, 0 bad offset, 0 too short
47 packets (459 bytes) in sequence
0 dup packets (0 bytes)
0 partially dup packets (0 bytes)
0 out-of-order packets (0 bytes)
0 packets (0 bytes) with data after window
0 packets after close
0 window probe packets, 0 window update packets
0 dup ack packets, 0 ack packets with unsend data
54 ack packets (85 bytes)
Sent: 100 Total, 0 urgent packets
2 control packets (including 0 retransmitted)
55 data packets (83 bytes)
0 data packets (0 bytes) retransmitted
43 ack only packets (40 delayed)
0 window probe packets, 0 window update packets
1 Connections initiated, 0 connections accepted, 1 connections established
12-12 Semester 8 Internetwork Troubleshooting v1.0 - Lab 4.6.3 Copyright 2001, Cisco Systems, Inc.
1 Connections closed (including 0 dropped, 0 embryonic dropped)
0 Total rxmt timeout, 0 connections dropped in rxmt timeout
0 Keepalive timeout, 0 keepalive probe, 0 Connections dropped in keepalive
SanJose1#show tcp brief
Step 11
The debug ip rip command.
Type the debug ip rip command to see the result of RIP routing activities.
The timestamp on the left side shows the frequency of the updates is about 30
seconds, as we would expect (11:15:15 and 11:15:42 entries). The v2 indicates
version 2 RIP.
Notice that you can see the source of received updates and the details of each
route, including the hop count. The outgoing updates are sent to a multicast
address (224.0.0.9)
SanJose1#debug ip rip
RIP protocol debugging is on
SanJose1#
11:15:15: RIP: received v2 update from 192.168.0.2 on Serial0
11:15:15: 192.168.2.0/24 via 0.0.0.0 in 1 hops
11:15:15: 192.168.3.0/24 via 0.0.0.0 in 1 hops
11:15:15: 192.168.90.0/24 via 0.0.0.0 in 1 hops
11:15:15: 192.168.91.0/24 via 0.0.0.0 in 1 hops
SanJose1#
11:15:20: RIP: sending v2 update to 224.0.0.9 via Ethernet0 (192.168.1.1)
11:15:20: RIP: build update entries
11:15:20: 192.168.0.0/24 via 0.0.0.0, metric 1, tag 0
11:15:20: 192.168.2.0/24 via 0.0.0.0, metric 2, tag 0
11:15:20: 192.168.3.0/24 via 0.0.0.0, metric 2, tag 0
11:15:20: 192.168.90.0/24 via 0.0.0.0, metric 2, tag 0
11:15:20: 192.168.91.0/24 via 0.0.0.0, metric 2, tag 0
11:15:20: RIP: sending v2 update to 224.0.0.9 via Ethernet0 (192.168.4.1)
11:15:20: RIP: build update entries
11:15:20: 192.168.0.0/24 via 0.0.0.0, metric 1, tag 0
11:15:20: 192.168.2.0/24 via 0.0.0.0, metric 2, tag 0
11:15:20: 192.168.3.0/24 via 0.0.0.0, metric 2, tag 0
11:15:20: 192.168.90.0/24 via 0.0.0.0, metric 2, tag 0
11:15:20: 192.168.91.0/24 via 0.0.0.0, metric 2, tag 0
11:15:20: RIP: sending v2 update to 224.0.0.9 via Serial0 (192.168.0.1)
11:15:20: RIP: build update entries
11:15:20: 192.168.1.0/24 via 0.0.0.0, metric 1, tag 0
11:15:20: 192.168.4.0/24 via 0.0.0.0, metric 1, tag 0
SanJose1#
11:15:42: RIP: received v2 update from 192.168.0.2 on Serial0
11:15:42: 192.168.2.0/24 via 0.0.0.0 in 1 hops
Try the debug ip rip ? command to see the optional parameters. There are
three options. Try the debug ip rip database command to see the actual
entries as they are added to the RIP database.
SanJose1#debug ip rip ?
database RIP database events
events RIP protocol events
trigger RIP trigger extension
<cr>
SanJose1#debug ip rip database
RIP database events debugging is on
SanJose1#
11:30:05: RIP-DB: network_update with 192.168.2.0/24 succeeds
11:30:05: RIP-DB: adding 192.168.2.0/24 (metric 1) via 192.168.0.2 on Serial0 to
RIP database
11:30:05: RIP-DB: network_update with 192.168.3.0/24 succeeds
13-13 Semester 8 Internetwork Troubleshooting v1.0 - Lab 4.6.3 Copyright 2001, Cisco Systems, Inc.
11:30:05: RIP-DB: adding 192.168.3.0/24 (metric 1) via 192.168.0.2 on Serial0 to
RIP database
11:30:05: RIP-DB: network_update with 192.168.90.0/24 succeeds
11:30:05: RIP-DB: adding 192.168.90.0/24 (metric 1) via 192.168.0.2 on Serial0 t
o RIP database
11:30:05: RIP-DB: network_update with 192.168.91.0/24 succeeds
11:30:05: RIP-DB: adding 192.168.91.0/24 (metric 1) via 192.168.0.2 on Serial0 t
o RIP database
SanJose1#
Try the debug ip rip events command to see a summary of the routing
updates without the individual route entries. The first nine lines (sample below)
log the individual transmissions, which is followed by a three-line summary
(highlighted). The received updates are logged (11:35:39 entries).
SanJose1#debug ip rip events
RIP event debugging is on
SanJose1#
11:35:38: RIP: sending v2 update to 224.0.0.9 via Ethernet0 (192.168.1.1)
11:35:38: RIP: Update
contains 5 routes
11:35:38: RIP: Update queued
11:35:38: RIP: sending v2 update to 224.0.0.9 via Ethernet0 (192.168.4.1)
11:35:38: RIP: Update contains 5 routes
11:35:38: RIP: Update queued
11:35:38: RIP: sending v2 update to 224.0.0.9 via Serial0 (192.168.0.1)
11:35:38: RIP: Update contains 2 routes
11:35:38: RIP: Update queued
11:35:38: RIP: Update sent via Ethernet0
11:35:38: RIP: Update sent via Ethernet0
11:35:38: RIP: Update sent via Serial0
11:35:39: RIP: received v2 update from 192.168.0.2 on Serial0
11:35:39: RIP: Update contains 4 routes
SanJose1#
11:36:04: RIP: sending v2 update to 224.0.0.9 via Ethernet0 (192.168.1.1)
Try the debug ip rip trigger command to see a log of when routing
updates are sent without any detail information. Notice the variation in time
intervals which reduces the likelihood of multiple devices repeatedly updating at
the same time.
SanJose1#debug ip rip trigger
RIP trigger debugging is on
SanJose1#
11:41:38: RIP-TIMER: periodic timer expired
SanJose1#
11:42:07: RIP-TIMER: periodic timer expired
SanJose1#
11:42:35: RIP-TIMER: periodic timer expired
SanJose1#
11:43:02: RIP-TIMER: periodic timer expired
SanJose1#un all
All possible debugging has been turned off
SanJose1#
Step 12
The debug ip ospf command.
Type the debug ip ospf ? command to see the options for debugging OSPF
routing activity. The debug ip ospf events command logs each OSPF
activity with route, area, source interface, and source address information.
SanJose1#debug ip ospf ?
adj OSPF adjacency events
database-timer OSPF database timer
14-14 Semester 8 Internetwork Troubleshooting v1.0 - Lab 4.6.3 Copyright 2001, Cisco Systems, Inc.
events OSPF events
flood OSPF flooding
lsa-generation OSPF lsa generation
packet OSPF packets
retransmission OSPF retransmission events
spf OSPF spf
tree OSPF database tree
SanJose1#debug ip ospf events
OSPF events debugging is on
SanJose1#
11:50:35: OSPF: Rcv hello from 192.168.96.1 area 0 from Serial0 192.168.0.2
11:50:35: OSPF: End of hello processing
SanJose1#
11:50:45: OSPF: Rcv hello from 192.168.96.1 area 0 from Serial0 192.168.0.2
11:50:45: OSPF: End of hello processing
SanJose1#
Remember that OSPF routing updates are triggered events, so you may need to
trigger a link change to see anything but Hello packets.
Step 13
The debug ip eigrp ? command.
Type the debug ip eigrp ? command to see the options for debugging
EIGRP routing activity. As with OSPF, EIGRP routing updates are triggered
events, so you may need to trigger a link or database change to see anything
happen. In the following example, after waiting several minutes during which time
nothing happened, I cleared the Neighbor database. Try the steps shown below.
You should see both sent and received updates.
SanJose1#debug ip eigrp ?
<1-65535> AS number
neighbor IP-EIGRP neighbor debugging
notifications IP-EIGRP event notifications
summary IP-EIGRP summary route processing
<cr>
SanJose1#debug ip eigrp
IP-EIGRP Route Events debugging is on
SanJose1#clear ip eigrp neighbor
SanJose1#
12:06:39: IP-EIGRP: 192.168.0.0/24 - do advertise out Serial0
12:06:39: IP-EIGRP: 192.168.50.0/24 - do advertise out Serial0
12:06:39: IP-EIGRP: Ext 192.168.50.0/24 metric 128256 - 256 128000
12:06:39: IP-EIGRP: 192.168.40.0/24 - do advertise out Serial0
12:06:39: IP-EIGRP: Int 192.168.40.0/24 metric 128256 - 256 128000
SanJose1#
12:06:41: IP-EIGRP: 192.168.0.0/24 - do advertise out Serial0
12:06:41: IP-EIGRP: 192.168.50.0/24 - do advertise out Serial0
12:06:41: IP-EIGRP: Ext 192.168.50.0/24 metric 128256 - 256 128000
12:06:41: IP-EIGRP: 192.168.40.0/24 - do advertise out Serial0
12:06:41: IP-EIGRP: Int 192.168.40.0/24 metric 128256 - 256 128000
SanJose1#
12:06:42: IP-EIGRP: Processing incoming UPDATE packet
12:06:42: IP-EIGRP: Ext 192.168.60.0/24 M 2297856 - 1657856 640000 SM 128256 - 2
56 128000
12:06:42: IP-EIGRP: Ext 192.168.70.0/24 M 2297856 - 1657856 640000 SM 128256 - 2
56 128000
12:06:42: IP-EIGRP: Int 192.168.80.0/24 M 2297856 - 1657856 640000 SM 128256 - 2
56 128000
12:06:44: IP-EIGRP: 192.168.0.0/24 - do advertise out Serial0
12:06:44: IP-EIGRP: 192.168.50.0/24 - do advertise out Serial0
15-15 Semester 8 Internetwork Troubleshooting v1.0 - Lab 4.6.3 Copyright 2001, Cisco Systems, Inc.
12:06:44: IP-EIGRP: Ext 192.168.50.0/24 metric 128256 - 256 128000
12:06:44: IP-EIGRP: 192.168.40.0/24 - do advertise out Serial0
12:06:44: IP-EIGRP: Int 192.168.40.0/24 metric 128256 - 256 128000
12:06:44: IP-EIGRP: Ext 192.168.60.0/24 metric 2297856 - 1657856 640000
12:06:44: IP-EIGRP: Ext 192.168.70.0/24 metric 2297856 - 1657856 640000
12:06:44: IP-EIGRP: Int 192.168.80.0/24 metric 2297856 - 1657856 640000
12:06:44: IP-EIGRP: Processing incoming UPDATE packet
12:06:44: IP-EIGRP: ExtS 192.168.50.0/24 M 4294967295 - 1657856 4294967295 SM 42
94967295 - 1657856 4294967295
12:06:44: IP-EIGRP: Int 192.168.40.0/24 M 4294967295 - 1657856 4294967295 SM 429
4967295 - 1657856 4294967295
SanJose1#un all
Try other EIGRP options.
Step 14
The debug ip igrp ? command.
Type the debug ip igrp ? command to see the options for debugging IGRP
routing activity. As a distance vector protocol the updates are regular, but at a
90-second interval, so be patient. The debug ip igrp events command
shows a summary of activity while the debug ip igrp transactions
command shows the details.
SanJose1#debug ip igrp ?
events IGRP protocol events
transactions IGRP protocol transactions
SanJose1#debug ip igrp events
IGRP event debugging is on
SanJose1#
12:20:43: IGRP: sending update to 255.255.255.255 via Loopback4 (192.168.50.1)
12:20:43: IGRP: Update contains 0 interior, 5 system, and 0 exterior routes.
12:20:43: IGRP: Total routes in update: 5
SanJose1#un all
All possible debugging has been turned off
SanJose1#debug ip igrp transactions
IGRP protocol debugging is on
SanJose1#
12:22:05: IGRP: sending update to 255.255.255.255 via Loopback4 (192.168.50.1)
12:22:05: network 192.168.60.0, metric=8976
12:22:05: network 192.168.40.0, metric=501
12:22:05: network 192.168.80.0, metric=8976
12:22:05: network 192.168.0.0, metric=8476
12:22:05: network 192.168.70.0, metric=8976
SanJose1#
12:23:24: IGRP: sending update to 255.255.255.255 via Loopback4 (192.168.50.1)
12:23:24: network 192.168.60.0, metric=8976
12:23:24: network 192.168.40.0, metric=501
12:23:24: network 192.168.80.0, metric=8976
12:23:24: network 192.168.0.0, metric=8476
12:23:24: network 192.168.70.0, metric=8976
SanJose1#un all
There probably shouldn’t be any incoming updates on either router because
EIGRP is used on the serial link.
Step 15
The debug ip icmp command.
Type the debug ip icmp command to see the results of ping and trace activity.
The Cisco trace and TCP/IP tracert commands both use the TTL feature in a
16-16 Semester 8 Internetwork Troubleshooting v1.0 - Lab 4.6.3 Copyright 2001, Cisco Systems, Inc.
rather clever way. The trace (or tracert) command sends three IP packets to
the destination with the TTL set to 1, three with the TTL set to 2, etc.
When the three with the TTL set to 1 reach the first router, the 1 is decremented
to 0 and the packet is discarded. A “Time Exceeded” message is sent to the
source. The source now knows the IP address of the first router from the
message IP header. The packets with the TTL set to 2 are discarded by the
second router and an ICMP message sent. This continues until there is a trail to
the destination device.
The final router returns an ICMP destination unreachable reply.
The following is an example. After running the debug ip icmp command, ping
the host on the other router to confirm its existence and connectivity. Then run a
trace command to the same host and look over the results.
SanJose1#debug ip icmp
ICMP packet debugging is on
SanJose1#ping 192.168.2.10
Type escape sequence to abort.
Sending 5, 100-byte ICMP Echos to 192.168.2.10, timeout is 2 seconds:
!!!!!
Success rate is 100 percent (5/5), round-trip min/avg/max = 36/39/40 ms
SanJose1#
12:35:22: ICMP: echo reply rcvd, src 192.168.2.1, dst 192.168.0.1
12:35:22: ICMP: echo reply rcvd, src 192.168.2.1, dst 192.168.0.1
12:35:22: ICMP: echo reply rcvd, src 192.168.2.1, dst 192.168.0.1
12:35:22: ICMP: echo reply rcvd, src 192.168.2.1, dst 192.168.0.1
12:35:22: ICMP: echo reply rcvd, src 192.168.2.1, dst 192.168.0.1
SanJose1#
SanJose1#trace 192.168.2.10
Type escape sequence to abort.
Tracing the route to 192.168.2.10
1 192.168.0.2 20 msec * 20 msec
SanJose1#
12:36:37: ICMP: dst (192.168.0.1) port unreachable rcv from 192.168.0.2
SanJose1#
12:36:40: ICMP: dst (192.168.0.1) port unreachable rcv from 192.168.0.2
SanJose1#
Note
Other debug and show commands will be covered in detail in later chapters
where their usage can be tied to a troubleshooting activity.