Tài liệu Creating an Event Monitor for Statements doc
Bạn đang xem bản rút gọn của tài liệu. Xem và tải ngay bản đầy đủ của tài liệu tại đây (728.41 KB, 15 trang )
Creating an Event Monitor for Statements
• A table event monitor streams event records to SQL tables, this makes capture, parsing, and
management of event monitoring data easy
• Need SYSADM or DBADM to create a table event monitor
• Syntax:
CREATE EVENT MONITOR stmtmon
FOR STATEMENTS
WHERE APPL_NAME = ‘NEWAPP’ AND
AUTH_ID = ‘BBDS’
WRITE TO TABLE IN event_tblspace
CONNHEADER(TABLE STMT_EVT_CH,
IN TBS_EVMON),
= REDUCE IMPACT
STMT(TABLE STMT_EVT_STMT, IN TBS_EVMON, TRUNC),
CONTROL(TABLE STMT_EVT_CTRL, IN TBS_EVMON)
BUFFERSIZE 2000
NONBLOCKED
OR
WRITE TO FILE '/tmp/dlevents‘
OR
WRITE TO PIPE '/home/riihi/dlevents'
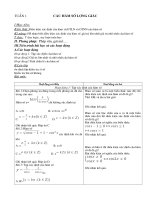
Sample Output: Statement Event Monitor Query
SQL Monitoring
Interfaces
• Administrative Views
¾ Easy-to-use application programming interface
¾ Execute administrative functions through SQL
• Table functions MON_GET_
¾ Introduced in DB2 9.7
¾ Enhanced reporting and monitoring of the database
system, data objects, and the package cache
¾ Lightweight - has a lower impact on the system than
existing system monitor and snapshot interfaces
Examples of SQL interfaces – Finding Costly SQL
• Administrative Views
¾ LONG_RUNNING_SQL (Time, Statement, Status)
¾ QUERY_PREP_COST (High Prep Times, % of Exec)
¾ TOP_DYNAMIC_SQL (Exec Time, Sorts)
• Table Functions
¾ MON_GET_ACTIVITY_DETAILS ( Executing v. Waiting)
¾ MON_GET_PKG_CACHE_STMT ( Filtering Options)
SQL – High CPU TIME
Example: List top 10 SQL statements by cpu_time
SELECT MEMBER, SECTION_TYPE ,
varchar(stmt_text,200) as statement,
num_exec_with_metrics as numExec,
TOTAL_CPU_TIME/NUM_EXEC_WITH_METRICS as AVG_CPU_TIME,
TOTAL_CPU_TIME
FROM TABLE(
MON_GET_PKG_CACHE_STMT ( 'D', NULL, NULL, -2)) as T
WHERE T.NUM_EXEC_WITH_METRICS <> 0
ORDER BY AVG_CPU_TIME desc
fetch first 10 rows only;
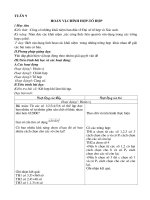
Results from Top Ten CPU consumers.
•
VISUAL EXPLAIN
Analyzing SQL
• EXPLAIN TOOLS
Now we will see,
precisely how, and
how well
the
costly
SQL
executes
SQL Explain Tools
• Graphical
¾ Easy to quickly spot the problem
¾ Provides drill down functionality
¾ Multiple images can be stored for
comparison
• Text Based
¾ Can be used with any interface
¾ All the information is contained on a single
screen
¾ Available on all platforms
¾ Format output with db2exfmt
22
© 2010 IBM Corporation
Why use Explain?
• To seek performance tuning opportunities
¾ How are tables being accessed?
¾ How useful are additional indexes?
¾ Does rewriting the query help?
• Comparisons: To understand changes in query performance due to:
¾ Changes in the data model
¾ Changes in the data
¾ Changes in configuration parameters
• View statistics used at time of optimization and current performance
VISUAL EXPLAIN
How to use Visual Explain
• Invoke from
¾ Data Studio toolset
¾ Control Center
• Enter SQL to be analyzed
¾ Trap the poor running SQL statement either from your program,
performance monitors or create a brand new statement
¾ The text can then just be typed or copied into the input box
• Output
¾ Explain Information stored in Explain Tables
¾Detailed information
¾Manipulate Explain information using SQL
¾ Access Plan Graph
• For dynamic and static SQL statements
Visual Explain Interface
• Every object in the visual explain interface can be drilled down for
additional information
• Cost
¾ The estimated total resource usage necessary to execute the access plan for
a statement. The unit of cost is the timeron
• Timeron
¾ Timeron is a combination of CPU cost (in number of instructions) and I⁄O (in
numbers of seeks and page transfers)
¾ In general if you have a larger number of timerons your query will run slower
• All of the run times of the individual components are cumulative and are
measured in timerons
Visual Explain Interface – Access Plan Diagram
Visual Explain Interface – View SQL Statement