Tài liệu HPLC for Pharmaceutical Scientists 2007 (Part 12) doc
Bạn đang xem bản rút gọn của tài liệu. Xem và tải ngay bản đầy đủ của tài liệu tại đây (277.44 KB, 27 trang )
12
ROLE OF HPLC IN
PREFORMULA
TION
Irina Kazakevich
12.1 INTRODUCTION
Preformulation is a bridge between discovery and development where devel-
opment scientists participate in selection and optimization of lead compounds.
It is very critical at this stage to evaluate the developability of potential drug
candidates in order to select new chemical entities and decrease the number
of failures during future drug development.
On average, only one out of ten new chemical entities (NCE) entering first-
in-human testing reaches registration, approval, and marketing stage. The
reasons for failures of development compounds include problems with bio-
pharmaceutical properties, clinical safety, toxicology, efficacy, cost of goods,
and marketing (see Figure 12-1) [1, 2]. The biopharmaceutical properties such
as gastrointestinal and plasma solubility, lipophilicity (LogD), permeability,
first-pass metabolism, systemic metabolism, protein binding, and in vivo
bioavailability are related to the solubility, chemical stability, and permeabil-
ity of drug candidates and have to be considered at discovery lead selection
before recommendation to the development stage.
A major challenge in any drug discovery program is achieving reasonable
bioavailability upon oral administration; therefore, any information that high-
lights potential problems with cell permeability and absorption is valuable
when reviewing structural families as leads for drug discovery. Lipinski et al.
[3] have reviewed 2245 compounds selected from the United States Adopted
577
HPLC for Pharmaceutical Scientists, Edited by Yuri Kazakevich and Rosario LoBrutto
Copyright © 2007 by John Wiley & Sons, Inc.
Name (USAN), International Nonproprietary Name (INN), and World Drug
Index (WDI),
comparing calculated physical properties and clinical exposure.
Four parameters were chosen that were associated with solubility and per-
meability, namely, molecular weight, octanol/water partition coefficient, the
number of hydrogen bond donors, and the number of hydrogen bond
acceptors. It was concluded that compounds are most likely to have poor
absorption when molecular weight is >500, the calculated LogP is >5, the
number of hydrogen bond donors is >5, and the number of hydrogen bond
acceptors is >10. Lipinski has referred to this analysis as “rule of five” because
the cutoffs for each of the four parameters were all close to five or a multiple
of five. The rule of five can serve as qualitative absorption/permeability
predictor.
The absorption of drug molecules in the gastrointestinal tract is dependent
upon the pK
a
of the compound and the pH of the gastrointestinal region
(Figure 12-2). Almost 63% of all drugs are ionized in aqueous solution and
can exist in a neutral or a charged state, depending on the pH of the local
environment [4].
Based on the major goal of preformulation—identification of possible
failure in future development—numerous studies are performed to fully char-
acterize prospective drug candidates. The major analytical technique in each
preformulation group is liquid chromatography. Ninety percent of all ana-
lytical equipment in preformulation groups are HPLC systems equipped with
UV and MS detection systems. HPLC is a fast and reliable method for con-
centration and identity determination by UV and/or MS detection, respec-
tively.The type of HPLC methods differ based on the specific preformulation
tests that will be described below.
In the early stage of preformulation, characterization of the drug molecule
involves ionization constants and partition coefficient determinations, aqueous
and nonaqueous kinetic and equilibrium solubility determination, pH solubil-
ity profile, chemical stability assessment, and salt and polymorph screening.
Assessment of biopharmaceutics and toxicological screening are also essential
578 ROLE OF HPLC IN PREFORMULATION
Figure 12-1. Reasons for attrition from 1991 to 2000. (Reprinted with permission from
reference 1.)
at this stage. At the later stage of preformulation, after recommendation of
NCE to development,
the development support from preformulation group
involves a more detailed solid-state characterization program, elaborating on
moisture sorption, compressibility, melting point, particle size, shape, and
surface area assessments, as well as excipient compatibility and prototype for-
mulation stability evaluation.
Further information on the role of preformulation in drug development
process can be found in several excellent monographs [6–8] with the focus on
pharmaceutical aspects of process development.
12.2 INITIAL PHYSICOCHEMICAL CHARACTERIZATION
(DISCOVERY SUPPORT)
During the early discovery stage the medicinal chemists use in vitro activities
and fast in vivo small animal studies to discover the best compound to develop.
The support from development scientist consists of providing information
about LogP, pK
a
, and LogD for ionizable drugs and aqueous solubility. These
physical characteristics can affect the absorption of drug candidate and, there-
fore, drug bioaivalability.The requirements for HPLC analysis at this stage are
speed and efficiency of the separation. It is critical to mention that at the early
stage of discovery, very little information is available about the properties of
INITIAL PHYSICOCHEMICAL CHARACTERIZATION (DISCOVERY SUPPORT) 579
Figure 12-2. Physical properties of the gastrointestinal tract. (Reprinted with permis-
sion from reference 5.)
molecule and only a few milligrams of compound is available for characteri-
zation.
Therefore, it is important to choose the most efficient column and the
simplest mobile phase. Also, recommended is the use of more contemporary
HPLC systems as UPLC from Waters employing columns with dimensions of
50 × 2.1mm, 1.8-µm particle size and the Fast 1200 system from Agilent with
column dimensions of 50 × 4.6mm, 1.8-µm particle size, respectively, to
enhance the turnaround time for sample analysis. Other platforms would
include using Chromolith Speedrod
®
monolithic columns at high flow rates.
Also, taking into consideration the short column length, gradient elution
should be recommended for all HPLC methods at this stage of drug candidate
characterization. The post-run equilibration time is not significant in the case
where short columns are used, and dwell volume is improved significantly for
a new generation of HPLC systems.
Many types of modeling techniques are available in the discovery phase of
drug development, from structure activity relationships (SAR) to physiology
based pharmacokinetics (PBPK) and pharmacokinetics-/pharmacodynamics
(PK/PD) to help choosing some of the lead compounds. Some tests that are
carried out by discovery include techniques related to structure determina-
tion, metabolism, and permeability: NMR, MS/MS, elemental analysis,
PAMPA, CACO-2, and in vitro metabolic stability. Although they are impor-
tant as a part of physicochemical molecular characterization under the bio-
pharmaceutics umbrella, they will not be discussed here. The reader can find
relevant information in numerous monographs [9, 10].
12.2.1 Ionization Constant, pK
a
Most potential drug candidates are weak bases or acids. Solubility and many
other properties of the drug molecule is dependent on its ionization state.
Acids are usually considered to be proton donors and bases are proton accep-
tors. Any drug molecule with basic functionality in aqueous media holds the
following equilibrium:
(12-1)
where the ionization equilibrium constant could be expressed as
(12-2)
It is obvious from the above equilibrium that the ratio of ionic to nonionic
form of the drug in the solution is controlled by the proton concentration,
which is commonly represented by pH values (negative logarithm of proton
concentration). Taking the negative logarithm of expression (12-2), the well-
known Henderson–Hasselbalch equation could be obtained:
K
a
=
[]
⋅
[]
[]
+
BH
BH
+
BH B H
+
↔+
+
580 ROLE OF HPLC IN PREFORMULATION
(12-3)
T
his allows for the estimation of the prevailing drug form at a particular pH.
Ionic form of any organic molecule is usually more soluble in aqueous media,
while the neutral form is usually more hydrophobic and thus shows an
increased affinity for lipids.
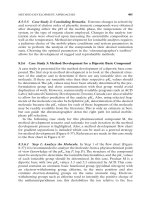
Variation of the ionization state of the molecule at different pH has typical
sigmoidal shape (as shown in Figure 12-3). Corresponding expression for this
dependence could be derived from equation (12-2) and the mass balance of
the ionic and nonionic form of the drug:
(12-4)
If one assumes quantity q equal to 100, then concentration of B or BH
+
forms
will numerically be equal to the percentage of corresponding form in the solu-
tion and solving equation (12-3) with expression (12-4) one will get the expres-
sion for BH
+
concentration expressed as a percent of ionized form
(12-5)
The inflection point of this curve corresponds to the point where pH = pK
a
,
and it is a common way for the determination of the drug pK
a
values.
Several different techniques are usually employed for pK
a
determination.
They were described in detail by Comer [11].
BH
ppH
ppH
+
−
()
−
()
[]
=
⋅
+
100 10
110
K
K
a
a
q =
[]
+
[]
+
BBH
ppH
BH
B
K
a
=+
[]
[]
+
log
INITIAL PHYSICOCHEMICAL CHARACTERIZATION (DISCOVERY SUPPORT) 581
Figure 12-3. Dependence of the relative amount (in the form of a percent) of proto-
nated form on the pH of aqueous media.
In practice the most common technique to determine pK
a
value is by
employing potentiometric titration based on the detection of the variations of
either the conductivity or current at fixed applied potential at various pH
values
.The automated potentiometric titration system well known as a GLpK
a
or PCA200 from Sirius Analytical [12] is considered to be a good approach
for pK
a
determination with water-soluble drugs at pH 2–8 for the new drug
candidates when the amount of drug substance is limited. For poorly water-
soluble compounds it is advised to use GlpK
a
with D-Pass or Sirius Profiler
SGA as a pH/UV method for determination of compounds that have inher-
ently lower concentration in the solution media.
HPLC is another convenient method for measurement of the NCE pK
a
values. As was shown by Melander and Horvath [13], the retention of any
ionizable analyte closely resembles the curve shown in Figure 12-3. Chro-
matographic determination of the pK
a
could be accurately performed with
very limited amount of sample. Fast HPLC method with optimum analyte
retention is suitable for this purpose, but the influence of the organic mobile-
phase modifier on the mobile phase pH and analyte pK
a
should be accounted
for in order to provide the accurate calculation of the respective pK
a
value.
Detailed discussion of the HPLC-based methods for the pK
a
determination is
given in Chapter 4.
In the case of sufficient drug supply the old-fashioned solubility method can
be used for pK
a
determination based on the different equilibrium solubility
at different pH values. This method is very precise, but time- and drug-
consuming, and is described in detail in reference 6.
Drug substance often contains several ionizable groups that may signifi-
cantly complicate experimental measurement of the pK
a
. All different types
of pK
a
determination methods are essentially based on the measurement of
the titration curve. If the pK
a
values of several ionizable groups in the mole-
cule are within 2 pH units from each other, experimental measurement
become very tedious. Recent advancements in the molecular computational
methods and developments of physicochemical databases for a large number
of known compounds allow computer-based prediction of the pK
a
values on
the basis of known physicochemical correlations and fast computer screening
of known values for related or structurally similar compounds from the data-
base. Detailed discussion of these programs is given in Chapter 10.
12.2.2 Partition and Distribution Coefficients
One of the most important physicochemical parameters associated with oral
absorption, central nervous system (CNS) penetration, and other pharmaco-
kinetic parameters is lipophilicity of organic compounds, which determines
distribution of a molecule between the aqueous and the lipid environments.
The lipophilicity in the form of LogP was included in Lipinski’s rule of five as
one of the major characteristics of drug-like organic molecules. It was stated
that LogP should be not more than five for drug candidates to have a good
582 ROLE OF HPLC IN PREFORMULATION
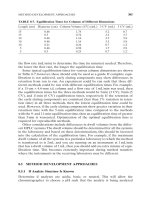
oral absorption property. In Table 12-1, some LogP values for various types of
dosage forms are given.
T
he partition coefficient itself is a constant and is defined as the ratio of
concentration of compound in aqueous phase to the concentration in an
immiscible solvent, as the neutral molecule. In practical terms the neutral mol-
ecule exists for bases >2 pH units above pK
a
and for acids >2 pH units below
pK
a
. In practice, log P will vary according to the conditions under which it is
measured and the choice of partitioning solvent. LogP is the logarithm of dis-
tribution coefficient at a pH where analyte is in its neutral state. This is not a
constant and will vary according to the protogenic nature of the molecule.
The choice of partition solvent has been a subject of debate. Different type
of solvents have been used for the determination of partitioning coefficient
[14], but the majority of the data are generated using water–n-octanol parti-
tioning. Octanol was chosen as a simple model of a phospholipid membrane.
However, it has shown serious shortcomings in predicting blood–brain barrier
or skin penetration. Other solvents such as chloroform, cyclohexane, and
propylene glycol dipelargonate (PGDP) have been used for modeling biolog-
ical membranes.
Octanol is a hydrogen-bonding solvent, and thus it shows certain specificity
in its ability to dissolve some components. For example, K
0
w
for phenol in
hexane is only 0.11 while in octanol it is equal to 29.5. There were several
attempts to rationalize solvent effects using solubility parameters [15], dielec-
tric constant [16], and others,but none appear to be consistent.n-Octanol gives
the most consistent results with other physicochemical properties and drug
absorption in gastrointestinal tract.
The classical measurement of LogP is the shake flask method [17].A known
amount of drug is dissolved in a flask containing both octanol phase and
aqueous buffer at controlled pH to ensure the existence of only nonionic form
(at least two units from the drug pK
a
). The flask is shaken to equilibrate the
sample between two phases. There must be no undissolved substance present
in both phases. After the system reaches its equilibrium, which is time- and
temperature-dependent, the concentration of drug is analyzed by HPLC in
both phases. Partitioning coefficient is calculated as
(12-6)
K
c
c
w
w
0
0
=
INITIAL PHYSICOCHEMICAL CHARACTERIZATION (DISCOVERY SUPPORT) 583
TABLE 12-1. Preferable Dosing Form for Different
LogP Regions
LogP Dosing Form
Low <0 Injectable
Medium 0–3 Oral
High 3–4 Transdermal
Very high 4–7 Toxic buildup in fatty acids
This method allows for the accurate determination of K
0
w
only within the −
1000 to +1000 region or approximately within six orders of magnitude span.
T
hese experiments could be complicated by solubility and equilibration kinet-
ics and the properties of a substance. For example, if a studied compound
has a property of nonionic surfactant, it will be mainly accumulated at the
water–organic interface, and shaking of this two-phase system will create a
stable emulsion difficult for analytical sampling. The ultracentrifugation at
speed of 14,000rpm for 15–20min can be enough in most cases to separate
two phases. Actual equilibration of the system is tested by several measure-
ments of the equilibrium concentration at different time intervals.
Because of the wide range of partitioning coefficient values, in most cases
the decimal logarithm of K
0
w
is used, and it is denoted as LogP:
(12-7)
The biggest challenge for the use of HPLC in the LogP measurement is the
determination of the drug concentration in the octanol phase. If the octanol
solution is being injected onto the reversed-phase column, it can modify the
stationary phase, shift the analyte retention, and lead to an incorrect mea-
surement due to the retention shift. To avoid this problem the dilution in the
corresponding mobile phase is recommended. Also, when LogP is more than
four, the concentration of drug in water phase is very small, causing a detec-
tion problem with UV detection. This becomes even more troublesome if the
compound of interest has a weak UV chromophore. The use of MS detection
and proper ionization mode is recommended to increase the sensitivity.
Direct HPLC experiment can be used for estimation of LogP, but this tech-
nique is valid only for neutral molecules or for ionized molecules analyzed in
their neutral state [18]. The following is a brief description of this method.
Compounds with known LogP is injected onto C18 hydrophobic column,
and the respective retention factors are used to create a calibration curve. The
estimation of LogP for unknown compounds can be made on the basis of this
calibration curve. This method is straightforward, but requires the previous
knowledge of pK
a
values for ionizable compounds to avoid the possible ion-
ization that will lead to incorrect determination of values of LogP. Recently,
an automated isocratic liquid chromatography system, dedicated to the
measurement of LogP,Profiler LDA, was introduced into the market by Sirius-
Analytical, Ltd. There were numerous attempts to use the retention time of
compound in correlation with its distribution properties in RP HPLC [19, 20].
The retention factor was used to calculate a distribution coefficient between
stationary phase and mobile phase. In case of Sirius Profiler LDA automated
system, a set of molecules with known LogP values was used to calibrate the
system and convert the chromatographic retention time into octanol/water
partition coefficients. The system could cover the LogP range from −1 to 5.5
by choosing between three different methods and different column lengths
LogP =
()
log K
w
0
584 ROLE OF HPLC IN PREFORMULATION
ranging from 1 to 25cm, but was recently removed from the market.The well-
known automated pH titrator from Sirius
, GlpK
a
, can be used as well to deter-
mine the octanol/water partition coefficient. The measurement is based on a
two-phase acid/base titration in a mixture of water/octanol [21].
Partition coefficient discussed above represents oil/water equilibrium dis-
tribution of only neutral forms of a substance. The distribution at different pH
is described by LogD, which is the logarithm of the ratio of the concentrations
of all forms of analyte in oil and water phases at particular pH. Logarithm of
distribution coefficient at pH 7.4 is often used to estimate the lipophilicity of
a drug at the pH of blood plasma.
As follows from the definition, the distribution coefficient is dependent on
the pH. It is usually assumed that in the oil-phase drug molecule could exist
in only nonionic form; thus the distribution coefficient, D
0
w
, for basic drug B
could be written as
(12-8)
If LogP and pK
a
for a studied drug is known, then it is possible to express D
0
w
as a function of pH of aqueous phase through these values using equations
(12-3) and (12-6)–(12-8). Resulting expression is
(12-9)
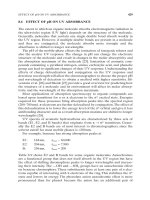
Figure 12-4 represents the comparison of the pH dependencies of ionic form
of a basic drug with LogD.
Log D pH LogP Log
ppH
w
K
a
0
110
()
()
=−+
[]
−
D
B
w
0
=
[]
[]
+
[]
oil
water
+
water
BBH
INITIAL PHYSICOCHEMICAL CHARACTERIZATION (DISCOVERY SUPPORT) 585
LogD
Figure 12-4. Normalized dependence of the protonated form of the base (solid) and
its LogD dependence on the aqueous pH (dashed).
At high pH, the neutral form of a drug (basic compound) has a distribu-
tion coefficient equal to its partitioning coefficient.
With the decrease of the
pH of the aqueous phase, the degree of drug ionization increases, thus increas-
ing its total concentration in the aqueous phase. As the pH decreases, the
ionic equilibrium is shifted toward the protonated form of a drug, which con-
tinually increases its concentration in the aqueous phase and decreases its
content in oil phase. There is no plateau region in the LogD curve at low pH
for basic compounds (Figure 12-4). On the other hand, for acidic compounds,
there is a plateau region in the LogD curve at low pH (pHs below the pK
a
);
and then as the pH increases, the more ionic equilibrium is shifted toward the
ionized form of the acid, which continually increases its concentration in the
aqueous phase and decreases its content in the oil phase. This results in
the absence of plateau in the LogD curve at high pH (pH > pK
a
) for acidic
compounds.
These are only the theoretical dependencies; real behavior of actual mole-
cule usually is significantly altered due to different types of intermolecular
interactions. Molecular solvation, association, hydrogen bonding, and counte-
rions all have a significant effect on drug ionization constant and partitioning
and distribution coefficients. Detailed and comprehensive discussion of these
effects could be found in the book by Avdeef [22].
12.2.3 Solubility and Solubilization
Aqueous solubility is one of the most important physicochemical properties
of a new drug candidate because it affects both drug absorption and dosage
form development. Only a drug in solution can be absorbed by the gastroin-
testinal track. The rate of dissolution and the intestinal permeability of the
drug molecules are dependent on the aqueous solubility—that is, the higher
the solubility, the faster the rate of dissolution. An excellent monograph
describing the theory of solubility and solubility behavior of organic com-
pounds was written by Grant and Higuchi [23]. For additional information on
solubility, the reader can be referred to references 24–27.
Solubility is expressed as the concentration of a substance in a saturated
solution at a defined temperature. The US Pharmacopeia (USP) gives the
solubility definitions shown in Table 12-2.
Solubility measurements are generally carried out in the early stages of
drug development because it affects drug bioavailability evaluation; in many
cases, solubility-limited absorption has been reported. Only a compound that
is in solution is available to cross the gastrointestinal membrane. The solubil-
ity measurements in aqueous buffered systems at different pHs are used to
mimic gastrointestinal human or animal fluids. Solubility determination in
DMSO is very important at the early stages of lead candidate selection
because of the increasing use of 10mM DMSO solution as a stock solution for
biological testing for very slightly soluble lead candidates [29]. In general,
586 ROLE OF HPLC IN PREFORMULATION
aqueous solubility is measured in simple buffered aqueous media. In practice,
the aqueous medium of the gastrointestinal track is a mixture of salts and sur-
factants
, and the recipes to mimic the fasted (fasted state simulated intestinal
fluid, FaSSIF) [30] and fed state (fed state simulated intestinal fluid, FeSSIF)
[31] may be used when the influence of gastrointestinal fluid on oral absorp-
tion of NCE is studied especially for in vivo/in vitro correlation experiments
[32]. It was reported that for some compounds the solubility in FaSSIF
and FeSSIF will be higher than the solubility in aqueous buffers at the same
pH [33].
At the early stage of candidate selection the different experimental
methods based on high-throughput solubility measurements are used to deter-
mine the apparent solubility of potential lead candidates as well as in silico
predictions [34] to quickly assess aqueous solubility. These methods are
described in details in references 5 and 35. In the later stages of preformula-
tion when the drug candidate is in a well-characterized crystalline solid state,
more precise determination of the equilibrium aqueous solubility is necessary
for designing appropriate formulations.The old-fashioned shake flask method
is recommended to measure equilibrium aqueous solubility [36] at this stage.
The procedure is very simple.The compound in solid state is added to buffered
solution in excess (saturated solution), and the suspension is shaken on a
mechanical shaker until the system reaches the equilibrium between two
phases, solid and liquid. Sometimes the equilibration time is very long and can
vary from 2 hours to a few days or weeks, which is dependent upon the numer-
ous factors that affect solubility. Solution stability may also be a concern, as
an additional precaution the solutions should be protected from light when
possible if they may be prone to photodegradation. To check the equilibrium
condition, several HPLC measurements should be determined at several time
points. The system is considered to be in equilibrium when the solubility mea-
surements between several time points remain constant.
However, the equilibrium solubility values are very difficult to obtain,
because they are affected by many factors such as crystalline form of a sub-
stance, particle size distribution, temperature, composition of aqueous phase,
INITIAL PHYSICOCHEMICAL CHARACTERIZATION (DISCOVERY SUPPORT) 587
TABLE 12-2. Solubility Definitions by US
Pharmacopeia [28]
Parts of Solvent Required
Descriptive Term for One Part of Solute
Very soluble Less than 1
Freely soluble From 1 to 10
Soluble From 10 to 30
Sparingly soluble From 30 to 100
Slightly soluble From 100 to 1000
Very slightly soluble From 1000 to 10,000
Insoluble 10,000 and over
and even the amount of excess solids [37].Table 12-3 shows some examples of
reported aqueous solubility range for commercial drugs
.
Aqueous solubility of ionizable molecules at different pH values is an
important characteristic because it indicates the potential substance behavior
in the stomach and intestinal tract and its potential impact on bioavailability.
Moreover, it also provides important information for formulation scientists to
define the class of a drug substance in the Biopharmaceutics Classification
System (BCS), a regulatory guidance for bioequivalence studies. The BCS is
a scientific framework proposed by the FDA to classify drug substances based
on their aqueous solubility and intestinal permeability and defines important
parameters in the selection of drug candidates into development. According
to the BCS, drug substances are classified as shown in Table 12-4.
An objective of preformulation scientist is to determine the equilibrium
solubility of a drug substance under physiological pH to identify the BCS class
of drug candidate for further development. For BCS classification the test con-
ditions are strictly defined by the FDA. The pH solubility profile of the test
drug substance should be determined at 37°C in aqueous media with a pH
in the range of 1–7.5. Standard buffer solutions described in the USP are
considered to be appropriate for use in these studies. A number of pH condi-
tions are used bracketing the pK
a
value for the respective test substance.
For example, for a drug with a pK
a
of 5, solubility should be determined at
588 ROLE OF HPLC IN PREFORMULATION
TABLE 12-3. Variation of Aqueous Solubility in the
Literature [37]
Compound Solubility Range (g/mL)
Estradiol 0.16–5.00
Indomethacin 4.00–14.0
Griseofulvin 8.00–13.0
Progesterone 7.90–200
Digoxin 28.0–97.9
Riboflavine 66.0–99.9
Dexamethasone 89.1–121
Hydrocortisone 280–359
TABLE 12-4. Biopharmaceutical Classification of Drug
Substances
Class Solubility Permeability
Class 1 High solubility High permeability
Class 2 Low solubility High permeability
Class 3 High solubility Low permeability
Class 4 Low solubility Low permeability
pH = pK
a
,
pH = pK
a
+ 1, pH = pK
a
− 1, pH = 1, and pH = 7.4 Concentration
of the drug substance should be determined using a stability-indicating assay
that can distinguish drug substance from its degradation products if observed.
In order to be classified as highly soluble, the FDA BCS requires that the
highest human dose be soluble in 250mL of aqueous medium over a pH
range 1–7.5 [38]. The identification of specific class for the drug candidate is
critical for future development of dosage forms.
Different platforms are used for solubility measurements: UV; HPLC with
UV detection; or HPLC with MS detection. UV spectrophotometry is the sim-
plest and fastest method, unfortunately with limited applicability.In most cases
the drug substance available for the study in the preformulation stage is not
pure enough to provide an adequate absorbance–concentration relationship
of drug substance itself. In this case, HPLC with UV detection is the most
applicable technique to use. Fast gradient methods on short columns could be
successfully used in most cases as described in Chapter 17. Some software
programs such as ACD/LogD Sol Suite [39] can be used to estimate the solu-
bility as a function of pH and can be used as a starting point to estimate the
appropriate dilution of the different solutions prepared at the different pH
values.
In some cases, drug substance does not have chromophores with a molar
absorbtivity sufficient for accurate quantitation using UV detection. If HPLC
with UV detection is used as a basic quantitation technique, then MS detec-
tion as a complementary technique is desirable in most cases. LC-MS is essen-
tially preferable in most preformulation assays. High selectivity of the MS
detector allows the use of fast gradient HPLC separation methods, which does
not require significant development time. Practically in all assays used in
preformulation, the quantitation of only drug substance is required and MS
detection provides an accurate quantitation.
Identification of pharmaceutically acceptable vehicles that afford sufficient
solubilization while maximizing physiological compatibility for preclinical
pharmacokinetic evaluation is critical.The most frequently used solubilization
techniques include pH manipulation for ionizable compounds; use of co-
solvents such as PEG 400, ethanol, DMSO, and propylene glycol; micellar
solubilization with surfactants such as Tween 80 or SLS; complexation with
cylodextrins [40]. By using the solubilization techniques, the enhancement in
solubility of poor water-soluble compounds can be significant compared to
aqueous solubility and can facilitate the absorption of drug molecules in the
gastrointestinal tract when delivered in solution form.
The requirements for HPLC methods include careful selection of the
mobile phases to avoid sample precipitation or emulsification. At the same
time, chromatographic conditions should provide positive retention of the
drug substance so it won’t elute with the void volume.
The solubility measurement at several time points can be used for prelim-
inary solution stability evaluation of new drug candidates. If degradation is
observed during the solubility evaluation, further HPLC method development
INITIAL PHYSICOCHEMICAL CHARACTERIZATION (DISCOVERY SUPPORT) 589
should be oriented not only to determine drug substance concentration, but
also on the separation of degradation products from the active
.
12.3 CHEMICAL STABILITY
HPLC is a major tool in preformulation stability testing of potential drug can-
didate. The design of stability testing in the early stage of drug development
is not strictly defined by FDA guidance, and different approaches are taken
by different pharmaceutical companies. However, there are several major
components to a comprehensive stability testing with a goal to achieve
maximum information within the shortest period of time:
•
Development of a sensitive and reliable HPLC method of separation
•
Solution-state stability as a function of pH, temperature, and light
•
Chemical solid-state stability evaluation as a function of temperature and
humidity
•
Identification of degradation products followed by structure elucidation
and possible description of degradation mechanism
To achieve this goal, the best approach is to perform forced degradation
studies at the preformulation stage of drug development with most viable can-
didates, which may include the free base or acid and several corresponding
salt forms. The FDA and ICH guidance provides very little information about
strategies and principles for conducting forced degradation studies, including
problems with poorly soluble drugs and exceptionally stable compounds. The
stressing condition should be regulated based on the requirements to produce
enough degradation products to evaluate the possible routes of degradation,
but not to unduly overstress the drug and obtain aberrant results. Sufficient
exposure is achieved when a drug substance has degraded >10% from its
original amount or after an exposure in excess of the energy provided by an
accelerated storage condition. The goal is to mimic what would be observed
in formal stability studies under ICH conditions [41]. Another major concern
is related to the use of a co-solvent to dissolve the sufficient amount of drug
for determination and detection of degradation products. In general, acetoni-
trile or methanol is used as common co-solvent for forced degradation studies.
It was shown that when acetonitrile was used as a co-solvent compared to no
co-solvent system, the number of degradation products increased and led to a
consequent change in the degradation pathway [42]. The recommendation in
this case is to prepare the samples in several co-solvents and compare the
behavior of methanol versus acetonitrile for a specific drug candidate. Forced
degradation studies based on FDA guidelines are carried out in solution.This
involves conditions that are more severe than in accelerated solid-state sta-
bility testing. For example, these include temperatures in excess of 40°C,
590 ROLE OF HPLC IN PREFORMULATION
extreme high and low pH values, oxidation by 3% hydrogen peroxide, and
light conditions exceeding ICH guideline [43].
As a part of discovery support,
these forced degradation studies are
performed on discovery batch material to identify future problems with drug
candidates and to eliminate the recommendation of unstable molecules to
develop or to help define proper storage conditions for early-phase material—
that is, store at low temperature, protect from light, and ensure tight packag-
ing. As a part of preformulation studies, this forced degradation testing is not
a part of formal stability program for clinical batches, but sheds light in regard
to possible thermolitic, hydrolitic, oxidative, and photolitic degradation mech-
anisms for the prospective drug candidate. At this stage it is critical to develop
a suitable HPLC separation method, not only based on UV detection and peak
purity check, but also one that is compatible with MS detection. Preferably,
columns with 3-µm particles and not more than 15cm in length (i.d. could be
3.0 or 4.6mm) should be used, and mobile phases compatible with MS detec-
tion are recommended. As a starting point, a C8 column that is stable from 2
to 11 or a phenyl hexyl column that is stable from 2 to 10 could be selected
and a gradient could be employed from 5% acetonitrile to 95% acetonitrile.
0.05 v/v% TFA could be used in both acetonitrile and water mobile phases.
Development of stability-indicating methods are discussed in the method
development chapter (Chapter 8). Despite the usual situation in the prefor-
mulation research environment when all tests should have been done yester-
day, an analyst should carefully develop a stability-indicating HPLC method
because in most cases the conditions of this method will be used as a starting
point for most, if not all, further HPLC methods during the development
process of a particular drug in the downstream formulation development.
Unfortunately, the isolated drug substance and drug-product-related degra-
dation products are not available at this early stage, and the peak purity analy-
sis using UV diode array detection along with mass spectrometric detection
should be performed.
Once the initial stability-indicating method is developed, the forced degra-
dation studies are carried out and the pathways for degradation may be
elucidated. Four major degradation processes are usually distinguished:
oxidation, hydrolysis (H
+
or OH
−
), photolysis (light), and catalysis (effect of
trace metal ions, Fe
2+
,Fe
3+
,Cu
2+
,Co
2+
, etc.). Temperature is an integral part of
all these processes.According to the Arrhenius equation, the reaction constant
is related to the temperature as follows:
(12-10)
where E
a
is activation energy, R is the gas constant, and T is temperature in
degrees kelvin. The higher the temperature the higher the reaction constant,
and this leads to the increase of the degradation rate.
KA
E
RT
a
=−
exp
CHEMICAL STABILITY 591
Degradation is a chemical transformation of the drug substance and can be
expressed as a chemical reaction with the specific kinetics
.These reactions can
have different orders, which are characterized by the different rate of parent
compound decomposition. The most common are zero, first and second order
reactions. It is not a subject of this chapter to discuss reaction kinetics in
details; however, specific preformulation-related discussions can be found in
reference 6, and a general approach with examples is very well described by
Martin [44].
Zero-order reactions are usually of self-disintegration type, where decom-
position is independent of the concentration of reactants (including drug
substance). For this reaction the decrease of the drug substance amount has a
linear dependence versus time.
In the first-order reaction, the decomposition is dependent on the concen-
tration of one reactant (drug substance) and the decrease of the substance
concentration is exponential. In the second-order reaction, the decomposition
is dependent on the concentration of two reactants (e.g., drug substance and
water in a hydrolytic degradation). The rate of the decrease of the substance
amount is reciprocal to the drug concentration.
Usually the determination of the amount of drug substance at four or more
different time points of the degradation experiment is necessary for the deter-
mination of the reaction order and construction of the degradation curve,
which can then be used to determine the rate constant at a particular
temperature.
If the reaction order is known, then rate constant could be calculated from
just two points. For example, for the first-order reaction the rate constant is
expressed as
(12-11)
where [C] is a drug concentration at time t,[C
0
] is the original drug concen-
tration (at time t
0
= 0), and K is the reaction constant. Subtracting the same
equations for time moments t
1
and t
2
from each other, it is possible to calcu-
late the rate constant:
(12-12)
Note. Only the ratio between initial concentration C
0
of parent compound to
the concentration C
t
at defined time point should be used in any kinetic
calculations as described in detail by Martin [44]. It is not mathematically
accurate to select the starting concentration as a base value and calculate all
concentrational variations relative to the starting concentration.
K
C
C
tt
=
[]
[]
−
ln
1
2
21
ln
C
C
Kt
[]
[]
=−
0
592 ROLE OF HPLC IN PREFORMULATION
Based on the known rate constant, the half-life (the period of time required
for a drug to decompose to one half the original concentration),
can be deter-
mined as shown in Table 12-5.
Measurements of the rate constants for at least three different tempera-
tures allows for the calculation of the activation energy and prediction of the
temperature dependencies of the drug degradation based on the Arrhenius
equation. The relationship between the rate constant and the temperature is
given by the Arrhenius equation:
(12-13)
or
(12-14)
where k is the rate constant, R is the gas constant, A is an Arrhenius factor
(constant), T is the temperature (in Kelvin), and E
a
is activation energy.A plot
of the logarithm of rate constant versus the reciprocal of the absolute tem-
perature defines a straight line of slope −E
a
/R and intercept log A [45]. The
activation energy can be determined at the different forced degradation con-
ditions (heat, light, peroxide).
In all types of degradation assays the use of LC-MS detection is desirable
since it allows for selective detection and quantitation and sometimes allows
for structural elucidation of the degradation products. In some cases, tauto-
merization or intramolecular rearrangements could lead to the formation of
degradation products with the same molecular weight. These molecules are
usually indistinguishable from the parent compound using MS with molecu-
lar ion detection. The employment of LC-NMR technique may be needed to
further elucidate the structures.
log log
.
kA
E
RT
a
=−
2 303
1
kAe
ERT
=
−
0
CHEMICAL STABILITY 593
TABLE 12-5. Rate Constant and Half-Life Equations
Order Integrated Rate Equation Half-Life Equation
0 x = kt
1
2
Source: Reprinted with permission from reference 45, p. 289.
t
ak
1
2
1
=
x
aa x
kt
−
(
)
=
t
k
1
2
0 693
=
.
log
.
a
ax
kt
−
=
2 303
t
a
k
1
2
2
=
12.4 SALT SELECTION
F
or ionic drugs the salt form can be considered as an alternative to increase
the solubility. Drug substance usually is more soluble in aqueous media in its
ionic form. Low solubility of the neutral form of the drug substance suggests
the necessity to formulate it in the form of salt. The reader is referred to ref-
erence 46 for more information about the properties, selection, and use of salt
forms for future drug development. Examples of commonly used salt counte-
rions are shown in Table 12-6.
Salt form selection is mainly covered by solid-state charactezation methods,
and HPLC is only used to determine the solubility and solid/solution stability
of different salt forms. The requirements for HPLC method development is
the same as for solubility/stability determination described previously, and the
same HPLC method may be applied.
12.5 POLYMORPHISM
Polymorphism is an ability of the drug substance to form crystals with differ-
ent molecular arrangements giving distinct crystal species with different phys-
ical properties such as solubility, hygroscopicity, compressibility, and others.
This phenomenon is well known within pharmaceutical companies.The reader
can find additional information in references 47 and 48. The determination of
possible polymorphic transition and existence of thermodynamically unstable
forms during preformulation stage of drug development is important. Typical
methods used for solid-state characterization of polymorphism are DSC,
594 ROLE OF HPLC IN PREFORMULATION
TABLE 12-6. Ionization Constants and Relative Usage Rate for the Most Common
Counterions
Basic Drugs Acidic Drugs
Anion pK
a
% Cation pK
a
%
Hydrochloride −6.1 43 Potassium 16.0 10.8
Sulphate −3.0 7.5 Sodium 14.8 62
Mesylate −1.2 2.0 Calcium 12.9 10.5
Maleate 1.9 3.0 Magnesium 11.42 1.3
Phosphate 2.2 3.2 Diethanolamine 9.7 1.0
Salycilate 3.0 0.9 Zinc 9.0 3.0
Tartrate 3.0 3.5 Choline 8.9 0.3
Lactate 3.1 0.8 Aluminium 5.0 0.7
Citrate 3.1 3.0 Alternatives 8.8
Benzoate 4.2 0.5
Succinate 4.2 0.4
Acetate 4.8 1.4
Alternatives 30.2
FT/IR, microscopy, and X-ray powder diffraction [49, 50]. HPLC is used to
evaluate chemical stability of different polymorphic forms as well as for solu-
bility determination,
and this parameter is very critical for drug development,
because the difference in solubility can lead to different bioavailability of solid
dosage form, especially if the bioavailability is dissolution-limited.An example
of how polymorphism can affect final product solubility can be shown on
Abbott Laboratories products and on Norvir oral liquid and Norvir semisolid
capsules, with Ritonavir as an active ingredient. Ritonavir was not bio-
available in the solid state, and both formulations contained ritonavir in
ethanol/water solutions.At the time there was no crystal form control required
from FDA for semisolid formulation, and only one form was identified at the
development stage. After many successful lots of semisolid capsules, suddenly
one lot did not pass the dissolution testing and when the content of the capsule
was analyzed by microscopy and X-ray, the different polymorphic form of
Ritonavir was identified with significantly low solubility compared to original
crystal form [51].The product was recalled from market and was reformulated.
It was a rare example of a dramatic effect of the existence of multiple crystal
forms of a commercial pharmaceutical and showed the importance of poly-
morphic screening for all type of pharmaceutical dosage forms.When the exis-
tence of polymorphism for new chemical entity is identified, the property of
practical interest is the relative thermodynamic stability of the identified poly-
morphs; that is, are they monotrops (one is more stable than the other at any
temperature) or enantiotrops (a transition temperature T
t
exists below and
above which the stability order is reversed)? Temperature dependence of the
solubility for different polymorphic forms allows easy analysis of the existence
of monotrops and enantiotrops and determination of transition temperature
from the solubility ratio of the polymorphs [52]. As can be seen from Figure
12-5, intersecting solubility curves (dependence of the logarithm of the
POLYMORPHISM 595
Figure 12-5. Intersecting solubility curves (dependence of the logarithm of the satu-
ration concentration on the inverse temperature) indicate an enantiotropic nature of
the polymorps
, while parallel curves are indicative for monotropic polymorphs. The
intercept for enantiotrops corresponds to the transition temperature.
saturation concentration on the inverse temperature) indicate an enantiotropic
nature of the polymorps
, while parallel curves are indicative for monotropic
polymorphs.The intercept for enantiotrops corresponds to the transition tem-
perature, T
t
, which can be easily determined from the graph. In general, the
most thermodynamically stable form that has a lower solubility and better
stability is accepted for development. It was reported previously that the
more thermodynamically stable polymorph is more chemically stable than
a metastable polymorph due to different factors such as higher density, opti-
mized orientation of molecules, and hydrogen bonding in the crystal lattice
[48, 53].
The HPLC method development requirements using short columns and fast
HPLC to determine the assay concentration for each polymorph at the dif-
ferent temperatures are the same as for solubility determination. However, for
stability evaluation of the different polymorphs a stability-indicating HPLC
method should be used.
12.6 PREFORMULATION LATE STAGE
(DEVELOPMENT SUPPORT)
After a new chemical entity has been selected to move forward to develop-
ment, the preformulation scientist supports the studies related to formulation,
toxicology, and pharmacology.
Based on the previous knowledge about the properties of novel chemical
entity obtained during the late discovery and nomination, the stability studies
of API are performed based on ICH guidance [43].
Typically, by using a GMP batch with selected solid-state form, the
solution-state stability and solid-state stability studies are performed at various
conditions. In general, the three conditions used for solid-state stability eval-
uation—25/60, 40°C/75% RH, and 50°C dry conditions—at several time points
up to 3 months (initial, 2 weeks, 6 weeks, 3 months) are reasonable to evalu-
ate storage conditions of API and the impact of heat and humidity. For
solution-state stability, it is important to evaluate (a) the stability at pH 1, 2,
4, 7, and 10, at ambient and elevated temperature, (b) the influence of ICH
light, and (c) oxidation by peroxide. To support toxicology studies, the stabil-
ity of API suspension at different strengths in aqueous solutions with corre-
sponding excipients are evaluated after 1 day, 2 days, 3 days, and 8 days on
potency and stability. HPLC techniques are used for all these types of stabil-
ity testing, and GLP requirements are applied to HPLC methods. The system
suitability for the method needs to be defined and the figures of merit such as
linearity,LOD,LOQ, and solution stability in the diluent need to be performed
to qualify this as a stability-indicating HPLC method at this stage.
Since the degradation products are not yet identified in this stage, it is
advisable to use detection systems, which have universal response and also
provide high sensitivity. MS is probably the most sensitive detector that also
596 ROLE OF HPLC IN PREFORMULATION
can provide relatively universal response for most ionizable compounds,
although the degree of ionization may vary with the type of interface used.
In
some cases the use of evaporative light scattering detector is also advisable.
This detector has a universal response for practically any molecule with
molecular weight above 300 Da.
The key to a good stability-indicating assay is to select concentrations for
analysis that allow the detection of degradation product peaks that are at least
0.1% of the parent peak, which is consistent with ICH impurities guideline
[54].
Identification of dosage form composition during the design of Phase I clin-
ical formulations is a key step in accelerating drug development, and this is
performed through drug–excipient compatibility testing. This test is the most
time- and labor-consuming. A proper design of experiments must be con-
ducted. The amount of samples sometimes reaches 100 or more (conditions:
50°C, 40°C/75% RH, or 40°C plus water, for placebo, API, and binary mix-
tures of more then 30 excipients) for one time point, depending on the
accepted scheme of compatibility testing. Despite the importance of
drug–excipient compatibility testing, there is no universal protocol for this
study. In general, the amount of the API in the binary mixture is determined
on the basis of the expected drug-to-excipient ratio in the final formulation.
To eliminate a time-consuming step of analyzing all binary mixtures (API +
excipient), additional samples can be prepared such that different groups of
samples containing four or five excipients together at the same ratio as in final
form are analyzed first. If there is no change observed, the binary mixtures are
not analyzed; however, if a change is observed, the respective binary samples
(i.e., API + excipient 1, API + excipient 2) containing the excipients from the
mixture (i.e.,API + 5 excipients) should be analyzed to determine which excip-
ient(s) had led to the degradation. Sometimes a combination of excipients
leads to the degradation, and this should not be ruled out.
For many years, differential scanning calorimetry (DSC) was a standard
method in preformulation to characterize drug–excipient compatibility based
on the change of thermal curves [55, 56]. Despite the simplicity of DSC exper-
iment and small quantity of API needed, an evaluation of thermograms can
be difficult, and conclusions based only on DSC results can be misleading [56].
Recently [57], the use of stability-indicating HPLC methods was emphasized
to be used for these excipient compatability studies in order to better charac-
terize the API–excipient interactions by providing not only qualitative but also
quantitative results for test substance and its related degradation products. A
comparison between two methods, HPLC and DSC, was reported by Ceschel
et al. [58]. Good correlation between DSC and HPLC results was demon-
strated in the case of acetyl salicylic acid with a number of commonly used
excipients.The incompatibility of magnesium stearate with acetyl salicylic acid
was shown by DSC, and this was confirmed by HPLC. In the case of using
HPLC as an analytical method for excipient compatibility studies, not only can
the results be reported as potency or concentration of parent peak, but also
PREFORMULATION LATE STAGE (DEVELOPMENT SUPPORT) 597
all the amounts (mass or area%) of unknown peaks can be determined. The
excipients themselves should also be analyzed,
and the chromatographic peaks
of excipient should be recorded but not integrated against the API. Also, the
excipient peaks should be resolved from both the API synthetic by-products
and the degradation products formed due to the incompatibility of API with
excipients. The placebos should also be put on stability. This study provides
very critical information for formulators to guide their future development of
novel dosage forms.
A very good example of a drug–excipient compatibility screening model
was described by Serajuddin et al. [59]. They showed the importance of this
test in the early stage of formulation development prior to Phase I and devel-
oped a protocol for this study (see Table 12-7).Table 12-7 shows compositions
of the 17 drug–excipient blends stored at 50°C in closed vials with 20% added
water (weights of all ingredients are in milligrams). The assay% and area%
(using area normalization) were determined for each of the mixtures. It can
be seen that some excipients caused significant degradation, and the major
degradation pathway is hydrolysis.
Based on the reported results, it was advised to use the described model to
perform drug–excipient compatibility testing prior to Phase I to eliminate
potential future issues related to drug instability in final formulation. Because
the drug–excipient compatibility testing is conducted at an early drug devel-
opment stage when a fully validated HPLC method is not available, the same
GLP HPLC method as for forced degradation studies can be used for this test
as well.
Moreover, if adequate forced degradation studies (i.e., acid/base hydro-
lysis) are performed in the early preformulation stage, the identification of a
potential degradation product that might arise during excipient compatibility
598 ROLE OF HPLC IN PREFORMULATION
TABLE 12-7. Example of Drug–Excipient Compatibility Testing Design.
Reprinted with Permission from reference 59.
123456
Drug substance 200 25 25 25 25 25
Lactose 175 170
Mannitol 175
Microcrystalline cellulose 175
Dibasic calcium phosphate dihydrate 175
Magnesium stearate 5
Sodium stearyl fumarate
Stearic acid
Potency remaining (% initial) 96.4 95.7 95.8 93.9 85.0 64.3
Hydrolysis product formed
a
3.3 4.1 4.0 5.8 16.7 37.0
a
Expressed as a percentage of the parent drug.
studies might have been already determined (i.e., acid/base hydrolysis
product).
Note that an adequate HPLC method must be developed to prop-
erly retain any compounds that may be formed as a result of hydrolysis and
are more polar and less hydrophobic than the API; also, the same HPLC
method must be able to elute additional hydrophobic species—for example,
dimers, which are formed during the excipient compatibility studies.
12.7 CONCLUSIONS
Discovery formulation support and early preclinical development support can
be provided by the preformulation group as a part of the drug development
process.The functions of this unit is to help discovery in physicochemical char-
acterization of new drug molecules by providing information on solubility,
stability, pK
a
, and LogP/LogD as well as formulation support for PK animal
studies to recommend a final candidate for selection to development. After
candidate selection, the early preformulation unit provides a major source of
information to formulation and analytical scientists regarding the properties
of the recommended drug molecules. The development preformulation
support provides the additional testing of prototype formulation and excipi-
ent compatibility samples as well as guidance for salt form selection and
polymorphs screening. The major role of this unit is to bridge discovery and
development stages. HPLC coupled with not only UV, but also other alterna-
tive detectors, is the predominate tool for analyzing drug substances with high
speed and efficiency, which is required in the preformulation stage of drug
development.
CONCLUSIONS 599
Experiment
7 8 9 10 11 12 13 14 15 16 17
25 25 25 25 25 25 25 25 25 25 25
170 170
170 170 170
170 170 170
170 170 170
555
5555
5555
65.4 65.3 38.1 77.9 81.9 77.6 81.8 90.0 92.9 88.1 78.3
36.7 36.3 33.7 21.8 15.4 20.1 15.3 9.7 6.9 11.7 21.6
REFERENCES
1.
I. Kola and J. Landis, Can the pharmaceutical industry reduce attrition rates?,
Nature Rev. Drug Discovery 3 (2004), 711–715.
2. R. A. Lipper, How can we optimize selection of drug candidates from many com-
pounds at the discovery stage, Mod. Drug Discovery 2 (1999), 55–60.
3. C. A. Lipinski, R. Lambardo, B. W. Dominy, and P. J. Feeney, Adv. Drug Delivery
Rev. 23 (1997), 3–25.
4. H. van de Waterbeemd, H. Lennernas, and P. Artursson, Drug Bioavailability,
Willey-VCH, New York, 2002, p. 22.
5. A. Avdeef, Absorption and Drug Development, Wiley Interscience, New York,
2003.
6. J. I. Wells, Pharmaceutical Preformulation, Ellis Horwood Chichester, UK,
1988.
7. J. T. Carstensen, Pharmaceutical Preformulation, Technomic Publishing Company,
Lancaster, PA, 1998.
8. M. Gibson (ed.), Pharmaceutical Preformulation and Formulation, Interpharm/
CRC Press, Boca Raton, Florida, 2004, pp. 585.
9. H. van de Waterbeemd, H. Lennernäs, and P. Artursson, Pharmacokinetic/phar-
macodynamic modeling in drug development, drug bioavailability, Annu. Rev.
Pharmacol. Toxicol. 40 (2000), 67–95.
10. A. Avdeef, Absorption and drug development, in R. T. Borchart and C. R. Mid-
daugh (eds.), Pharmaceutical Profiling in Drug Discovery for Lead Selection,AAPS
Press, Tucson, AZ 2004, Wiley, Hoboken, NJ, 2003.
11. J. E. A. Comer, High-throughput measurement of log D and pKa in H. van de
Waterbeemd, H. Lennernas, P. Artursson (eds.), Drug Bioavalability, Wiley,
Hoboken, NJ, 2004, pp. 33–39.
12. Applications and Theory Guide to pH—Metric pK
a
and log P Determination, Sirius
Analytical Instruments Ltd., Forest Row, UK, 1992.
13. W. R. Melander and C. Horvath, Reversed-phase chromatography, in C. Horvath
(ed.), HPLC, Advances and Perspectives, Vol. 2, Academic Press, New York, 1980,
pp. 114–303.
14. A. J. Leo, P. Y. C. Jow, C. Silipo, and C. Hansch, J. Med. Chem. 18 (1975), 865.
15. S. Siekerski and R. Olszer, J. Inorg. Nucl. Chem. 25 (1963), 1351.
16. H. A. Mottola and H. Friezer, Distribution of certain 8-quinolinols and their
copper(II) chelates in a series of organic solvent—aqueous pairs, Talanta 13 (1966),
55–65.
17. K. Valko, Measurements of physical properties for drug design in industry, in Sep-
aration Methods in Drug Synthesis and Purification, Vol 1, Elsevier, Amsterdam,
2000, pp. 539–542.
18. R. Lombardo, M. Y. Shalaeva, K. A. Tupper, and M. H. Arapham, ElogP(oct): A
tool for lipophilicity determination in drug discovery, J. Med. Chem. 43 (2000),
2922–2928.
600
ROLE OF HPLC IN PREFORMULATION
19. K. Valko, General approach for the estimation of octanol/water partition coeffi-
cient by RP HPLC
, J. Liq. Chromatogr. 7 (1984), 1405–1424.
20. K. Valko, C. M. Du, C. Bevan, D. Reynolds, and M. H. Abraham, Rapid method for
the estimation of octanol/water partition coefficient (log P
oct
) from gradient RP-
HPLC retention and a hydrogen bond acidity term, Curr. Med. Chem. 8 (2001),
1137–1146.
21. A. Avdeef and K. J. Box, Sirius Technical Application Notes (STAN), Vol. 2, Sirius
Analytical Instruments, Ltd., Forest Row, UK, 1995.
22. A.Avdeef, Absorption and Drug Development: Solubility, Permeability, and Charge
State,Wiley, Hoboken, NJ, 2003.
23. D. J. W. Grant and T. Higuchi, Solubility Behavior of Organic Compounds, Wiley,
New York,1990.
24. S. H.Yalkowsky, Solubility and Solubilization in Aqeous Media, Oxford University
Press, New York, 1999.
25. S. H.Yalkowsky and Y. He.Handbook of Aqueous Solubility Data, CRC Press, Boca
Raton, FL, 2003.
26. D. J. W. Grant and H. G. Brittain. Solubility of pharmaceutical solids, in H. G.
Brittain (ed.), Physical Characterization of Pharmaceutical Solids, Marcel Dekker,
New York, 1995, pp. 321–386.
27. K. C. James, Solubility and Related Properties, Marcel Dekker, New York, 1986.
28. The USP 29-NF24, General Notices, Test and Assays.
29. C. A. Lipinski, Solubility in Water and DMSO: Issues and Potential Solutions in
Pharmaceutical Profiling in Drug Discovery for Lead Selection, AAPS Press,
Tucson,AZ, 2004, pp. 93–125.
30. E. S. Kostewicz, U. Brauns, R. Becker, and J. B. Dressman, Forecasting the oral
absorption behavior of poorly soluble weak bases using solubility and dissolution
studies in biorelevant media, Pharm. Res. 19 (2002), 345–349.
31. E. Galia, E. Nicolaides, D. Horter, R. Lobenberg, C. Reppas, and J. B. Dressman,
Evaluation of various dissolution media for predicting in vivo performance of class
I and II drugs, Pharm. Res. 15 (1998), 698–705.
32. S. Li, H. He, L. J. Parthiban, H. Yin, and A. T. M. Serajuddin, IV–IVC considera-
tions in the development of immediate-release oral dosage form, J. Pharm. Sci. 94
(2005), 1396–1417.
33. B. L. Pedersen, A. Mullertz, H. Bronsted, and H. G. Kristensen, A comparison of
the solubility of danazol in human and simulated gastrointestinal fluids, Pharm.
Res. 17 (2000), 891–895.
34. W. L. Jorgensen and E. M. Duffy, Prediction of drug solubility from structure, Adv.
Drug Deliv. Rev. 54 (2002), 355–366.
35. L. Pan, Q. Ho, K. Tsutsui, and L. Takahashi, Comparison of chromatographic and
spectroscopic methods used to rank compounds for aqueous solubility, J. Pharm.
Sci. 90 (2001), 521–529.
36. S. H. Yalkowsky and S. Banerjee, Aqueous Solubility: Methods of Estimation for
Organic Compounds, Wiley, New York, 1992.
37. K. Kawakami, K. Miyoshi, and Y. Ida, Impact of the amount of excess solids on
apparent solubility, Pharm. Res. 22 (2005), 1537–1543.
REFERENCES 601