Tài liệu HPLC for Pharmaceutical Scientists 2007 (Part 17) doc
Bạn đang xem bản rút gọn của tài liệu. Xem và tải ngay bản đầy đủ của tài liệu tại đây (599.15 KB, 46 trang )
17
DEVELOPMENT OF F
AST HPLC
METHODS
Anton D. Jerkovich and Richard V. Vivilecchia
17.1 INTRODUCTION
Developing fast high-performance liquid chromatography (HPLC) methods
can improve work efficiency during research, development, or production of
a drug substance or a drug product. HPLC is a key technique in all of these
areas. Until recently, analysis times of greater than 30 minutes were common.
Modern pharmaceutical R&D, with its high-throughput screening, demands
high-throughput methods to deal with the large number of samples.To reduce
production cycle time, fast HPLC methods are essential for on-line or at-line
process control and for rapid release testing. Consider a GMP laboratory
responsible for releasing a single batch of drug substance.Assuming a run time
of 30 minutes and a total of 12 injections, a run time of 6 hours would be
required to cover system suitability, calibration,and sample analysis. If the run
time were 5 minutes, only 1 hour would be required for the analysis. With the
advent of commercial chromatographic porous media of less than 5µm and
more recently in the 1- to 2-µm range, analyses times of less than 1–2 minutes
have been demonstrated. Hundreds of samples which required days can now
be analyzed in less than a day. This chapter will focus on how to optimize iso-
cratic and gradient methods for speed without sacrificing resolution. In addi-
tion, the implication on selection of column dimensions and media particle
size on the speed of methods development will also be discussed.
Reducing chromatographic media particle size allows the number of theo-
retical plates per second to be increased. However, due to the resolution
765
HPLC for Pharmaceutical Scientists, Edited by Yuri Kazakevich and Rosario LoBrutto
Copyright © 2007 by John Wiley & Sons, Inc.
dependence on N
1/2
,
doubling of N will only increase resolution by 2
1/2
. As dis-
cussed below, a reduction in particle size can lead to a pressure limitation due
to the inverse dependence of pressure drop to the square of the particle diam-
eter and the maximum operating pressure of the chromatograph. The key to
optimizing speed is to maximize selectivity, α. Maximizing selectivity for the
critical separation pairs will allow the shortest column lengths and highest
mobile-phase linear velocity. Short columns, 3–10cm packed with particles in
the 1- to 3-µm range, provide high-speed analyses while maintaining reason-
able pressure drop. Due to the fast analysis time of these short columns,
method development time can also be shortened. Multiple columns can be
rapidly screened for optimizing selectivity. Short columns are especially useful
when the components to be separated are known. However, when dealing with
complex samples with unknown components such as forced decomposition or
biological samples, using longer columns may be more judicious to achieve
optimum separation of critical components. After selectivity optimization,
the method can be optimized for speed by reducing column length. The dis-
cussion in this chapter will focus on optimizing speed of analysis and not on
selectivity. The reader is referred to Chapters 4 and 8 on how to optimize
selectivity.
17.2 BASIC THEORY
To understand how to optimize a separation for speed, it is worth revisiting
some of the theoretical concepts developed earlier in this text. The analysis
time, t
a
, is the time it takes for all sample components to elute off a column at
a certain flow rate and is given by
(17-1)
where L is the column length, u is the linear flow velocity of the mobile phase,
and k is the retention factor of the latest-eluting peak. Notice here some
obvious ways to increase the speed of analysis: The length of the column can
be shortened, mobile phase can be pumped at a faster flow velocity, and one
can ensure that the retention of sample components is not prohibitively long.
Once any of these approaches are attempted, however, it is quickly seen that
other important parameters of the separation are affected, principally the res-
olution and the column backpressure. These parameters must be considered
when enhancing the speed of analysis. Ideally, the analyst would like to max-
imize both resolution and speed of analysis, while remaining within the pres-
sure capabilities of the instrument.What is discovered,though, is the inevitable
existence of a trade-off between resolution, analysis time, and backpressure.
Resolution can be enhanced if more time is allowed; conversely, analysis
time can be shortened, but at the expense of resolution. In addition, both
t
L
u
k
a
=+
()
1
766 DEVELOPMENT OF FAST HPLC METHODS
resolution and speed are limited by the constraints of the instrumentation.
T
he interrelationship between these factors will be considered, starting
with the most important parameter describing the quality of our separation—
resolution.
17.2.1 Resolution and Analysis Time
The practical goal of most separations is not to achieve the greatest resolution
possible, but rather to obtain sufficient resolution to separate all components
in the shortest amount of time. To optimize for speed, the starting condition
is that there is a minimum resolution requirement for the separation. Resolu-
tion is a function of three parameters: column efficiency, or theoretical plates
(N), selectivity (a), and the retention factor (k):
(17-2)
Selectivity and retention are influenced by the choice of column chemistry
and the mobile phase and gradient conditions. Due to the trade-off between
resolution and analysis time, any “excess” resolution that can be generated
beyond the minimum requirement can theoretically be traded for shorter
analysis times. In this regard, the power of selectivity cannot be underesti-
mated, especially when a is close to 1. For example, Karger et al. [1] have
shown that an increase in a from 1.05 to 1.10 can result in more than a three-
fold reduction in analysis time. High selectivity also lessens the required the-
oretical plate count necessary to resolve all components, which allows use
of a shorter column to speed up the analysis. Consequently, choosing a
column or using mobile-phase conditions that produce a high relative selec-
tivity between critical peak pairs can be very advantageous for achieving fast
methods. In addition, resolution as well as analysis time depends on the reten-
tion factor. For isocratic conditions, the optimum k for resolution and speed
occurs in the range of 1–10 [1]. For samples containing many components or
with analytes of wide-ranging polarity, gradient elution must then be used to
achieve reasonable analysis times. Optimizing selectivity and retention so as
to maximize resolution and minimize analysis time in gradient separations is
discussed further in Section 17.6.
Beyond these two parameters, the minimum resolution that must be
achieved will require a certain number of theoretical plates, which can be
expressed in terms of the column length and plate height, H,as
(17-3)
From this equation, column efficiency scales directly with column length and
is inversely proportional to the plate height. Solving this equation for L and
N
L
H
=
R
Nk
k
s
=
−
+
4
1
1
2
2
a
a
BASIC THEORY 767
substituting into equation (17-1) results in a useful expression that more
clearly relates analysis time to the quality of the separation:
(17-4)
Note that if the plate height (H) remains constant,
an increase in the
required plate number (N) will require a proportional increase in the analy-
sis time. This is because for a fixed plate height, an increase in plate number
must be obtained by an increase in the column length. Here one encounters
the trade-off between resolution and speed.While it is desirable to use a short
column to limit analysis time, it is also seen that a longer column provides a
higher plate count and resolution. However, resolution increases not with N,
but with , meaning the gain in resolution from lengthening the column will
always be proportionally less than the price paid in time. Consequently, for
fast analyses, columns no longer than that which gives the minimum theo-
retical plates to adequately resolve all peaks should be used.
Note also that t
a
varies with the ratio H/u. Equation (17-3) shows that reduc-
ing the plate height is one way to obtain higher theoretical plates without
increasing the column length. Now it is seen that for a fixed plate number (the
plates needed to achieve the resolution requirement), decreasing the plate
height will shorten analysis times by allowing use of a shorter column. As dis-
cussed in the next section, though, plate height is dependent on the linear
velocity. Thus, when optimizing for speed, the two must be considered
together.The goal, then, is not just to reduce H, but to minimize H/u.This will
favor both high resolution and short analysis times. Minimizing H/u, then,
encompasses the heart of what is desired in a fast HPLC method—greatest
resolution per unit of time.
Exploring this concept a little further, knowing that H = L/N and u = L/t
0
,
substituting in these relationships results in
(17-5)
This is known as the “plate time” and has units of seconds. It is equivalent to
the amount of time it takes to generate one theoretical plate. Its inverse would
be “plates per second,” N/t
0
. Plates per second may also be expressed more
generally as N/t for elution times other than the void time [2, 3]. These terms
more effectively describe the criteria of resolution per unit time that are
desired to be maximized (actually, N/t is proportional to resolution squared
per time); unfortunately, they are not widely used in the literature, and for the
sake of continuity will not be used in this discussion. The following sections
will look at what influences plate height and velocity and how best to mini-
mize H/u.
H
u
t
N
=
0
N
t
NH
u
k
a
=+
()
1
768 DEVELOPMENT OF FAST HPLC METHODS
17.2.2 Plate Height and Band-Broadening
Plate height is a measure of peak-broadening and column performance:
Reducing or eliminating sources of band-broadening should be a main goal
when choosing columns and instrumentation,
and otherwise developing
methods. Plate height can also be described in terms of its dependence on the
linear flow velocity, u, by the van Deemter equation [4]:
(17-6)
where A, B, and C are the coefficients for “eddy” diffusion, longitudinal dif-
fusion, and resistance to mass transfer, respectively. A plot of H versus u is
often referred to as a van Deemter plot and is shown in Figure 17-1 along with
plots of the individual terms that comprise it. While other, more complex and
theoretically correct equations have been derived [5–8], the simplicity of the
van Deemter equation makes it useful in understanding sources of band-
spreading and how to minimize them. Each of the three terms in the equation
represents a contribution to the broadening of a peak and will be examined
in more detail.
The A term of the van Deemter equation is independent of the mobile-
phase linear velocity and describes the broadening that occurs due to the mul-
tiple flow paths present within the column. Since these paths are of different
lengths, molecules will travel different distances depending on what flow paths
they experience. For a column bed of randomly packed particles, the A term
is proportional to the particle diameter, d
p
, and to a factor λ related to the
packing structure:
HA
B
u
Cu=++
BASIC THEORY 769
Figure 17-1. van Deemter plot showing contribution of individual terms
.
(17-7)
T
he B term describes broadening due to axial molecular diffusion and is
inversely proportional to the linear velocity. In other words, the faster an
analyte zone migrates through the column, the less broadening due to diffu-
sion it will experience. The B term coefficient is given by
(17-8)
where D
M
is the diffusion coefficient of the analyte in the mobile phase, and γ
is the tortuosity or obstruction factor, accounting for the obstruction to diffu-
sion presented by the packing material.
The C term, or resistance to mass transfer term, is a complex agglomera-
tion of all broadening that becomes worse with increasing flow velocity.
Multiple contributions to the C term have been described; however, for the
purposes of this discussion the focus will only be on the relationships relevant
to improving resolution per unit time. In general, C is related to the diffusion
coefficient D of the analyte in the medium through which mass transfer is
taking place, and it is also related to the square of the distance d over which
it occurs. Fast diffusion and short diffusional distances aid mass transfer and
reduce band-spreading; hence, the C term takes the form
(17-9)
For example, for the mass transfer in the bulk mobile phase between
stationary-phase particles, D becomes the diffusion of the analyte in the bulk
mobile phase, D
M
, and d becomes the distance between particles, which is
roughly proportional to the particle diameter, d
p
. The mobile-phase C term
expression C
M
can therefore be approximated as
(17-10)
When looking at the individual plate height equations, some important rela-
tionships are noticed. The B term worsens at slower flow velocities and with
faster molecular diffusion. In contrast, C-term broadening worsens at faster
velocities, but improves with faster molecular diffusion. These opposing phe-
nomena are what cause the van Deemter curve to possess a minimum plate
height at some intermediate velocity (the optimum velocity, u
opt
). It can also
be seen from Figure 17-1 that the increase in plate height is more abrupt at
the low velocity end of the curve (where broadening is dominated by the B
term) than it is at the high velocity side (where the C term is dominant). Since
conditions that favor speed are desired, operating at velocities greater than
C
d
D
M
p
M
∝
2
C
d
D
∝
2
BD
M
= 2g
Ad
p
= l
770 DEVELOPMENT OF FAST HPLC METHODS
the optimum velocity without significantly sacrificing efficiency is advanta-
geous
.
Although the B and C terms exhibit opposite relationships with analyte dif-
fusion, the C-term relationship is mainly of interest because resistance to mass
transfer is the dominant form of band-spreading at the faster velocities that
are desired. Equations (17-9) and (17-10) imply that speeding up diffusion will
increase mass transfer and help decrease plate height.The Wilke–Chang equa-
tion [9] shows that diffusivity is directly proportional to temperature and
inversely proportional to viscosity:
(17-11)
where T is temperature, h is the solvent viscosity, V
1
is the molar volume of
the solute, M
2
is the molecular weight of the solvent, and Y
2
is a solvent asso-
ciation factor. Since mobile-phase composition largely dictates the selectivity
of our separation, varying the viscosity of the mobile phase directly by the
selection of solvents may not be an option. Raising the temperature of the
mobile phase, then, is the most effective way to speed up diffusion. It also has
the added benefit of lowering the mobile-phase viscosity, thereby increasing
diffusion indirectly. This all serves to reduce the plate height at faster veloci-
ties. As shall be seen in the next section, raising the temperature also speeds
up the analysis by lowering the pressure drop across the column.
The plate height relationships also show that the A term is dependent on
the particle diameter, and the mobile-phase C-term is dependent on the par-
ticle diameter squared. Reducing the diameter of the packing material is there-
fore a powerful approach for reducing plate height. The minimum attainable
plate height for a column, H
min
—that is, the plate height occurring at the
optimum velocity u
opt
—will be proportional to d
p
. When operating at veloci-
ties greater than u
opt
, the quadratic dependence of C on d
p
means that the
reduction in plate height is especially significant. This makes sense, since mass
transfer will improve as the distances molecules must travel become smaller.
That is, smaller particles result in smaller interparticle spaces and thus shorter
diffusional distances. By using a smaller particle size, the slope of the C-term
side of the van Deemter curve will decrease dramatically, allowing operation
at higher velocities without having to sacrifice as much in resolution compared
to larger particles. This is illustrated in Figure 17-2, which shows the perfor-
mance of columns packed with 1.7-, 3-, and 5-µm particles. Smaller plate
heights and higher velocities are made possible, thus considerably reducing
H/u. As a result, one should aim to keep the particle diameter as small as
possible.
Since the goal is to reduce analysis time by minimizing H/u while holding
N constant (at the minimum required plate count), the approximation can
be made that H ∝ d
p
, and therefore N ∝ L/d
p
. This means as the particle
diameter is reduced, the column length must also be reduced proportionally.
D
MT
V
=×
−
74 10
8
22
1
06
.
.
Ψ
h
BASIC THEORY 771
Holding L/d
p
constant while both length and particle size are decreased is
therefore one of the most effective means of achieving fast separations
. This
is the motivation seen in the evolution of chromatography columns over the
last few decades. Where once the 25-cm column packed with 5-µm particles
was the standard workhorse analytical column, now 10- and 15-cm columns
packed with 3-µm particles are used. As column technology continues
to improve, even shorter columns packed with particles <3µm are being
introduced.
To illustrate more clearly the effect of these variables on analysis time,
reduced parameters can be used for the plate height and velocity. Reduced
parameters effectively normalize the plate height and velocity for the particle
diameter and the diffusion coefficient to produce dimensionless parameters
that allow comparison of different columns and separation conditions. The
reduced plate height and reduced velocity are expressed, respectively, as
(17-12)
(17-13)
Solving these equations for H and u, respectively, and substituting into
equation (17-4) yields
(17-14)
t
h
v
d
D
Nk
a
p
M
=+
()
2
1
v
ud
D
p
M
=
h
H
d
p
=
772 DEVELOPMENT OF FAST HPLC METHODS
Figure 17-2. Performance of 2.1- × 100-mm columns packed with 1.7-, 3.5-, and
5-µm particles. Stationary phase was bridged-ethyl hybrid C18 prototype material in
each case.
The benefit of reducing the particle diameter on separation time is most
evident here
. It is also seen that increasing diffusion will speed up the
analysis.
Now that the factors affecting plate height have been examined, it is time
to turn to the effect of linear velocity and the limitation of pressure on the
resolution per unit time.
17.2.3 Flow Velocity and Column Backpressure
It is known that increasing the linear flow velocity of the mobile phase will
lead to faster separations. But since H is dependent on u, what velocity is
needed to maximize the resolution per unit time (minimize H/u)? Using the
van Deemter equation, H/u may be expressed as
(17-15)
From this equation, H/u approaches its minimum value of C as u becomes
large. In other words, the separation should be performed at the fastest veloc-
ity possible. (Note also that this represents mathematically what was presented
in the previous section; that is, in the case of optimizing for speed, the sepa-
ration is dominated by the C-term.) This doesn’t mean that the resolution itself
will improve—on the contrary, since H generally increases with velocity when
u > u
opt
, resolution will worsen—but that the resolution per unit time is improv-
ing.Again, since the quality of the separation must not be sacrificed, the speed
of analysis can be improved only to the point where resolution can no longer
be sacrificed.
Of course, the ability to increase u depends on the pressure capabilities of
the instrument, since pressure is directly proportional to velocity:
(17-16)
where ∆P is the pressure drop across the column, η is viscosity, and φ is the
flow resistance factor. Thus the speed of analysis is limited by the maximum
pressure capability of the instrument. As a result, the most should be made of
the pressure available by reducing the pressure drop across the column as
much as possible.
Decreasing the column length lowers the pressure requirement propor-
tionally, allowing use of the available pressure to gain an advantage in speed.
Column efficiency, however, drops with use of a shorter column and at faster
velocities. Care must therefore be taken to ensure that resolution between
peaks is not lost when decreasing analysis time in this manner.
Lowering the viscosity of the mobile phase is another way to lessen the
required pressure. This may be accomplished by raising the column tempera-
∆P
uL
d
p
=
ηφ
2
H
u
A
u
B
u
C=+ +
2
BASIC THEORY 773
ture. Increasing temperature has the double advantage of allowing use of a
higher flow velocity and speeding up diffusion,
both of which appear in the
denominator of equation (17-14).This is a strong motivator for the use of tem-
perature above ambient conditions in order to speed up the separation. Of
course, sample degradation, the boiling point of our mobile phase, stability
of the stationary phase, and the capability of the column heater limit the
maximum temperature that can be used. Temperatures up to about 70°C are
considered routine; beyond that, columns and heaters specifically designed for
high-temperature chromatography are needed. Much research has been done
in the area of elevated-temperature chromatography, where interesting possi-
bilities arise, such as the use of temperature gradients and purely aqueous
mobile phases [10]. Chapter 18 elaborates on the use of temperature in chro-
matography for pharmaceutical applications.
The velocity we can obtain at a given pressure will also be limited by the
resistance to flow presented by the column, known as the specific column
permeability. In equation (17-16) the permeability is broken up into its two
main components: the flow resistance parameter, φ, and the particle diameter
squared, d
p
2
, and can be expressed as
(17-17)
where ε is the interstitial porosity of the column (i.e., the fraction of the total
column volume occupied by the interparticle space), usually about 0.4. The
flow resistance parameter is given by
(17-18)
and is purely a function of the porosity of the column—that is, the packing
density. Its value is essentially fixed for a given column and out of the analyst’s
control. The quantity f/e, represented by the symbol Φ, has a value around
1000 for well-packed columns [11].
Reducing the particle diameter can be a powerful way to gain speed in sep-
arations. On the other hand, equation (17-16) shows an inverse quadratic rela-
tionship of pressure to the particle diameter. This strong dependence means
that an enormous price in pressure is paid for reducing the particle diameter.
However, it was stated previously that when reducing the particle diameter
the column length can be reduced as well to keep L/d
p
constant. Since pres-
sure scales with column length, this eases the pressure requirement. But even
keeping L/d
p
constant, the pressure will still go up with 1/d
p
. Eventually, the
upper pressure limit of the pump will be reached and it won’t be possible to
further reduce d
p
without either a proportionally greater reduction in L, which
reduces the efficiency, or a relatively smaller linear velocity, which cuts back
on speed. Because u
opt
increases in proportion to 1/d
p
, the maximum pressure
f
e
e
=
−
()
185 1
2
2
B
d
p
0
2
=
ε
φ
774 DEVELOPMENT OF FAST HPLC METHODS
of the system may not be able to reach a velocity beyond the optimum, and
the plate height may suffer
. Finally,as the column length becomes ever shorter,
the column volume becomes smaller relative to the volume of the tubing,
injector, and detector. In this circumstance, extra-column band-broadening
becomes a significant issue (see Section 17.7 of this chapter). With standard
commercial pumps having an upper pressure limit of ∼400 bar (∼6000psi) and
columns now being produced with particles <2µm in size, that practical limit
has now been reached. This demonstrates that the upper pressure limit of the
instrument becomes the limiting factor for the resolution per unit time and
speed of analysis that may be obtained.
There are a few approaches to the problem of the pressure limitation that
have gained in popularity in recent years. Monolithic columns replace the
bed of packed particles entirely and instead use a “monolithic” polymerized
porous structure synthesized in situ.These columns are able to produce equiv-
alent efficiencies of packed particle columns but with much lower flow resis-
tances, enabling much higher velocities. Another approach is to develop
instrumentation capable of much higher pressures than is possible with con-
ventional systems. This technique is termed ultra-high-pressure liquid chro-
matography (UHPLC). With the pressure maximum now much higher, the
limitations on particle size and column length can consequently be extended
even further, allowing even greater resolution per unit time and speed of
analysis. The subjects of monolithic columns and UHPLC are covered in the
next two sections of this chapter.
17.3 MONOLITHIC COLUMNS
Both the speed and efficiency attainable by an HPLC column are ultimately
limited by the maximum pressure capabilities of the instrument. In the
case of particle-packed columns, decreasing the particle diameter leads to
improved efficiency and speed; however, because DP is proportional to 1/d
p
2
,
the price paid in pressure will always be proportionally greater than the
gain in column performance. Monolithic columns are a viable alternative to
particle-packed columns as a means to achieving efficient separations while
overcoming the pressure limitation due to their comparably higher perme-
abilities (lower flow resistances) [12]. High efficiencies together with lower
pressure drop make monolithic columns attractive options for fast HPLC.
17.3.1 Physical Properties and Preparation of Monolithic Columns
A monolithic column is a single interconnected skeletal stationary-phase
support structure consisting of large-flow through-pores (1–3µm). The key to
high permeability is that this network support structure can be made in such
a way that the ratio of the through-pore size to the skeleton size is much
greater than can ever be obtained by a column packed with individual spher-
MONOLITHIC COLUMNS 775
ical particles. While the interstitial porosity of spherical particle-packed
columns is typically ∼0.4,
monolithic columns exhibit external porosities of
∼0.6–0.7. When the intraparticle pores in spherical particles and mesopores in
the monolithic skeleton are included, the total porosities are on the order of
∼0.65–0.75 for particulate columns and on the order ∼0.80–0.90 for monolithic
columns.The presence of the mesopores (10–25nm) supplies sufficient surface
area for retention, around 300m
2
/g, which is comparable to most porous silica
particles [13].
Monolithic columns are generally prepared by the in situ polymerization of
either organic or inorganic monomers to form the skeletal support. Organic
polymer monoliths are produced by nucleation and growth, followed by aggre-
gation to form the network structure. Control of the polymerization kinetics
determine the size of the macro- and mesopores.A main drawback of polymer
monoliths, however, is that polymers tend to swell or shrink in the presence
of organic solvent, which leads to poor chromatographic performance and a
lack of mechanical stability under pressure-driven flow. Monolithic silica
columns are prepared using a sol–gel method by hydrolytic polymerization of
alkoxysilanes to form the skeleton. Physical features such as through-pore size
and skeletal size can be more precisely controlled in the preparation of silica
monoliths. In addition, the chemical and mechanical stability of silica mono-
liths is better than polymeric columns. However, due to shrinkage during solid-
ification, silica monoliths cannot be prepared in situ, but must first be prepared
in a mold, and then removed and encased in PEEK tubing before bonding of
stationary phase takes place [13, 14].
17.3.2 Chromatographic Properties and Applications of
Monolithic Columns
In addition to higher permeabilities, another advantage of monoliths is
improved (that is, decreased) mass transfer broadening. In packed columns,
flow occurs through the interstitial spaces between particles, while mobile-
phase transport inside the pores occurs predominantly by diffusion. By
contrast, due to the high porosity of monolithic columns, a much greater
percentage of mobile phase transport is accomplished by flow. Where diffu-
sion does occur, in the mesopores, the shorter diffusion path lengths afforded
by the small skeleton sizes aids in mass transfer.This is especially true for large
molecules such as proteins that have small diffusion coefficients. Accordingly,
a silica-based monolith (Chromolith, Merck, Darmstadt, Germany) demon-
strates efficiencies comparable to a column of identical dimensions packed
with 3-µm particles, while exhibiting backpressures comparable to that of
11-µm particles [15]. Wu et al. [16] performed van Deemter analysis on
columns packed with 3- and 5-µm particles and on a commercially available
monolithic column (Figure 17-3). The minimum plate height of the monolithic
column was similar to the 3-µm particle column; however, the slope of the
high-velocity, C-term side of the plot was lower, enabling faster velocities.
776 DEVELOPMENT OF FAST HPLC METHODS
Silica monoliths have been applied to peptide separations [17, 18] as well as
to small-molecule pharmaceutical development samples [16,
19].
Monolithic columns do have disadvantages. Although very high flow rates
are used to speed up separations, this generates a considerable amount of
solvent waste for ≥4.6-mm-bore columns. The number of phases and column
sizes is very limited at present, as is the number of commercial manufactur-
ers. Also, the technology of particle-packed columns is not static, but contin-
ues to improve as well. Monolithic columns have not yet demonstrated
the performance capabilities exhibited by sub-2-µm particles and UHPLC.
However, advances in monolithic column technology in the years to come
promise to bridge that gap.
17.4 ULTRA-HIGH-PRESSURE LIQUID CHROMATOGRAPHY
The increase in resolution and speed of analysis afforded by reducing the par-
ticle diameter has resulted in a trend of using smaller particles in shorter
columns. Columns packed with particles less than 2µm in size, however, chal-
lenge the pressure capabilities of conventional HPLC instrument technology,
which operate up to ∼400 bar. Since chromatographers generally should
operate at or above the optimum flow velocity for a given column, even
extremely short columns with these particles reach the system pressure limits
before their full benefits can be realized. A straightforward approach to take
full advantage of sub-2-µm particles is to develop instrumentation capable of
the requisite pressures.
In 1997, the laboratory of James Jorgenson at the University of North
Carolina [20, 21] was the first to demonstrate this approach by introducing
ULTRA-HIGH-PRESSURE LIQUID CHROMATOGRAPHY 777
Figure 17-3. van Deemter curves for packed (YMC C
18
) and monolithic (Chromolith)
4.6- × 100-mm columns. (Reprinted from reference 16, with permission from Elsevier.)
UHPLC. They utilized long (>50
cm) fused silica capillary columns packed
with 1.5-µm nonporous silica reversed-phase particles and pressures as high
as 4100 bar to achieve greater than 200,000 theoretical plates.The tremendous
improvement in performance that was demonstrated over conventional
columns (i.e., stainless steel tubes 3–4.6mm in diameter packed with particles
3–5µm in size) generated significant interest in this technique. A number of
academic research labs have subsequently conducted research using UHPLC
with nonporous particles, notably the laboratories of Milton Lee (Brigham
Young University) [22–29] and Luis Colón (SUNY—Buffalo). [30, 31] The
practical challenges and limitations of the technique have largely limited its
use to research environments. However, the recent development of porous sta-
tionary-phase material in the sub-2-µm range [32, 33] and the introduction in
2004 of the first commercial instrumentation are steps toward making UHPLC
a viable tool for pharmaceutical analysis.
Two pressure regimes have been described: very-high pressure LC
(VHPLC), for the pressure range of about 400–1500 bar, and ultra-high pres-
sure LC (UHPLC), for pressures >1500 bar. [20, 21, 34] This naming conven-
tion is not strictly adhered to, however, and it is often common to refer to
anything above the conventional HPLC pressure limit of 400 bar as UHPLC.
Ultra-high-pressure LC will find its greatest utility for complex samples con-
taining dozens or even hundreds of components (e.g., samples of biological
nature) where extremely high resolving power is needed. For such applica-
tions, long, highly efficient columns packed with micron-sized particles run at
ultra-high pressures are desirable. Very-high-pressure LC is well-suited for
applications where it is not so much high resolution that is needed, but fast
analysis times. Samples containing less than 15–20 peaks, such as those encoun-
tered in pharmaceutical development (e.g., small-molecule pharmaceutical
compounds and related impurities and degradation products), can be sepa-
rated in a matter of seconds to minutes using short columns with particles 1–
2µm in size at pressures moderately higher than conventional HPLC.
Although these columns offer only a marginal improvement in efficiency over
conventional HPLC columns, their advantage lies in speed of analysis due to
smaller particles, shorter column lengths, and higher pumping pressures (see
Section 17.2 of this chapter). Of course, VHPLC used with longer columns can
provide an improvement in efficiency for the separation of complex samples
as well. Due to the challenges of constructing ultra-high-pressure instrumen-
tation and manufacturing porous micron-sized stationary-phase materials, the
logical first step is a chromatographic system in the very-high-pressure realm
using 1.5- to 2-µm particles. This will allow a significant gain in speed and a
reasonable improvement in separation power of analytical HPLC methods.
Commercial products are now available that meet these goals. With continu-
ing research and advances in instrument and column technology, it is hoped
the goal of a commercial ultra-high-pressure LC system can be realized in the
near future.
778 DEVELOPMENT OF FAST HPLC METHODS
17.4.1 Instrument Considerations when Using Ultra-High Pressures
A number of concerns arise when using ultra-high pressures in chromatogra-
phy
. The most obvious is the engineering challenge associated with operating
at such pressures.The pumps, pump seals, tubing, connections, valves, columns,
and other hardware must be able to reliably withstand and operate at the pres-
sures required. Careful consideration must be given to the pressure limitations
of instrument components and the design of the system. This necessitates at a
minimum a comprehensive improvement in existing HPLC technology and
may require altogether new designs of instrument components, such as pumps,
injectors and autosamplers, columns, and detectors.
For this reason, initially all UHPLC systems were custom-made instru-
ments. Jorgenson described a constant pressure isocratic system consisting of
a Haskel
®
air-driven pneumatic pump and high-pressure tubing and fittings
capable of pressures up to 7000 bar [20]. A stainless steel static-split injection
valve and column fittings were designed and constructed in-house. Slurry-
packed fused silica capillary columns were prepared in-house as well. Similar
systems with lower pressure capabilities were constructed in other labs [22,
30].A largely custom-made constant flow gradient system with a pressure limit
of 5000 bar has also been described [21]. While these instruments have been
successful in an academic research environment, they lack the ruggedness, reli-
ability, and ease of use required in an industrial setting.Toward that aim,Tolley
et al. [34] modified a commercially available pump to achieve pressures in
excess of 1200 bar for use with capillary columns 22cm long packed with
1.5-µm nonporous particles. Finally, commercially available systems with
upper pressure limits of 1000 bar have been introduced. Although this repre-
sents a moderate increase over the conventional HPLC pressure limit when
compared to the systems just described, it allows use of sub-2-µm particles in
a system capable of meeting the rigorous requirements for use in the phar-
maceutical industry.
Special consideration must be given to the injection valve.The moving parts
and sample handling requirements make sample introduction at ultra-high
pressures a challenge. A number of parameters must be considered: pressure
limitation, injection volume range, injection accuracy (i.e., delivery of mass on
column), precision (i.e.,peak area reproducibility), linearity of response versus
injection volume, injection cycle time, and finally the amount of broadening to
the sample plug caused by the injector. The first static-split UHPLC injectors
accomplished an injection by applying pressure over several seconds to intro-
duce a small plug of sample onto the head of the column. The actual injection
volume is difficult to determine and reproducibility is poor, precluding use of
this injector for quantitative analysis. A number of commercially available
injectors capable of high pressures have been evaluated with UHPLC. One
such system was a novel pressure-balanced rotary injection valve from Valco
Instruments that was employed by Wu et al. [24]. It operated at pressures up
ULTRA-HIGH-PRESSURE LIQUID CHROMATOGRAPHY 779
to 1200 bar and demonstrated superior peak area reproducibility (<2% RSD
,
n = 5) compared to the custom-built static-split injectors. Recently, an air-
actuated needle valve injection system, also from Valco, rated to withstand
2700 bar and capable of injection cycle times of <2 seconds was evaluated inde-
pendently by both Anspach et al. [35] and Xiang et al. [36]. Injection repro-
ducibility of ≤1.5% RSD (n = 5) was obtained at 2000 bar for injection volumes
of 1–2.5µL [35]. Given the challenges of performing injections under high-
pressure conditions, it is strongly recommended that the injection performance
of a high-pressure instrument is evaluated before developing methods for
highly accurate quantitative analyses. Doing this during performance qualifi-
cation (PQ) of the instrument or an initial vendor evaluation before purchas-
ing is best. Precision (peak area, peak height, and retention time), accuracy
(recovery of mass injected on column), and linearity are parameters that
should be investigated. In order to routinely meet system suitability criteria,
it is recommended that an instrument be able to achieve ≤1% RSD (n = 6)
for peak area and peak height precision.
Due to the high efficiency afforded by sub-2-µm particles, it is crucial that
extra-column broadening be kept to a minimum [37]. With fused silica capil-
lary columns it is possible to introduce sample directly onto the head of the
column and to perform on-column detection, thereby essentially eliminating
extra-column sources of broadening. This is usually not the case with more
conventional column dimensions and instrumentation. The tubing, connec-
tions, the injector, and the detector flow cell all add extra-column volume to
the system which will contribute to analyte band-spreading. Extra-column
broadening and instrument requirements for highly efficient columns is dis-
cussed further in Section 17.7.3.
Extremely narrow peak widths will present challenges for detection. The
data acquisition rate must be sufficiently fast to sample enough data points to
accurately define the peak.A good rule of thumb is to acquire at least 15 points
per peak. Peaks on the order of 1 second wide will also challenge the cycle
times of scanning mass spectrometers. For fast, highly efficient chromatogra-
phy, a time-of-flight (TOF) mass analyzer may be the best option for very fast
detection. Detector requirements for fast LC is covered in more detail in
Section 17.7.2.
Currently the availability of columns packed with sub-2-µm stationary-
phase material is rather limited. This situation will likely change as the use of
UHPLC proliferates and the demand for such columns is more widespread.
Until recently, the only stationary phase materials available in the sub-2-µm
regime were nonporous silica particles. They are much easier to synthesize in
this size range than are porous materials, and their mechanical strength allows
them to be used at pressures up to 7000 bar [38]. They also have the advan-
tage of greater efficiency than porous particles of equivalent size due to the
lack of additional band-broadening contributions presented by the pores. All
the initial work demonstrating the principles of UHPLC was consequently
performed on nonporous materials. Their obvious drawback, however, is their
780 DEVELOPMENT OF FAST HPLC METHODS
poor loading capacity—up to 100 times less sample may be loaded onto non-
porous particles compared to porous particles
. This drastically limits the sen-
sitivity obtainable using such columns and may require alternate detection
schemes or derivitization of the sample.Also, very small injection volumes that
challenge the capabilities of the injector may be required. As a result, the use
of conventional columns packed with nonporous particles has been limited to
specific applications in pharmaceutical analysis such as protein and peptide
separations, where sample volumes are often very small and the slower mol-
ecular diffusivities make the absence of pores especially beneficial due to the
decreased C-term band-broadening. The development of high-quality porous
particles 1–2µm in size for use with elevated pressures has therefore been a
necessary and critical advancement for UHPLC [32, 33].The superior loading
capacity of these materials makes them practical for most pharmaceutical
analyses. Such columns are still susceptible to the crushing of particles at high
pressures, which will manifest itself as rising backpressure due to plugging of
the column.Another problem that may arise is the compression of the packed
bed inside the column, leaving a void at the column head which will result in
distorted peak shapes. Care should be taken not to operate a column at a pres-
sure higher than that at which the column was packed. To avoid this, columns
should be packed at pressures several hundred bar greater than the maximum
pressure at which it is to be used.
Finally, the safety of UHPLC must also be considered. Rupture or failure
of seals, tubing, and fittings can present a potential danger to the user. With
proper instrument design and normal safety precautions, however, UHPLC
can be safe to use [38].This is especially true of commercial instruments, which
are no more dangerous than any other HPLC.
17.4.2 Chromatographic Effects of Ultra-High Pressures
Another concern is the potential for frictional heating inside the column.
Forcing mobile phase through the column at such pressures will generate heat
that may cause a significant rise in the temperature of the mobile phase [40,
41]. As heat is dissipated from the column walls, axial and radial temperature
gradients will form within the column. The resulting differences in analyte
diffusivity and retention within the column will lead to additional band-
broadening.The power (heat) generated by flow through a packed bed is equal
to the product of the flow rate (F) and the pressure drop across the column
(∆P):
(17-19)
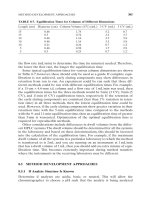
Table 17-1 shows the power generated by pumping mobile phase through
100-mm long columns of various diameters packed with 1.5-µm particles at a
linear velocity of 3mm/s and a pressure of ∼900 bar. One can see that at this
pressure a standard-bore 4.6-mm-i.d. column generates 3.0W of heat. For
PFP=∆
ULTRA-HIGH-PRESSURE LIQUID CHROMATOGRAPHY 781
comparison, consider conditions typically encountered in conventional HPLC.
A 4.6- × 100-mm column packed with 3-µm particles operating at 1
mL/min
(corresponding to 1.5mm/sec) will require 170 bar and generates only 0.19W
of heat. Columns larger than 2.1mm in diameter would therefore be undesir-
able for pressures and conditions outlined in Table 17-1. As the particle size
is reduced even further—to 1.0µm, for example—or as the column is length-
ened, the operating pressures become correspondingly greater and even more
heat is generated. This pushes the largest usable column diameter to under
1.0mm. Thus, the frictional heating effect serves as a strong motivator for the
use of capillary columns in UHPLC. Patel et al. [42] investigated the effect of
flow-induced heating in capillary columns up to 150µm in diameter packed
with 1.0-µm particles and found negligible effects on column efficiencies.
Indeed, the vast majority of academic research in UHPLC has been performed
in fused silica capillaries less than 100µm in diameter.
Thought must also be given to the possible chromatographic effects arising
from changes in the retention factor of analytes and the compressibility of the
mobile phase as a function of pressure. It has been shown that retention factors
for small molecules increase linearly with pressure [42]. This increase is mod-
erate, however, and does not significantly affect analysis time. Because of the
compressibility of the mobile phase at ultra-high pressures, a situation that is
familiar in gas chromatography results:The volumetric flow rate will be greater
at the outlet of the column than at the inlet as the compressed mobile phase
expands at lower pressures.The magnitude of this difference will vary depend-
ing on the solvent composition and pressures used. In practice, this means the
measured flow rate at the outlet of the column will be greater than the flow
rate to which the pump piston is set. Other than some theoretical considera-
tions, the changes of retention factor and flow rate with pressure will have no
adverse effects on a chromatographic run. One consequence has been noted,
however, for UHPLC systems that perform injections while the column is off-
line of the pump or otherwise at atmospheric pressure [43]. In such systems,
sample is introduced onto the head of the column and then pressure is sub-
sequently applied to the column to start the run. When this occurs, the mobile
782 DEVELOPMENT OF FAST HPLC METHODS
TABLE 17-1. Power Generated Due to Frictional Heating of the Mobile Phase at a
Linear Velocity of ~3mm/sec in Columns of Varying Diameter Packed with 1.5-mm
Particles
a
Column Dimensions Flow Rate Power Generated
4.6 × 100mm 2.0mL/min 3.0W
3.0 × 100mm 0.85mL/min 1.3W
2.1 × 100mm 0.41mL/min 0.60W
1.0 × 100mm 92µL/min 130mW
0.30 × 100mm 8.5µL/min 13mW
a
In all cases, column backpressure is ∼900 bar. A solvent viscosity of 1.0cP was used for all
calculations.
phase inside the column becomes rapidly compressed in volume. This com-
pression causes a surge in velocity at the head of the column,
which contributes
significantly to broadening of the sample band. An injector that performs
injections while the column is pressurized must be used in order to circum-
vent this problem.
The use of ultra-high pressure in LC was found to have beneficial effects
on protein recovery [44]. By using pressures >1600 bar, protein recovery was
enhanced and carry-over from run to run was reduced and in some cases elim-
inated. While the mechanism of recovery is not known, it was postulated that
ultra-high pressures improve desorption from the stationary phase surface by
causing partial unfolding or deaggregation of the proteins.
17.4.3 UHPLC Applications
Isocratic separation of test compounds is a useful way to demonstrate the per-
formance of a system. Basic chromatographic characteristics, such as theoret-
ical plates, are easily measured and can be compared to what is expected from
theory and to performance of other chromatographic systems. Figure 17-4 is
a UHPLC chromatogram obtained under isocratic conditions on a 43-cm-long
capillary column packed with 1.0-µm nonporous C18 particles (Eichrom
ULTRA-HIGH-PRESSURE LIQUID CHROMATOGRAPHY 783
Figure 17-4. Chromatogram obtained on a column packed with 1.0-µm nonporous par-
ticles at a run pressure of 3000 bar
. (Reprinted from reference 37, with permission.)
Scientific, Darien, IL). Five compounds—ascorbic acid (dead time marker),
hydroquinone
, resorcinol, catechol, and 4-methyl catechol—were eluted with
a 10/90 (v/v) acetonitrile/water mobile phase containing 0.1% TFA and were
detected with amperometric detection (+1.0V versus Ag/AgCl). The chro-
matogram was obtained near the optimum linear velocity at a run pressure of
3000 bar.All compounds eluted in less than 8 minutes, with efficiencies ranging
from a low of 244,000 plates for 4-methyl catechol to as high as 330,000 plates
for hydroquinone. These correspond to about 570,000 and 770,000 plates/m,
respectively—much higher than the 150,000 plates/m typically seen with con-
ventional columns.
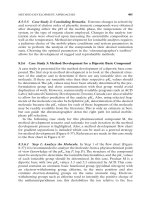
The potential for fast gradient separations is shown in Figure 17-5.A series
of phenones was separated by an extremely fast gradient in the very-high pres-
sure regime, at about 750 bar (11,000psi). This separation was accomplished
in less than 1 minute and was performed on a commercially available high
pressure instrument and column packed with 1.7-µm porous bridged-ethyl
hybrid C18 particles. All peaks are less than 2 seconds wide and are baseline
resolved. The data acquisition rate was set at 20pts/sec.
A more complex gradient UHPLC separation of a tryptic digest of the
protein bovine serum albumin is shown in Figure 17-6. This sample contains
hundreds of peptide fragments and requires a separation method with large
peak capacity. The sample was run with gradient elution using constant-flow
pumps at 3600 bar on a 38-cm-long capillary packed with 1.0-µm nonporous
C18 particles. The peptides from the digest were tagged with the fluorophore
tetramethylrhodamine isothiocyanate (TRITC) and detected by laser-induced
fluorescence. Since it is not valid to calculate theoretical plates under mobile-
phase gradient conditions, peak capacity is used as an alternative measure of
the separating power of a system. Peak capacity is defined as the total number
784 DEVELOPMENT OF FAST HPLC METHODS
Figure 17-5. Gradient separation of, in order of elution, acetophenone, propiophenone,
n-butyrophenone, valerophenone, hexanophenone, heptanophenone, and octanophe-
none, performed on a Waters Acquity UPLC
TM
instrument. Column: 2.1 × 100 mm,
1.7-µm ACQUITY BEH C18. Gradient: 50–90% acetonitrile in 1.0 minutes. Column
temperature 35°C.
of peaks separable with unit resolution in a given separation space. In the chro-
matogram shown,
the peak capacity between 48 and 168 minutes is approxi-
mately 500, with an average peak width of 14.5 seconds. This is significantly
higher than the peak capacities of conventional HPLC columns packed with
5-µm particles, which tend to be below 200 for similar samples.
Low flow rates and narrow peak widths make capillary UHPLC particu-
larly suitable for coupling with mass spectrometry via nanoelectrospray ion-
ization [23, 45]. Tolley et al. [34] have used very-high pressures of around 1000
bar (15,000psi) to separate bovine serum albumin digests on columns packed
with 1.5-µm nonporous reversed-phase particles by gradient elution, with
quadrupole/time-of-flight (Q-TOF) tandem mass spectrometry for detection.
Figure 17-7 is a base peak index (BPI) chromatogram of 12.5fmol of a BSA
digest on a 150-µm × 22-cm column packed with 1.5-µm nonporous C18 par-
ticles. A 30-minute gradient from 1 to 45% acetonitrile in water with 0.5%
formic acid was used. A 20-fold enhancement in sensitivity over nanoelectro-
spray MS/MS was observed.
17.4.4 Method Transfer Considerations
The significant gains in speed and resolution are strong motivators to transfer
existing HPLC methods to a commercial ultra-high-pressure instrument. This
can be accomplished fairly easily with a few simple steps. First, a UHPLC
column that is appropriate for the separation must be selected. One with selec-
tivity similar to that of the original column is preferred. Choice of column
ULTRA-HIGH-PRESSURE LIQUID CHROMATOGRAPHY 785
Figure 17-6. UHPLC gradient separation of a tryptic digest of bovine serum albumin.
A peak capacity of 500 was obtained between 48 and 168 minutes. (Reprinted from
reference 37, with permission.)
diameter, length, and particle size should be made in accordance with the prin-
ciples discussed in this chapter and with the overall goal of the method trans-
fer (i.e
., to speed up the existing separation or to obtain greater resolution of
components).
Second, the method should be scaled geometrically to account for differ-
ences in column dimensions. The scaling equations can be found in Section
17.7.4. Once these parameters are scaled, the flow rate can then be increased
to speed up the separation. With an increase in flow rate the gradient times
must again be adjusted proportionally (e.g., doubling the flow rate requires
gradient times to be halved). The optimum flow velocity for the separation
must be kept in mind, however. A column with smaller stationary-phase par-
ticles will have a higher optimum velocity, so the new scaled method may not
be at optimum conditions. The molecular weight of the analyte also plays a
role: Large molecules will have a lower optimum velocity than small mole-
cules due to slower diffusion in the mobile phase. At this point the method
may be further optimized using standard method development strategies.
17.5 SEPARATIONS ON CHIPS
The miniaturization of chemical analysis systems has grown considerably
in recent years due to the promise of faster analyses, the ability to analyze
786 DEVELOPMENT OF FAST HPLC METHODS
Figure 17-7. Base peak index chromatogram of BSA digest on 150-µm × 22-cm column
packed with 1.5-µm nonporous C18 silica particles. (Reprinted from reference 34, with
permission from American Chemical Society.)
very small sample volumes, less reagent consumption, and exciting possibili-
ties such as multiplexing and interfacing of multiple analytical techniques
.
These miniaturized systems are described by a number of terms such as
“lab-on-a-chip,” “micro-total analysis system (µTAS),” or “microfluidic”
devices. Devices have been developed for numerous and varied applications
incorporating many aspects of sample analysis: sample preparation, fluidic
handling and manipulation, reactions or derivitization, separation, and detec-
tion. The focus here is on those systems that incorporate a separations step
on-chip.
Lab-on-a-chip systems typically consist of microfabricated fluid chan-
nels photolithographically patterned onto a silicon or glass substrate. More
recently, polymeric substrates such as poly(dimethylsiloxane) (PDMS) or
poly(methyl methacrylate) (PMMA) have been used [46, 47]. The channel
dimensions range from tens of micrometers in width and depth to less than
a micrometer. Transport of fluid is accomplished most commonly by elec-
troosmosis, and less so by pressure-induced pumping, which usually requires
interfacing the chip to a benchtop pump. The difficulties in construction
of valves on-chip is another limitation for pressure-based systems. Conse-
quently, capillary electrophoresis is the easiest and most common separation
principle employed on a chip. Separation channels packed with stationary-
phase particles as well as porous monoliths have been prepared to perform
chromatography and electrochromatography. While benchtop separation
instruments typically analyze samples one at a time, multiple parallel
separation channels may be patterned onto a chip to simultaneously analyze
dozens of samples for increased sample throughput and lab productivity.
Detection may be performed on-chip via fluorescence or electrochemical
detection, for example, or the chip may be interfaced to a mass spectrometer,
which is particularly amenable to the low flow rates of chip-based separa-
tions [48].
While a wide range of opportunities exist, such as environmental, clinical,
and trace analysis, the principal application for labs-on-a-chip is in the analy-
sis of biological samples. The miniaturized dimensions allow extremely small
sample volumes to be analyzed, and a microchip format can allow chemical
reaction, mixing, sample manipulation, and multiplexing to be performed.
Single-cell analysis, immunoassays, protein and peptide separations, DNA
analysis and sequencing, and polymerase chain reactions have all been per-
formed on microchip devices [48].
There are still significant technical hurdles that must be overcome for
microchips to develop into an accepted and widespread technique. The unre-
liability of electroosmotic pumping and other microfluidic processes con-
tributes to the lack of robustness of these systems. The miniaturization and
integration of other components, such as pumps, valves, and detection schemes,
onto the chip is another essential step for future development. The reader is
referred to the reviews cited in the references for research performed with
microchips [46–48].
SEPARATIONS ON CHIPS 787
17.6 OPTIMIZING GRADIENT SEPARATIONS FOR SPEED
17.6.1
Advantages of Gradient Chromatography
Gradient chromatography is a very powerful method to control retention and
resolution over a very broad analyte polarity range. Unlike isocratic methods
where each component has a different retention factor and peak width, linear
gradients elute peaks at constant retention factor and peak width. Conse-
quently, sensitivity is uniform throughout the chromatogram. In addition, due
to sample concentration at the head of the column during injection, larger
injection volumes are possible, resulting in a further increase in sensitivity in
gradient chromatography in comparison to isocratic methods. This advantage
is particularly important as column volume is reduced by decreasing column
length and/or diameter. Some commonly perceived disadvantages of gradient
chromatography include poor robustness compared to isocratic methods and
long equilibration times. Table 17-2 outlines these advantages and disadvan-
tages. However, modern HPLC instruments and improved stability of chro-
matographic columns have largely overcome the perceived disadvantages of
gradient methods.
17.6.2 Optimizing Instrumental Factors
Modern instruments have optimized system volumes to take advantage of
short high-efficiency columns and are capable of generating fast reproducible
gradient profiles. Instruments have also been optimized to reduce cycle time.
The total cycle time in a gradient method is the sum of the gradient delay time
(t
D
), the gradient time (t
g
), hold time (t
h
), re-equilibration time (t
e
), and injec-
tor cycle time (t
i
). Figure 17-8 shows a schematic of the steps in a gradient
method. The dwell volume, equilibration time, and the injector cycle time are
the instrument-related factors that affect the overall gradient cycle time.
Gradient delay time, t
D
, is calculated as
(17-20)
where V
D
is the dwell volume of the instrument and F is the flow rate.The dwell
volume represents the total volume between the pump and the head of the
column; it is composed of the volumes of the gradient mixer, the injector, and
all the tubing connectors. The larger the dwell volume, the longer is the time
t
V
F
D
D
=
788 DEVELOPMENT OF FAST HPLC METHODS
TABLE 17-2. Advantages and Perceived Disadvantages of Gradient Elution
Chromatography
Advantages Perceived Disadvantages
Wide polarity retention control Methods not robust
Uniform sensitivity independent of retention Complex method development
Flexible control of R
S
and t
R
Long cycle time
All components eluted Shorter column lifetime
Larger injection volumes Method transfer problems
for solvent delivered by the pump to reach the head of the column.This results
in a longer gradient delay time as well as a longer column equilibration time
.
Most modern HPLC systems have dwell volumes from 0.7 to 1.1mL.
Gradient methods have the reputation of being slow because of the need
for column equilibration between injections. However, by optimizing column
configuration, instrumentation, and method parameters, run times below 10
minutes are readily achievable. Column equilibration requires that a sufficient
volume of mobile phase has been flushed through the system to return the
column to the initial mobile phase conditions at the start of the gradient. Both
the system dwell volume and the column volume must be taken into account.
Equilibration time, t
e
, is described by the following equation:
(17-21)
where V
M
is the column volume (total volume of mobile phase in the column,
approximately equal to 0.7pr
2
L). The equilibration time can constitute a sig-
nificant proportion of the total run time. It can be minimized by reducing dwell
volume, reducing column volume by decreasing column length L, and increas-
ing flow rate. Table 17-3 illustrates how flow rate column length, column diam-
eter, and dwell volume affect equilibration time in comparison to a 4.6- ×
150-mm column run at 1.0mL/min. As shown, increasing the flow rate (either
for the entire run or solely during the equilibration step at the end of the gra-
dient run) directly decreases the equilibration time. Reducing column volume
by reducing the column length threefold,for example,results in a 2.2-fold reduc-
tion in equilibration time. Reducing the column volume by decreasing the
radius, however, does not have the same effect, since the flow rate must also be
proportionally reduced in order to maintain equivalent linear velocity.
Compare the 4.6- × 30-mm and 2.1- × 150-mm columns, which have about the
same column volume, to the 4.6- × 150-mm column. Despite both columns
having about five times smaller volume than the 4.6- × 150-mm dimension, in
the first case the equilibration time is reduced and in the second case it actually
t
VV
F
e
DM
=
+35
OPTIMIZING GRADIENT SEPARATIONS FOR SPEED 789
Figure 17-8. Individual contributions to a typical HPLC gradient cycle time.