Nghiên cứu mối liên quan giữa nồng độ mycophenolic acid và số lượng tế bào lympho t máu ngoại vi ở bệnh nhân ghép thận TT TIENG ANH
Bạn đang xem bản rút gọn của tài liệu. Xem và tải ngay bản đầy đủ của tài liệu tại đây (256.52 KB, 27 trang )
1
STUDY ON THE RELATIONSHIP BETWEEN
MYCOPHENOLIC ACID CONCENTRATION AND
PERIPHERAL BLOOD T LYMPHOCYTE COUNT
IN KIDNEY TRANSPLANT PATIENTS
ABSTRACT
The advent of immunosuppressive drug has brought a new face
to the transplant profession in general and kidney transplantation in
particular. However, the use of immunosuppressive drug after
transplantation is highly complex.
In
addition
to
the
current
common
and
routine
immunosuppressive drug concentration tests such as Cyclosporin and
Tacrolimus, the Mycophenolic acid test is a test deployed in
numerous countries worldwide but has not been performed in
Vietnam, while 100% of Post-transplant patients at Viet Duc hospital
were assigned to use Mycophenolic acid (Cellcept or Myfotic).
Nevertheless, this drug dosage adjustment merely follows the
recommendations of manufacturers and the clinician’s experience but
is not quantified. According to the Vietnam Organ Transplantation
Association, whether the habit of using a single dose of MPA for all
patients is the target concentration, appropriate, safe, or not is still a
controversial issue. Many studies have shown that MPA affects the
biosynthesis inhibition of the T lymphocyte, which is strongly
involved in the rejection process. Thus, this study is conducted with
the following goals:
2
1)
Investigating the Mycophenolic acid concentration and its
area under the curve (AUC 0-12) on the 3rd day, 10th day, and 6
months after the kidney transplantation.
2) Evaluating the relationship between the Mycophenolic acid
concentration and the immune response through the change in
the number of TCD3, TCD4, TCD8 Lymphocyte in kidney
transplant recipients.
New contributions to the thesis:
For the first time in Vietnam, the author conducted a quantitative
determination of mycophenolic acid (MPA) concentration. The
results indicated that the AUC0-12 value of MPA had a significant
difference between patients who used the drug at 3 days, 10 days, and
6 months.
The study has suggested the role and practical significance of
monitoring MPA levels, which helps to personalize the use of antirejection medicines for post-transplant kidney patients.
Thesis structure: Thesis with 113 pages; Abstract: 2 pages;
Overview: 38 pages; Objects and methods: 16 pages; Results: 23
pages; Discussion: 30 pages; Limitations of the study: 1 page;
Conclusion: 2 page; Recommendations: 1 page; 30 tables, 17
pictures, 2 appendices
3
CHAPTER 1. OVERVIEW
1.2. Immunosuppressive drugs used in kidney transplantation
1.2.3. Several important parameters for drug absorption and
concentration monitoring
In fact, when we give the medication to patients, not all of the
drug is taken into effect, but only a portion.
The active fraction is the fraction of the drug entering the
circulation intact (not yet metabolized), which is called the
bioavailability (BA), denoted by F (Fraction of dose), with the unit is
%.
Bioavailability is a parameter representing the ratio of the drug
entering the systemic circulation in the active form relative to the
drug's administered dose (F%), time (Tmax), and concentration
(Cmax) penetrated into the systemic circulation. Therefore, we must
have the number of drugs entering the circulation in order to have
bioavailability.
Nonetheless, it is well-nigh impossible because the penetration of
drugs into the circulation always simultaneously occurs as
distribution and excretion, that is, the amount of drug entering the
circulation fluctuates continuously over time. That's why people
utilize a parameter called AUC to assist.
AUC is the area under the curve (showing the variation of drug
concentration in the blood over time); (Cp-t) represents the amount of
drug which enters the circulation in the active form after time t. The
AUC is calculated as mg.h/L or µg.h/mL.
AUC0 - ∞ = AUC0 - t + AUCt - ∞
4
If we take a long enough sample, about 3 - 5 x t 1/2, then
AUC0-t accounting for about 80% of the total drug intake is
acceptable. The rest can be ignored or extrapolated if desired.
1.3. Mycophenolic Acid
1.3.1. Origin
Mycophenolic acid (also known as mycophenolate) is a kind
of immunosuppressive drug utilized to prevent post-transplant
patients from transplant rejection. MPA, derived from the fungus
Penicillium brevicompactum, was discovered in the late 19th century.
Mycophenolic acid is known by the trade name Cellcept
(Mycophenolate mofetil) in 250 mg and 500 mg; Myfortic is
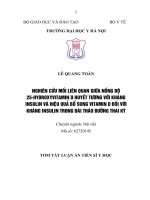
available in 180 mg and 360 mg. MPA inhibits enzymes required for
the development of B cell and T cells. It primarily acts as an IMPDH
– first noted in 1969.
Figure 1.8. Mechanism of lymphocyte proliferation inhibition
*Source: Antonio Perez-Aytes et al (2010) [33].
.
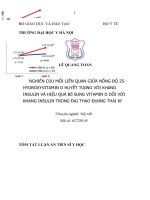
1.3.2. Pharmacokinetics
5
Figure 1.9. Distribution and metabolism of MPA
*Source: Antonio Perez-Aytes et al (2010) [33].
1.3.4. Drug efficacy
In the mid-1990s, three large clinical trials were carried out
in renal transplant recipients with a view to demonstrating the clinical
efficacy of MMF. The outcomes indicated superior efficacy of the
combination with CsA and steroids in lowering the rate of acute
rejection in 6 months after kidney transplantation.
1.4. Studies on MPA
1.4.1. Evaluating the relationship between the change of MPA
concentration and the effects & changes of T lymphocyte
A meta-analysis study published in 2019 analyzed over 27
studies globally and found that 20 studies (total 3382 out of 3,794
kidney recipients) demonstrated a strong association between the
value of MPA AUC0-12 with rejection (Metz et al., 2019).
According to the study of Jamali et al., the patients before and
after four months of kidney transplantation both increased the
proportion of TCD4 lymphocytes cell lines. Nevertheless, the
patients receiving Tac / MPA after transplantation indicated a more
6
significant increase in the proportion of TCD4 lymphocytes
compared with that of patients receiving TAC/Sirolimus.
Mahboob Lessan-Pezeshki et al., (2005) studied the evaluation
of rejection in 16 first-time kidney transplant recipients without
diabetes. The results showed no significant difference among CD3,
CD4, CD8 T-cell count, CD56 NK cell count, and CD20 B cells
counted before and after transplantation.
1.4.3. Several large clinical trials help evaluate the state of
monitoring MPA concentration
Van Gelder et al., studied 901 patients and indicated that
MPA AUC0-12 values range of 30 to 60 mg/L.h is acceptable. The
patient’s dosing is based on the individuals, immunological risk
assessments, and how AUC values fall into this optimal range.
Gaston et al,. studied 720 patients and compared groups
using fixed-dose MMF and calcineurin inhibitor dose adjustment.
The results showed no change in the desired effects between the
groups.
* Currently, in Vietnam, the use of MPA is following the
manufacturer’s instructions and the clinician’s experience. No study
evaluates the use of MPA and drug monitoring in renal transplant
patients.
CHAPTER 2. STUDY SUBJECTS AND METHODS
2.1. Place, Time, and Object of the study
2.1.1. Place of the study
Biochemistry
Department;
Nephrology
–
Dialysis
Department, Transplant Center, Viet Duc Friendship Hospital; Thai
Ha Biomedical Center.
7
2.1.2. Time of the study
- The study was conducted from February 19, 2014 to May 24,
2016.
2.1.3. Object of the study
- The kidney transplant patient was at the transplant center of
Viet Duc Hospital in the postoperative period and then was
monitored and treated at the Nephrology - Dialysis Department for
up to 6 months.
- Control group: healthy people (blood donors and organ
donors).
2.1.3.1. Criteria for selecting study subjects
- Volunteer to participate in the study
- Criteria for selecting patients:
+ All patients of all ages and both sexes received kidney
transplants and were periodically monitored until the 6th month after
transplantation at the Transplant Center and the Nephrology –
Dialysis Department, Viet Duc Friendship Hospital.
+ Use an immunosuppressive regimen with MPA twice a day
(Cellcept or Myfortic both use 2 tablets/time).
- Criteria for selecting the control group:
+ Healthy people of all ages and both sexes are eligible to
donate blood and organs.
2.1.3.2. Exclusion criteria
- The patient was converted to a regimen without MPA during
follow-up (will be excluded at the time of converting to the
respective treatment protocol).
- The patient refused to participate in the study.
- The blood sample taken did not give results when testing for T
8
lymphocytes.
- Blood samples were taken in the wrong way: blood taken at the
wrong time and blood clots.
2.1.3.3. Specimens
- Blood of study subjects was taken at time 0 (right before taking
the drug) and 1, 2, 3, 6 hours after taking the medicines on the 3rd,
10th days, and 6th month after transplantation
2.2. Study Methods
2.2.1. Study design
Descriptive and prospective study. Convenient sampling according
to purpose
2.2.2. Sampling method and sample size
2.2.2.2. Sample size
The study had 35 patients who fully met the research criteria
for 3 days and 10 days after transplantation; 33 patients satisfied the
research criteria for 6 months post-transplant. The control group
consisted of 30 people.
2.2.3. Methods and techniques
2.2.3.1. The method of data collection
- Making the research medical record according to the
designed medical record template.
2.2.3.3. Implementation techniques
Determining biochemical parameters: Creatinine, albumin, GOT,
GPT on AU680 machine at Biochemistry Department, Viet Duc
Friendship Hospital
Determining the number of red blood cells and white blood cells
on Unicel DxH600 machine at the Hematology Department, Viet
Duc Friendship Hospital
9
g.
Determining
the
number
of
T-CD3,
T-CD4,
T-CD8
lymphocytes
By flow cytometry (Lympho T-CD3, -CD4, -CD8 enumeration by
flow cytometry) at Thai Ha medical center
m. Quantifying the MPA in the blood:
By CEDIA method on a Thermo Scientific Indiko - USA at the
Biochemistry Department, Viet Duc Friendship Hospital
* Principle:
Based on Galactosidase Enzymes engineered into two inactive
fragments (ED and EA), these fragments bind together to form an
enzyme causing a color change in the medium that can be measured.
In the presence of the analyte in the sample, it binds to the antibody,
leaving the inactive enzyme fragment free to form an active enzyme.
In the absence of the analyte in the sample, the antibody binds to the
analyte conjugated on the inactive fragment inhibiting the
reassociation of inactive fragments; and no active enzyme is formed.
The amount of active enzyme formed resulting in the absorbance
change is proportional to the amount of analyte present in the sample.
2.2.4.2. Formula
We applied the trapezoidal rule of Hoang Thi Kim Huyen to
calculate the AUC; Nonetheless, the drug concentration was
quantified at time t0, t1, t2, t3, t6, while at t12, the drug concentration
was equal to C0. Besides, we based on the chart of drug concentration
to calculate S1 - S12.
AUC0-12 = S1 + S2 + S3 + S4 + S5 + S6 + S7 +S8 +S9 +S10 +S11 +S12
The threshold value of AUC reached: 30 – 60 mg.h/L
10
2.4. Data processing: Using Stata program
2.5. Error handling:
There was only 1 research group conducted at the research
facility.
2.6. Study ethics
- The study was approved by the Viet Duc Friendship Hospital,
the Immunology Department and the Post-Graduate Office of the
Military Medical Academy.
- The study had the voluntary participation of the patients. All
participants understand the purpose of the study and agree to
participate in the study. And, the patients have the right to withdraw
from the study at any point without any coercion. Explanations are
also not required.
CHAPTER 3. RESULTS
3.1. General characteristics of the research subjects
Table 3.1. Distribution of subjects according to age
and sex
Female
Total
n
%
N
%
19 – 29
4
30,8
10
28,6
30 – 39
6
46,1
11
31,4
40 – 49
1
7,7
5
14,3
50 – 61
2
15,4
9
25,7
Total
13 100,0 35 100,0
Min – Max
19 – 53
19 – 61
p-values
0,193c
- The most common age group is from 30-39 years old, accounting
Age groups
for 31.4%.
Male
N
%
6
27,3
5
22,7
4
18,2
7
31,8
22
100,0
19 – 61
11
- All patients are of working age with an average age of 38.17 ±
12.03.
- Men account for a higher proportion than women 1.7: 1 (62.9%
compared to 37.1%)
Table 3.5. Several biochemical and hematological parameters in
patients studied before and after transplantation
Time Points
3 days
10 days
6 days
postpostposttransplanta
transplantb transplantc
Parameters
n = 35
n = 35
n = 33
Creatinin
118,20 ±
123,69 ±
109,27 ±
35,70
51,24
23,65
P
pa-b > 0,05
pb-c > 0,05
pa-c > 0,05
Albumin
36,77 ± 1,93
38,26 ±
41,33 ±
pa-b > 0,05
2,17
3,64
pb-c > 0,05
pa-c > 0,05
GOT
23,77 ± 5,77
32,19
26,09 ±
pa-b > 0,05
±7,62
10,64
pb-c > 0,05
pa-c > 0,05
GPT
41,37± 9,33
29,47 ±
32,73±
pa-b > 0,05
10,23
5,79
pb-c > 0,05
pa-c > 0,05
Red blood
3,70 ± 0,59 3,67 ±0,62
4,12 ±
pa-b > 0,05
cells
0,48
pb-c > 0,05
pa-c > 0,05
White blood 10,35 ± 3,99
9,58 ±
9,62 ±
pa-b > 0,05
cells
3,21
2,41
pb-c > 0,05
pa-c > 0,05
- The biochemical and hematological parameters at each time
point post-transplant showed no difference with p > 0.05.
12
3.2. Use of immunosuppressive drugs
Table 3.6. Distribution of patients according to
therapeutic drug class
Therapeutic drug class
Quantity (n)
Rate (%)
Pred+ Prograf + Cellcept
20
57,2
Pred + Prograf + Myfortic
11
31,4
Pred + Neoral + Cellcept
4
11,4
35
100,0
Total
The number of patients in the study group treated with Pred +
Prograf + Cellcept accounted for the highest rate (57.2%); the lowest
was those treated with Pred + Neoral + Cellcept (11.4%).
3.2.1. Group employing Cellcept + Neoral (n=4)
Table 3.7. Adjusting the dose of CellCept + Neoral
Time
.
Drugs
Cellcept
(n=4)
Neoral
(n=4)
No
adjustmen
t
(n, %)
2
50 %
0
0%
The first
3 days
(n, %)
From 3-10
days
(n, %)
0
0%
0
0%
1
25%
4
100%
From the
11th day
onwards
(n, %)
1
25%
0
0%
When adjusting the dose of Cellcept, there was 1 patient (25%) at
the first 10 days and 1 patient (25%) from 11th day onwards.
Within the first 10 days, all four patients (100%) were adjusted the
dose of Neoral.
3.2.2. Group employing Cellcept + Prograf (n=20)
Table 3.8. Adjusting the dose of Cellcept + Prograf.
Time
No
The first 3
From 3-10
From the
13
Drugs
Cellcept
(n=20)
Prograf
(n=20)
adjustment
(n, %)
days
(n, %)
days
(n, %)
0
0%
0
0%
1
5%
9
45%
3
15%
8
40%
11th
outwards
(n, %)
16
80%
3
15%
On the first 3 days, 1 patient (5%) was adjusted the dose of
Cellcept. From 3 to 10 days, there were 3 patients (15%); and from
the 11th day onwards, there were 16 patients (80%).
When adjusting the dose of Prograf, there were 9 patients (45%)
on the first 3 days, 8 patients (45%) from 3 to 10 days, and 3 patients
(15%) from the 11th day onwards.
3.2.3 Group employing Myfortic + Prograf (n = 11)
Table 3.9. Adjusting the dose of Myfortic + Prograf
Time
.
No adjustment
The first 3
From 3-10
From the
(n, %)
days
days
11th day
(n, %)
(n, %)
outwards
Drugs
Myfortic
(n, %)
0
0
2
9
(n=11)
0%
0%
18,2%
81,8%
Prograf
0
5
3
3
(n=11)
0%
45,4%
27,3%
27,3%
No patient (0%) was adjusted the dose of Cellcept on the first 3
days. From 3 to 10 days, there were 2 patients (18.2%); and from the
11th outwards, there were 9 patients (81.8%).
14
When adjusting the dose of Prograf, there were 5 patients (45.4%)
on the first 3 days, 3 patients (27.2%) from 3 to 10 days, and 3
patients (27.3%) from the 11th day onwards.
3.3. Evaluation of the variability of MPA concentration
Table 3.10. Kinetics of MPA concentration according
to the time of transplant
Concent
3 days post-transplant
10 days post-
6 months post-
transplant
transplant
rate
Mean
Median Range
± SD
C0
(mg/L)
C1
(mg/L)
C2
(mg/L)
C3
(mg/L)
C6
2,32 ±
6,26 ±
7,3
3,87 ±
AUC
50,10
(mg.h/L)
± 3,45
Creatini
118,20
±
35,70
0,1 –
1,57 ±
6,9
1,38
1,0 –
6,31 ±
16,0
5,15
0,80 – 7,83 ±
27,1
5,5
3,94
3,06
(µmol/L)
6,1
6,57
(mg/L)
n
1,9
4,72
8,90 ±
Range
± SD
1,47
6,69 ±
Mean Median
16,1
2,9
45
1,4
3,8
7,2
5,7
4,27
0,20 – 2,51 ±
16,2
1,50
11,03
41,87
2,4
42,1
± 94,45 ±14,50
116
59 –
123,69
240
±
51,24
Range
SD
4,25
0,80 - 6,51 ±
Mean ± Median
112
0,2 –
2,29 ±
8,8
1,40
0,8 –
14,37 ±
16,9
12,32
1,0 –
9,00 ±
18,2
6,17
0,9 –
7,60 ±
18,7
5,80
0,6 –
3,43 ±
7,6
1,82
10,73 – 60,26 ±
82,3
25,87
69 –
109,27
298
± 23,65
2
0,70 –
6,30
15,2
1,10 –
47,60
7,3
1,90 –
31,50
5,6
1,90 –
26,80
2,9
0,90 –
8,60
53,05
18,50 –
129,05
110
68 –
193
15
At all 3 points: 3 days, 10 days, and 6 months after transplantation,
MPA rose sharply in the first hour after oral administration.
MPA peaked at the second hour on 3 days and 10 days posttransplantation and peaked at the first hour after 6 months.
Table 3.13. Cmax achieved at 3 days, 10 days and 6
months according to median.
Time
Cmax
Cmax
Cmax
at 3 days
at 10 days
at 6 months
n
%
n
%
N
%
C1
12
34,3
11
31,4
19
57,6
C2
13
37,1
14
42,8
7
21,2
C3
8
22,9
8
22,9
8
24,2
C6
2
5,7
2
5,7
0
0,0
Total
35
100,0
35
100,0
33
100,0
At 3 days and 10 days, Cmax concentrated predominantly on
C2 (37.1% - 42,8%); At 6 months, Cmax focused mainly on C1 with
the rate of 57.6%.
Table 3.14. C0 level at time points of post-transplant
Time
3 daysa
10 daysb
6 monthsc
P
0,95 ± 0,4
0,1 – 1,4
(n= 10)
0,96 ± 0,35
0,2 – 1,4
(n=20)
1,07 ± 0,23
0,7 – 1,4
(n=11)
pa-b= 0,944
pa-c= 0,398
pb-c= 0,346
1,99 ± 0,33
1,5 – 2,5
(n=15)
1,94 ± 0,32
1,5 – 2,4
(n=14)
1,87 ± 0,28
1,5 – 2,3
(n=10)
pa-b= 0,679
pa-c= 0,338
pb-c= 0,571
4,19 ± 1,33
2,6 – 6,9
(n=10)
8,8
3,75 ± 1,28
2,6 – 6,3
(n=12)
pa-c= 0,402
C0
<1,5 mg/L
1,5-2,5mg/L
>2,5 mg/L
(n=1)
16
At all-time points: the difference in drug concentration C0 was not
statistically significant.
Table 3.15. AUC0
– 12
level at time points of post-
transplant
a
3X days
± SD
b
10
X days
± SD
c
6 Xmonths
± SD
(min - max)
(min - max)
(min - max)
20,03 ± 3,45
23,88 ± 5,64
20,68 ± 3,08
pa-b= 0,305
11,03 – 29,05
10,73 – 28,9
18,5 – 22,85
pa-c= 0,917
(n= 5)
(n=9)
(n=2)
pb-c= 0,469
42,79 ± 6,02
45,38 ± 7,43
45,11 ± 8,25
Pa-b= 0,238
33,05 – 54,4
32,45 – 57,6
30,7 – 59,05
Pa-c= 0,347
(n=18)
(n=23)
(n=17)
Pb-c= 0,92
73,61 ± 10,62
69,02 ± 11,66
84,33 ± 97,98
Pa-b= 0.521
60,8 – 94,45
60,45 – 82,3
61,05 – 129,05
Pa-c= 0,109
(n=12)
(n=3)
(n=14)
Pb-c= 0,227
Time
AUC0 – 12
< 30 mg.h/L
30-60mg.h/L
>60 mg.h/L
P
The levels of AUC0 – 12 at time points had no difference.
3.4. Variability in TCD3, TCD4, TCD8 lymphocytes counts and
the ratio of TCD4/TCD3 in kidney transplant patients
Table
3.22.
Variability
in
the
number
of
T
lymphocyte lines before and after transplantation.
Lymphocytes
Pre-transplant
Post-transplant
pvalues
TCD3 (cell/µL)
1690,31 ± 503,45
2069,14 ± 1374,4
0,222g
TCD4 (cell/µL)
549,51 ± 211,72
729,46 ± 515,69
0,036g
33,36 ± 9,83
35,49 ± 13,77
0,413g
Ratio TCD4/TCD3
(%)
17
TCD8 (cell/µL)
1134,37 ± 431,07
0,368g
1373,03 ±
1004,71
g. Willcoxon signrank test
The number of T lymphocytes cells post-transplant increased
compared to pre-transplant, but only the TCD4 form had a
statistically significant difference (p<0.05).
Table
3.23.
Variability
in
the
number
of
T
lymphocyte lines in the transplant group and the
control group.
Lymphocytes
Post-transplant
Control group
p-
group (n=35)
(n=30)
values
TCD3 (cell/µL)
2069,14 ± 1374,4
2280,73 ± 522,48
0,4298g
TCD4 (cell/µL)
729,46 ± 515,69
766,37 ± 341,72
0,7395g
35,49 ± 13,77
32,09 ± 6,96
0,2251g
Ratio
TCD4/TCD3 (%)
TCD8 (cell/µL)
1373,03± 1004,71
0,4385g
1523.4 ± 349,23
g. Willcoxon signrank test
The number of T-lymphocytes in patients after renal
transplantation was not statistically significant with the control group
(p > 0.05).
Table 3.24. Relationship between AUC0
– 12
and the
number of TCD4 cells at 10 days
TCD4
AUC0 – 12
Increase
Total
Decrease
(mg.h/L)
At 10 days
n
%
n
%
n
%
18
<30mg.h/L
5
20,8
4
36,4
9
25,71
30-60mg.h/L
17
70,8
6
54,5
23
65,71
30 – 40
3
12,5
40 – 50
9
37,5
50 – 60
5
20,8
>60 mg.h/L
2
8,4
1
9,1
3
8,57
Total
24
100,0
11
100,0
35
100
χ2; p-values
χ2=0,3854;
p= 0,825
23 patients reached AUC0 – 12, of which 17 patients increased TCD4.
CHAPTER 4: DISCUSSION
4.1. General characteristics of research subjects
4.1.1. Age and sex characteristics
In this study, renal transplant patients were randomly selected;
nevertheless, a higher proportion of male patients than female
patients could be seen (with a rate of 62.9% and 37.1%). Various
studies worldwide with the same random sampling method on renal
transplant recipients have also shown that the proportion of men is
higher than that of women, usually over 50%.
4.1.3. Weigh and several biochemical indicators
The average weight of our study group is moderate. According
to many studies globally, optimizing the dose of MPA by weight
could help achieve the target SKD for the drug. With this study, the
selection of average weight is appropriate with a view to evaluating
the concentration of a drug in a stable period post-transplantation,
Our study indicated that the patient's albumin, GOT, GPT, red
blood cells, and white blood cells counts had no significant change
during the treatment; and the difference is not statistically significant;
19
According to Hariharan, creatinine/HT levels in the first year
post-transplant had a predictive value for long-term results after
transplantation. Outcomes of the study demonstrated that the serum
creatinine concentration at these time points showed no difference.
4.2. Use of immunosuppressive drugs
In our study, all patients received a regimen including a
calcineurin inhibitor and a mycophenolic acid drug. The percentage of
study subjects receiving Tacrolimus (Prograf) is considerably higher,
which is also consistent with the current trend of utilizing anti-rejection
medicines in kidney transplant pathology.
Patients in our study were re-examined with a relatively high
frequency (once a month), while patients' re-examination in
developed countries could be once every 3 to 6 months. Thus, when
the variation in drug concentrations occurs, the dose adjustment for
these patients may be delayed, affecting the long-term kidney
transplant outcome. Patients can still enjoy certain advantages in the
long-term kidney transplant outcomes despite the inconvenience of
more frequent follow-up visits. In our study group of patients,
Tacrolimus and Cyclosporin were quantified regularly; the treating
physician based on that to adjust the dose to maintain trough
concentrations within the target range. Accordingly, the above 2
drugs were adjusted to change the dose many times to reach the
treatment goals. In contrast, MPA was not regularly quantified and
adjusted according to experience; in consequence, the treatment
process of patients was not adjusted continuously.
4.3. Evaluation of variability in drug concentration
Individualized immunosuppressive therapy necessitates better
strategies to avoid drug-related toxicity while maintaining efficacy.
20
Few studies have prospectively evaluated the clinical effectiveness of
MPA's therapeutic drug monitoring (TDM) in organ transplantation,
and they have produced conflicting results.
MPA is a potent, selective, and reversible inhibitor of inosine
monophosphate dehydrogenase (IMPDH), resulting in the eventual
arrest of T- and B-lymphocyte proliferation. Mycophenolate mofetil
and
EC-mycophenolate
sodium
are
essentially
completely
hydrolyzed to MPA by esterases in the gut wall, blood, liver, and
tissue. MPA binds 97-99% to serum albumin in patients with normal
kidney and liver function. Following mycophenolate mofetil
administration, MPA maximum concentration usually occurs within
1-2 hours. A secondary peak in the concentration-time profile of MPA
often appears 6-12 hours post-administration by virtue of the
enterohepatic recirculation, contributing approximately 40% to the
area under the plasma concentration-time curve (AUC). The mean
elimination half-life of MPA ranges from 9 to 17 hours. Large
between- and within-subject pharmacokinetic variability was
displayed by MPA.
Because MPA has a narrow therapeutic window and large
inter-individual variability, therapeutic drug monitoring (TDM) of the
area under the time-concentration curve for 12h (hours) of exposure
(AUC 0-12) of MPA (MPA-AUC 0-12) is crucial to improve clinical
outcomes.
We studied the variability in MPA concentration at all 3-time
points: 3 days, 10 days and 6 months post-transplant; all showed a
sharp increase of MPA in the first hour after drug administration.
After 3 days and 10 days of transplantation, MPA peaked at the
second hour and peaked at the first hour after 6 months. The patient’s
21
peak concentration ranges from 3.0 to 47.6 mg/L; 7/35 patients did
not change the time to reach the peak concentration on different days
of sampling. At 3 days and 10 days, Cmax concentrated
predominantly on C2 (37.1% - 42.8%); at 6 months, Cmax focused
mainly on C1 with the rate of 57.6%.
In the study, we calculated the area under the curve over 12
hours using blood samples collected at 0, 1, 2, 3, and 6 hours after
drug administration. Although monitoring the change of drug
concentration over time within 12 hours is the best measure, there are
still many obstacles in complying with the sampling time, the
prolonged time interval betweensample collection causing many
inconveniences to patients with a stable clinical condition, and
especially insufficient economic conditions in the majority of
patients. Mathew et al. in India studied patients using a combination
of mycophenolate mofetil (MMF) and tacrolimus, producing fairly
accurate results of the area under the curve AUC 0-12 by taking samples
for the first 3 hours after drug administration, including Cmax.
Fleming et al. utilized MMF in combination with Cyclosporin
on the group of patients and showed that the area under the curve in
the first 6 hours after drug administration accurately reflected the
AUC within 12 hours. Therefore, in this study, we chose the time
when taking quantitative samples of MPA blood concentration in the
first 6 hours after oral administration, still ensuring the accurate
reflection of the area under the curve AUC0-12.
The choice of time to evaluate AUC also depends greatly on
the half-life of the drug and the time to reach the maximum
concentration (tmax). Various studies have shown that the time t max of
renal transplant recipients using drugs in the first days post-transplant
22
often fluctuates considerably in the first 4 to 6 hours on average and
stabilizes gradually. Most of the time is in the first 3 hours after drug
administration from the first month onwards. Thus, our study selected
the time points of 0, 1, 2, 3, and 6 hours, still ensuring the
appropriateness of evaluating AUC0-12 in the periods up to 6 months
after transplantation.
The relationship between AUC 0-12 and rejection rates is clear.
Moreover, if fixed-dose MPA is used for all kidney transplants, the
benefits and the undesirable effects will not be the same due to
differences in numerous factors in each body, such as weight or drug
metabolism.
Monitoring of AUC0-12 will assist in dose individualization.
Even in our study, the first 3 days are the period of taking medicines
with a fixed concentration. The results show: Firstly, the AUC 0-12
value has a difference in the groups with different C 0 concentrations.
Secondly, in the group not reaching the target concentration at C 0, the
AUC value reaching the target range is up to 22.2%, while in the
group reaching the target concentration at C 0, the AUC value not
reaching the target range is up to 33.3%. In addition, in the group that
AUC value reaches the target range, there is a rate of 16.7%
experiencing undesirable drug effects. Accordingly, the oral dose for
each individual to achieve the goals is different. Other studies also
showed similar results.
4.3.1. The correlation between C0 concentration and AUC0-12 at 3 days
post-transplant
The ratio of patients whose AUC concentration not reaching the
target range is 10/35 = 28.57%, which is lower than various studies
worldwide. According to Arns W, Breuer S et al. (2005), the AUC of
23
MPA not reaching the target range caused no inconvenience to the
patient. A study conducted by T. van Gelder et al. (2010) indicated
that MPA levels were strongly associated with acute rejection rates in
the first week post-transplant.
4.3.2. The correlation between C0 concentration and AUC0-12 at 10
days post-transplant
The first 10 days are in the period of rejection due to cytotoxicity
(the role of T lymphocytes). This period lasts from 7 days to 3
months. And we chose the 10-day period. In our study, although no
difference in AUC0-12 was observed in the three groups with different
drug concentrations at C0, the ratio of patients reaching the target
AUC0-12 and the ratio of patients with MPA levels in the threshold that
sharply decreased undesirable effects compared to the first 3 days
post-transplant showed a marked increase.
4.3.3. The correlation between C 0 concentration and AUC0-12 at 6
months post-transplant
At 6 months after transplantation, there is a difference in the mean
AUC0-12 in the groups with different C0 concentrations (p<0.05). The
number of AUC0-12 reaching the target value from 30 to 60 mg.h/L
was 51.5%. Nonetheless, the number of patients with a concentration
that could cause undesirable drug effects was 36% higher than that at
10 days. The ratio of patients with AUC0-12 at the 6th month below
30 mg.h/L is significantly lower than at other time points (6.1%),
which is entirely relevant because all studies have shown a strong
association between AUC0-12 values and rejection demonstrated by
biopsy. Gaston et al. studied 590 cases of using tacrolimus in
combination with mycophenolic acid and found that the risk of acute
rejection when MPA was low was 0.322 (p<0.0001) at 6 months.
24
Daher Abdi et al. studied 490 adults with kidney transplants and
showed that the optimal threshold at 6 months was MPA AUC 0-12 > 41
mg.h/L and was closely related to rejection (p = 0). .0081); At the
same time, the bioavailability of MPA is a more prognostic factor for
post-transplant outcomes (such as rejection, death, etc.) than the
bioavailability of calcineurin inhibitors.
4.4. Variability in TCD3, TCD4, TCD8 lymphocytes counts and
the ratio of TCD4/TCD3 in kidney transplant patients
Three other mechanisms may also make a contribution to the
efficacy of MPA in preventing allograft rejection and other
applications. Firstly, MPA can induce apoptosis of activated Tlymphocytes, which may eliminate clones of cells responding to
antigenic stimulation. Secondly, MPA suppresses glycosylation and
the expression of several adhesion molecules by depleting guanosine
nucleotides, hence decreasing the recruitment of lymphocytes and
monocytes into sites of inflammation and graft rejection. Thirdly, by
depleting
guanosine
nucleotides,
MPA
also
depletes
tetrahydrobiopterin, a co-factor for the inducible form of nitric oxide
synthase (iNOS). MPA, thus, suppresses the production by iNOS of
NO, and consequent tissue damage mediated by peroxynitrite.
At 10 days post-transplant, the number of TCD4 cells was higher
than pre-transplant (p = 0.036). The number of TCD3, TCD8, and the
ratio of TCD4/TCD3 did not change significantly (p > 0.05). );
Therefore, right after receiving a kidney transplant and taking
medicines, hematopoietic function markedly improve.
A study conducted by Kamburova et al. also showed an increase in
CD4 cells in patients at all time points post-transplantation 3,6,12 and
24 months compared with pre-transplantation.
25
A study concuted by Al-Akash et al. also showed that the group of
patients using MPA had decreased CD4 and CD8 T lymphocytes in
the peripheral blood, which could be interpreted as a cumulative
effect. Accordingly, T lymphocytes cell counts should be examined at
various time points and throughout the post-transplant period.
Mahboob Lessan-Pezeshki et al. (2005) studied 16 first-time kidney
transplant patients without diabets by monitoring peripheral blood Tlymphocytes. In two groups based on rejection in 3 weeks posttransplant: group I (n = 9) did not show rejection, and group II (n = 7)
showed rejection. The results indicated that the number of CD3,
CD4, CD8 T cells pre- and post-transplantation had no significant
difference, CD3 (62% versus 69.7%) and CD4 (35% versus 41.3%)
counts increased in group II during the pre-transplant rejection.
The outcomes of our study indicated that the 23 patients achieved
the target range of AUC 0-12 , of which 17 patients increased TCD4,
3/17 patients achieved AUC at 30-40 mg.h/L, 9/17 patients had AUC
of 40 - 50 mg.h/L, and 5 patients had AUC of 50 - 60 mg.h/L; 18
patients increased TCD8, and 13 patients increased both TCD4 and
TCD8; in which 7 patients did not achieve the target range of AUC 0-12
(29.16%). There were 22 cases without dose adjustment increasing
TCD4 compared to pre-transplant, of which 4 cases increased over
1300 cells/mL. There were 2 cases of dose adjustment in 7 cases
increasing TCD4 compared to pre-transplant.
Thus, we see that the treatment using MPA drugs on patients still
increases TCD4, is not as effective as expected, and may give rise to
rejection. The current recommended use of drugs is not suitable for
patients in Vietnam and necessitates the re-evaluation in a longer
time, which, nonetheless, may also be due to the short follow-up