Tài liệu FOURIER ANALYSIS docx
Bạn đang xem bản rút gọn của tài liệu. Xem và tải ngay bản đầy đủ của tài liệu tại đây (981.34 KB, 24 trang )
© 2001 by CRC Press LLC
8
Automated Systems
Techniques for On-Line
Quality and Production
Control in the
Manufacture of Textiles
8.1 Introduction
8.2 Automation of Basic Textile Processes
Automation of Spinning • Automated Systems in
Weaving • Automated Systems in Finishing
8.3 Distributed Systems for On-Line Quality and
Production Control in Textiles
Basic Concepts for On-line Control in Textiles • Approaches
to Building Cost Effective Real-Time Control Systems in
Textiles • Software Realization • Integrating Control and
Manufacturing Systems in Textiles
8.4 Summary
8.1 Introduction
Textile manufacturing involves a variety of sequential and parallel processes of continuous and discrete
nature. Each requires precise, on-line control of preset technological parameters such as speed, pressure,
temperature, humidity, and irregularity. On the manufacturing sites, these processes take place within
separate machines or production lines where a relatively large number of operating personnel and workers
are engaged. The intensities of the material flows: raw materials (fibers, yarn, and sliver), dyes, chemicals,
ready production, etc., are substantially high, and this leads to heavy transport operations, inevitably
involving costly hand labor.
The raw materials processed in textile possess poor physical and mechanical properties concerning tensile
strength, homogeneity, and others. This causes frequent stops in the technological process due to thread
breaks, engorgement, winding of the material around rollers, etc. As a result, labor-consuming and monot-
onous hand services are required for the proper operation of each textile machine. Statistics show that due
to higher productivity and new technologies, the total number of machines at an average textile factory has
decreased more than twice in recent decades [Baumgarter et al., 1989]. Nevertheless, the problem for
replacing hand labor in textile manufacturing still remains a challenge in all aspects of process automation.
Stantcho N. Djiev
Technical University of Sofia
Luben I. Pavlov
Technical University of Sofia
© 2001 by CRC Press LLC
Textile materials usually undergo many technological passages, leading to greater energy consumption
and large amounts of expensive wastes, some of which may be recycled within the same process.
Taking into account the above mentioned characteristics of the textile production as a whole, the
following approaches for application of automated systems techniques in the field can be outlined.
• Creation of new processing technologies and development of new generations of highly automated
textile machines.
• Application of highly efficient controlling and regulating microprocessor-based devices, integrated
in to distributed control systems. This would ensure reliability of information and allow the
implementation of standard industrial fault-tolerant information services.
• Usage of industrial robots and manipulators for automation of the basic and supplementary
operations, resulting in increased productivity and lower production costs.
• Automation of transport operations for reducing the amount of hand work and process stops
which often occur when sequential processes are badly synchronized. The optimization of machine
speeds and loading is an important source for higher efficiency throughout textile manufacturing.
• Development and implementation of new concepts and informational and control strategies, so
that the highly automated and computerized CAD, CAM, CAP, and CAQ sub-systems can be
totally integrated, forming a Computer Integrated Manufacturing (CIM) or a Computer Aided
Industry (CAI) system. The resulting systems are not just a mixture of sub-structures, but process
internal informational homogeneity, common software tools, databases, and other features.
Usually, these systems are developed using systematic approach techniques. The CIM and CAI
super systems and the level of their internal integration should be considered on the basis of the
specific, and often contradictory, requirements of textile manufacturing.
The development of automated systems in textiles, as a whole, can be summarized in the following
four stages:
The first stage is characterized by partial automation of separate machines or operations using
conventional controlling devices. Such examples are the pick finders and cop changers in the weaving
machines, local controllers of temperature, speed, pressure, etc. At this stage, a large percentage of
handwork is still used.
The second stage involves usage of automated systems for direct (most often digital) control of the
technological process. This stage requires a greater reliability level of the equipment due to the centralized
structure and remote mode of operation and data processing of these systems. Hand-labor is reduced by
means of manipulators, robots, and automated machines. The automated control subsystems collect
information from various objects and pass it to a central control unit while retaining control over the
following.
• Continuous control of local process parameters.
• Timing registration and basic statistics for machines stops, idle periods, malfunctioning, etc.
• The local systems produce alarm signals, or even stop machines for the operators if their abnormal
operation affects the quality beyond preset limits or when dangerous situations occur.
• Some indirect qualitative and quantitative indices are calculated or derived: materials and energy
consumption, quality parameters of the ready production, actual or expected (extrapolated)
amounts of wastes, etc.
As a result, the central control unit produces and sends information in the form of data sheets, protocols,
and recommendations to the operating personnel. This information is also stored and retrieved later for
off-line decision support when optimizing and planning the material flows, machines loading, etc.
The third stage is characterized by implementation of direct numerical control of many or all tech-
nological variables using dedicated and totally distributed control systems. The term distributed here
does not represent only the spatial dispersion of the control equipment, but rather, the fully autonomous
© 2001 by CRC Press LLC
mode of action of each controlling/measuring node while it is still connected with other devices through
the industrial network.
Local control units for data acquisition, processing, and retrieval, combined with intelligent field
sensors, substantially increase the reliability of the automated system as a whole. The latter is usually
built on a hierarchical principle, incorporating within itself several independently working layers. Nearly
fully automated production lines are implemented at this stage using high production volume machines
running at variable speeds, so that a total synchronization is achieved throughout. Computerized subsystems
like CAD, CAQ, CAP, and others are implemented at this stage to different extents. There exists here
some integration among them, using local area networks (LANs) and wide area networks (WANs). As a
whole, the production facilities, although highly automated, do not yet exhibit substantial integration.
The fourth stage involves the integration of the production in computer-integrated manufacturing
(CIM) or computer-aided industry (CAI) systems. Due to the specific features of textiles and the dynamic
changes in the stock and labor markets, this stage still remains a challenge for future development and
will be discussed later in this chapter.
8.2 Automation of Basic Textile Processes
Automation of Spinning
Bale-Opening and Feeding Lines
In the preparatory departments of the textile mills take place actions for bale-opening and feeding of the card
machines. The transportation and unpacking of the incoming bales, e.g., cotton bales and ready laps involved
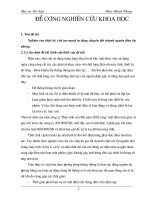
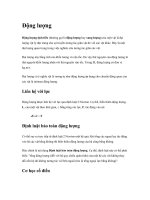
much hand labor in the recent past. As an alternative, an automated cotton bale-opening machine is shown
in Figure 8.1. It comprises two main assemblies: a motionless channel (see 10 in figure) for the cotton
transportation and a moving unit (4) for taking off the material. This unit is mounted on the frame, (13)
FIGURE 8.1
Automated bale-opening machine.
© 2001 by CRC Press LLC
which slides down the railway alongside the transportation channel. The cotton bales are placed on both sides
of the channel. Approximately 200 bales with different sorts of cotton of variable height can be processed
simultaneously. The take-off unit (4) is programmed in accordance with the type of the selected mixture. It
takes off parts of the material by means of the discs (1), actuated by the AC motor (2). The depth of penetration
into the bale is controlled by the rods (3). The pressing force of the unit (4) is controlled according to the
readings of a pneumatic sensor. The signal is forwarded to a microprocessor controller (usually a general-
purpose PLC) which commands a pneumatic cylinder (5) to change the elevation of the unit (4). The material
then goes into pneumo-channels (8,9) and the transportation channel (10). The subsequent machines are fed
through the channel (12) by means of a transporting ventilator. A magnetic catcher placed inside the channel
(12)
prevents the penetration of metallic bodies into the feeding system. The take-off unit (4) moves along the
railway at a speed of 0.1–2.0 m/s, driven by the AC motor (7). It can make turns of 180 degrees at the end of
the railway and then process the bales on the opposite side. The frame (13) and the bearing (14) accomplish
this, while the position is fixed by the lever (15). The productivity of these machines approximates 2000 kg/h,
and they usually feed up to two production lines simultaneously, each of them processing a different kind of
textile material mixture.
Automation of Cards
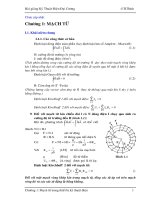
Figure 8.2 shows a block diagram of an automated system for control of the linear density of the outgoing
sliver from a textile card machine. The linear density [g/km] is measured in the packing funnel (2). The
sensor signal is processed in the controller module (3/14), which governs the variable-speed drive (4) by
changing the speed of the feeding roller (5); thus, long waves of irregularity (over 30 meters in length)
are controlled. The regulator also operates the variable-speed system (6), which drives the output drafting
coupled rollers (7) of the single-zone drafter (8). Long-term variances of the sliver linear density are
suppressed by the first control loop. The winding mechanism (9) rotates at constant speed and provides
preset productivity of the card.
Automation of Drawing Frames
The growing intensification of contemporary textile production resulted in the development of high-speed
drawing frames for processing the textile slivers after the cards. The output speeds of the drawing frames
often reach 8–15 m/s. This, together with the high demands for product quality, brings to life new techniques
for development, and implementation of automatic control systems for on-line quality and production
FIGURE 8.2
Card with automatic control of the output sliver linear density (closed-loop control system).
© 2001 by CRC Press LLC
control. The processes here possess relatively high dynamics, and the overall response times, in general, are
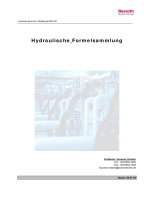
within several milliseconds. One of the principles used in that field is illustrated in Figure 8.3. An electrical
signal is formed at the output of the transducer (1) under the action of the sensing rollers. This signal is
proportional, to some extent, to the linear density of the cotton slivers passing through. The transducer is
usually an inductive type with moving short-circuit winding. A high-frequency generator powers it to
ensure greater sensibility. The sensor output signal is detected, to the balance emitter repeater, (2) and
conformed to the input resistance of the memory device (3). The balance circuit (2) secures minimal
influence of the ambient temperature and power voltage on the level of the sensor signal. The memory
device holds the signal for the time required by the sliver to reach the drafting zone (9). Both the sensor
signal and the speed feedback signal drive the phase pulse block (4) from the tacho-generator. (5) The
thyristor drive system varies the speed of the DC motor (M) and thus, the drafting rate of the rollers (9).
The electro-magnetic clutch (6) is used to couple the rollers (9) to the basic kinematics of the machine
at startup. A time relay (7) is used to power the clutch, thus disconnecting the rollers and switching to
variable speed. In this way, speed differences throughout the transition processes of starting and stopping
the machine are avoided.
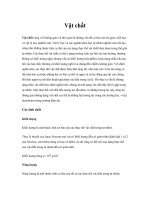
Figure 8.4 shows an example of a closed-loop control system on a textile drawing frame. The sliver
linear density is measured in the packing funnel using an active pneumatic sensor or alike. The signal is
transformed and conditioned by the circuit (2) and compared to the setpoint value U
ref
. The latter is
controlled manually via the potentiometer (3). The error (
⌬
U) is processed by the regulator (5) according
FIGURE 8.3
Drawing frame with open-loop automatic control of the sliver linear density.
FIGURE 8.4
Drawing frame with closed-loop automatic control of the sliver linear density.
© 2001 by CRC Press LLC
to the selected control law usually proportional-integral (PI) or proportional-integral-differential (PID).
The output voltage (U5) of the controller is added to the average draft rate voltage (U7) from the tacho-
generator (TG). The resulting signal is used to govern the variable-speed drive system in which a high-
momentum DC motor (10) controls the speed of the preliminary drafting rollers (11). Here, the syn-
chronization between the variable and constant speeds while starting or stopping the machine is achieved
by means of the tacho-generator feedback signal. The proposed closed-loop control system cannot
influence short-length waves of irregularity within the textile sliver. This is due to the inevitable transport
delay when the material passes the distance between the variable-speed zone and the measuring point.
To avoid oscillating behavior of the system, some restrictions must be implemented. The most important
restriction is to filter and respond to only those irregularities which are at least twice as long as the dead-
zone, and whose behavior in the next several lengths can be predicted (extrapolated). This task requires
more sophisticated algorithms of the controller than the usual PID techniques.
In an effort to overcome the disadvantages of the mentioned classic controlling techniques, different
kinds of combined-type control systems have been implemented in the recent years. Two main problems
however, still exist here. The first one concerns the transducers for measuring the linear density of the
textile sliver. There still has not been found a method and means for reliable, repeatable measurement of
this most important technological parameter. The second problem concerns the high dynamics of the
process, requiring development and implementation of new, fast, and accurate devices for real-time
control.
Automation of Transport Operations in Spinning Technology
Transporting operations are another important field in which automated systems can be implemented with
great efficiency. Figure 8.5 illustrates an approach to building fully automated production line for cards (3)
and drawing frames (4). One or several robocars (1) are used to transport the cans with textile slivers. An
onboard microprocessor unit controls each robocar. One of its tasks is to trace the path line (2) of fixed
type. Transportation paths are scheduled and programmed by the central computer, which also optimizes
the routes. The robocars handle the empty and full cans to and from the machines, following the production
plan for different mixtures of materials. The operator or worker can call each robocar manually, from each
one of the machines which causes rescheduling of the route table by the main computing unit. Figure 8.6
shows the mode of action of a single robocar (1). The can is manipulated by means of the levers (5) which
are operated by the onboard control device of the robocar. After the robocar is positioned against the
FIGURE 8.5
Automated interfactory transport system
for cards and drawing frames.
© 2001 by CRC Press LLC
automatic can changer of the textile machine, the levers (5) exchange the full and empty cans. The empty
can is then transported to the previous processing section, e.g., cards, and put in any free place.
Automated Spinning and Post-Processing of Yarns
The spinning and post-processing (doubling, twisting, and winding) of yarns involve machine services
by the personnel in which monotonous manual operations are required. A worker operating a ring
spinning frame walks an average distance of 10–15 miles per shift while performing manipulations like:
changing roving bobbins, binding broken threads, cleaning flying fibers from the drawing assemblies,
changing full cops with empty, etc. Some of these manipulations require high skills, and even the most
qualified workers cannot efficiently serve the modern high-speed machines. The basic directions for auto-
mation of these operations include: design of assemblies to automate the feeding of the spinning frames
with roving and cops, automatic exchange and arrangement of full and empty cops, automatic binding of
broken threads, automatic cleaning of the machines, aggregating the machines into production lines, etc.
A basic scheme of an automated system for feeding the roving and spinning frames is shown in
Figure 8.7. The condenser bobbins (2), obtained from the roving frames (1) are moved through the
elevated transport line (3) towards the spinning frames (4). The empty cops (5) are returned to the
roving frames by the same transporting facility.
FIGURE 8.6
Robocar system.
FIGURE 8.7
General scheme of an automated system for feeding of roving and spinning frames.
© 2001 by CRC Press LLC
The substantial rate of thread breaks is a characteristic feature of the spinning process. With ring
spinning frames, this rate sometimes equals up to 200 breaks per 1000 spindles per hour; thus, the overall
productivity of the machine can be considerably reduced, even if a highly qualified worker operates it.
With modern high-speed spinning frames (both ring and spindleless) the only way to increase productivity
and reduce machine stops is to implement automated techniques. Figure 8.8 shows an approach in
implementation of a robot (1) in a spindleless spinning frame. The robot moves alongside the machine
on a railroad (2) attached to the machine. Its basic function is to serve as spinning starter while, at the
same time, it cleans the rotors from the flying threads. The spinning starter is controlled by a local
microcomputer device, which synchronizes the motion of all assemblies. The spinning starter uses a
contactless method to control the state of every spinning head of the frame. If a thread break is encoun-
tered, the robot is positioned against the head and performs the following manipulations:
It plugs itself into the pneumo-system of the machine and cleans the working place using an arm. The
arm is first stretched ahead, and then it moves the motionless rotor and cleans it using a brush
and knife while blowing air into the head.
It searches, finds, and gets control on the bobbin thread end and leads it to the zone where the thread
is prepared for spinning start.
It brings the prepared thread end to the threading tube and threads it, following the rotor direction
after the rotor has been brought into motion.
It handles the processed thread to the winding mechanism of the spinning node.
In case of failure, the manipulations listed above are repeated twice before the spinning node is switched
off. The robot [Baumgarter et al., 1989] has an inbuilt microprocessor control unit, which is accessible
through the LAN; thus, different modes of action of the robot can be set, e.g., to modes like threader,
cleaner, or both. Operating parameters like linear density, yarn twist, staple length of the fibers, rotor
diameters, angular speeds, etc., can be set automatically or manually from remote sites like operator’s
stations of the WAN.
The highest level of implementing automated techniques is reached with the winding textile machines.
In the last two decades, durations of hand operations like unloading empty cops, exchanging and
arranging ready bobbins, ends binding, etc., have been reduced by more than 15 times by automated
systems. Figure 8.9 shows an automated winder. The winding section (1) of the machine is connected to
the reserve trunk (2), which is loaded through the feeding box (3).
The level of automation is substantially increased if the spinning frames are aggregated with the
automated winders. The productivity rates of these two machines are equal, eliminating stops of the
process as a whole; thus, the following advantages are achieved:
Transportation of full bobbins from the spinning frame to the winder is avoided, as well as the cleaning
and arranging of the cops and their transportation back to the spinning frame;
Durations of the following preparatory and final operations are reduced: manipulations of the empty
cops, placing the roving bobbins in the winder, cleaning the cops, taking off the bobbins, and
placing the perns in the winding heads.
Yarn damages are avoided due to the elimination of transport operations.
FIGURE
8.8
Spindleless spinning frame served by a robot.
© 2001 by CRC Press LLC
Figure 8.10 shows part of a spinning frame (1) aggregated with an automatic winding machine (2).
The spinning frame is equipped with a stationary changer. The full cops are transported from the spinning
frame to the winder by means of the transport line (3). They are then stored in the box (4) and, after
that, distributed to the winder’s heads. If all the heads are busy, the outcoming cops are transported back
through the line (6). The empty cops from the winding heads are sent into the trunk of the spinning
frame’s automatic changer by means of the transporting device (7). The full bobbins are taken from the
winding heads by the changer (8). In order to equalize the productivity of the aggregated machines, an
additional place (9) is reserved if more winding heads are to be added.
Automated Systems in Weaving
Sizing of Textile Materials
The mixtures for sizing of textile materials are prepared in automated sizing departments (sizing kitchens)
containing batch control systems for recipes handling. The controlled parameters in this case are most often
temperature, pressure, and time intervals for the preparation of the size. Figure 8.11 shows an example of
a fully automated sizing department. Some components are transported using a moving vat (1) through
the pipe (2) into the reservoirs (4). The rest of the components (3) are loaded into the installation directly
from shipped plastic barrels. For every particular recipe held in the non-volatile memory of the controllers
(10) or (11), the components are directed using the distributor (5) to the weighing system (6). From there,
the components are fed into the autoclave (9), where they are mixed with water from the pipe (7) and
heated using the steam-pipe (8). The sequence is controlled by a microcomputer where the batch program
is implemented. The ready mixtures are held in the reservoirs (13) for feeding the sizing machines (14).
FIGURE 8.9
Fully automated winding machine.
FIGURE 8.10
Aggregating a winder with a spinning frame.
© 2001 by CRC Press LLC
The filtering installation (16) is used to recycle the used size. The station (11) controls the sizing machines,
while the microcomputer (12) is used at the higher level to synchronize the requests from the sizing machines
and control the sizing department as a whole. Figure 8.12 shows the schematic of a sizing machine.
The main controlled parameters here are the size level, concentration, and temperature in the sizing
tub. The level is regulated using the backup tub (3), the overflow (4), and a circulation pump. Constant
concentration and viscosity are maintained by adding fresh size in the sizing tub (1). The temperature
is controlled by means of a steam heating system. Constant stretch between the transporting and drying
drums (5) is maintained by individual variable-speed drive systems. Individual or common heating
control is also implemented throughout the process.
Automated Looms
The development of modern control system techniques also concerns such basic textile machines as the
shuttleless looms (rapier, gripper, and pneumatic). Modern looms make use of distributed DC and AC
drive systems, synchronized by a central control unit. Figure 8.13 shows the structure scheme of such a
system implemented for a rapier textile loom. The position of the individual working assemblies is
controlled by different sensor systems.
FIGURE 8.11
Automated sizing department.
FIGURE 8.12
Sizing machine.
© 2001 by CRC Press LLC
The angular position of the main loom shaft is detected by the sensor (S1) with a resolution greater
than one angular degree.
The position of the rapiers (left and right) is registered using the sensors (S2) through (S7) (three
sensors for each rapier).
The system implements a self-learning algorithm in the following way: when the loom is started for
the first time, or after repair, the main shaft is rotated at least twice and the angular positions of the
shaft, corresponding to at least three positions of each rapier, are stored in memory. After that, the normal
operating mode is started. During its normal operation, the control system constantly compares the
positions of the rapiers in these pre-registered points with the remembered values. The loom is auto-
matically stopped if the deviations go beyond certain limits set by the operating personnel.
Breaks of pick threads are registered using the sensor (S8). The loom is automatically stopped after the
main shaft is rotated to a preset angle, which is also changeable through the operator’s keyboard. Several
sensors (S9) are used to control breaks of warp threads in several warp zones of the loom. The individual
heald sensors (S12) through (S39) control the heald frames positions. The heald machine program is
stored and retrieved from the computer memory, and used to control the current weave formation.
Changes of the weave can be made either manually, using the computer man-machine interface, or by
means of external data carriers; i.e., disks, EEPROM memory modules, etc. The sensor (S40) measures
the length of the produced fabric. Applying integrated control systems plays an essential role in efforts to
increase the productivity of the weaving process and achieve better fabric quality. Integrating loom con-
trollers of the above described kind leads to structures, an example of which is presented in Figure 8.14.
FIGURE 8.13
Structure scheme of a loom microcomputer controller.
FIGURE 8.14
Distributed data acquisition and control of looms.
© 2001 by CRC Press LLC
Individual operator’s units with keypad and display are mounted on each loom, in addition to the set of
sensors described above. Up to 15 kinds of stops, e.g., due to machine malfunction or repair, are registered
automatically. The productivity and other performance parameters of the looms are also measured or
calculated. Data concentrators (3) are used for every cluster of 8/16 looms. The bus interface unit (5)
serves as a gateway, connecting the local network at process level with the factory information network at
the higher level where the information can be accessed and managed using the stations (6).
Automated Systems in Finishing
Finishing incorporates complex chemical processes which require precise control of a variety of param-
eters: level of water, chemical solutions and compounds, temperature of the materials, humidity of the
fabrics after drying, acid and base concentrations, hydrogen ions activity, etc. This stage of textile
processing requires sophisticated automated systems and implementation of modern control methods.
Bleaching of Textile Materials
Figure 8.15 shows an example of an automated bleaching line. The cloth (1) enters the washing machine (2)
where constant temperature is maintained by the single-loop system of the sensor (S1) and the controller
(C2). The steam flow for heating is controlled through the valve (V1). The squeezing rollers (SQZ1) at the
output of the washing machine, decrease the water in the material. A pneumatic system is used to maintain
constant pressing force to the rollers, an important condition for the process. The controller (C1) measures
the pressure using the sensor (S2) and controls it by means of the valve (V2). An automatic system for
water level control is often implemented here. From the washing machine, the cloth is transported to the
saturator (3),
where it is emerged in sodium base to remove the remaining size and other particles.
Maintaining constant concentration of the solution is most important at this stage of the process. This task
is accomplished by the controller (C4). The sensor (S3) measures the inside concentration. The controller
actuates the valves (V3) and (V4), which change the flow of water and concentrated solution from the
dosing system (4) to the saturator (3). At the output the water content of the fabric is reduced by means
of the squeezing rollers (SQZ2). The pressing force of the rollers is kept constant by means of a control
system comprising a controller (C3), a sensor (S4), and a valve (V5). From the saturator, the material is
passed to the last section—the compensator (5). Three temperature zones are controlled using the sensors
(S4), (S5) and the controller (C6). The controller (C5) maintains constant pressure of the heating steam.
Sometimes the process of bleaching is intensified by using higher pressure and temperature. An
example of such an apparatus is shown in Figure 8.16. The controller (4) is used to maintain constant
pressure of the steam inside the volume. The transducer (5) forms a signal proportional to the difference
FIGURE 8.15
Automated bleaching line.
© 2001 by CRC Press LLC
between the pressures of the input and the output boxes (2). The controller (6) maintains this pressure
difference in the range of 0.26–0.30 KPa, to avoid fast wearing of the contacting surfaces (2).
Automated Systems in Dyeing
Automated systems in dyeing help producers to decrease wastes of expensive chemicals and to react ade-
quately to the market demands. The basic problems here require use of colorimetric methods for recipe
preparation and handling. Colors should exactly match the patterns, and the system should be able to
reproduce them on demand. Using colorimetric methods for recipe calculation ensures high color matching
precision and cuts recipe preparation time. These methods are based on the existing dependence between
dye concentration and the spectral reflection coefficient of the sample. The optical characteristics of the
samples are measured using specialized spectro-photometers. The data obtained is then used to calculate
recipes for reproduction of the chosen color on the basis of a group of dyeing chemicals. Colorimetric
systems can increase the utilization of chemicals up to 10-20%, and provide reliable, online control of the
dyeing process with less interventions for recipe corrections. Figure 8.17 shows a typical automated dyeing
department. The dyeing components are kept in the reservoirs (3). Each component is transported to the
reservoir using a pump and a filter as shown in, part two of Figure 8.17. The components are periodically
recirculated to prevent settling down. The dosing block (4) incorporates separate valves for each component.
The valves are regulated in increments at four levels or continuously. The valves are operated by the
microcomputer control unit (1), which serves as a batch controller. The components are fed into the
transporting receptacles (6) by the dosing section (4) on the line (6). An automated weighing system controls
FIGURE 8.16
Automated system for boiling and bleaching of textile materials.
FIGURE 8.17
Automated department for dye-stuff preparation.
© 2001 by CRC Press LLC
the dosing process, based on the current recipe. A stirring device with variable speed homogenizes the
contents of every vessel, and the ready components are transported out through the roller line (8). The
system also utilizes an additional block for color sampling used for testing purposes.
With modern dyeing machines, equal coloring of the fabrics is achieved by controlling the pressing
force of the squeezing foulard rollers. This is done with respect to the humidity of the processed material.
Figure 8.18 shows part of an apparatus for continuous dyeing with the system for automatic control of
material humidity after the foulard. The automation of dyeing concerns mainly optimal control of the
process of extracting the dyeing substance. This task is accomplished by controlling such parameters as:
solutions concentrations, temperature, and pH. Figure 8.19 shows the principle scheme of a dyeing system.
The process takes place in the dyeing apparatus (DA). The dye-stuff is supplied from the reservoir (R)
through the valve (V5) and the pump (P1). The pump (P2) is used for recirculation, while the photometer
(PM) measures the current concentration of the solution. The regulating valve (V1) controls the heating
steam flow. The sensor (S) detects the current temperature of the solution. Water and additional chemicals
are supplied through the valves (V2), (V3) and (V4). High dyeing quality is achieved when the process
follows a predefined curve of dye extraction. The process is monitored by the microcomputer control unit
FIGURE 8.18
Automated machine for continuous dyeing.
FIGURE 8.19
A dyeing apparatus with dye-stuff extraction control.
© 2001 by CRC Press LLC
(MC), where the current values of the concentrations are compared against the predefined ones. The
rate of dye extraction is controlled by means of the steam flow and the flow of additional chemicals to
the apparatus.
Automating the Final Quality Control of Cloths
Modern automatic quality control systems are also implemented in the final stage of the textile pro-
duction, where the quality of the ready fabrics is monitored before they are shipped to the customers.
Visual control of the cloth quality, usually performed by man, is difficult to replace with appropriate
automatic device because of the specific requirements for this kind of control. Several approaches to
resolving this problem have found industrial application in modern textile technology. An example of
such a quality control system is shown in Figure 8.20. The cloth formed in a roll is transported to the
inspecting machine (2). After it has passed through the controlling device, the cloth is rolled again and
the roller (5) is transported to the warehouse using the carriage (6). A video camera (7) moving alongside
the roller’s width is used to monitor the cloth surface. The video signal is converted into digital form
and is stored dynamically in the microcomputer (8) memory. The video display unit (11) is used for
both visual control of the surface by the operator and for displaying alphanumerical and graphical
information from the computer; thus, one of the narrow places in quality control is avoided, resulting
in an output speed of the controlled fabric to more than 100 m/min.
8.3 Distributed Systems for On-Line Quality
and Production Control in Textiles
Basic Concepts for On-line Control in Textiles
At present, the majority of conventional (manual) methods for quality control are being replaced by
automated systems. The times when the laboratory staff circulated the site every two hours, cut samples
of sliver or yarn, and then weighed them manually or passed them through a stand-alone quality
controlling device, now belong to the past. In the early 1970s, there came to exist ideas for automated
systems, aimed at replacing human labor in this challenging field. Figure 8.21 gives an example of the
ideas behind the first realizations. In this example, a central processing unit (3) collects information from
four different sources: the opening department, the cards, the drawing frames, and the spinning machines.
Each local unit (1) and (2) serves as a database holder and was developed as a dedicated (embedded)
system. The information concerns such parameters as machine stops, productivity/quantities, linear
density, long- and short-wave regularity, spectrograms, etc. Figure 8.22 gives a more detailed look at the
structure of a typical first generation, automated quality control system in cotton spinning (14). The
data processing units of type (1) are dedicated microprocessor controllers, which serve as data collection
and concentration. The units of type (2) perform more complex calculations like statistic parameters,
distributions, linear density diagrams, and spectrograms. Although, at this stage of industrial automation
FIGURE 8.20
Final control of cloth quality by means of an automated inspecting machine.
© 2001 by CRC Press LLC
there have not yet been adopted layer definitions and standards, some level of diversification can be
observed here. Central processing units of type (3) serve as database holders and information manage-
ment stations at factory level. With the further development of microcomputers after 1985, dedicated
industrial automation systems began to be replaced by devices implementing market industrial versions
of PC hardware and software. This is not the case in textiles, regarding devices of type (2), because the
quality control parameters and, especially, the spectral characteristics, still require dedicated hardware.
Approaches to Building Cost Effective Real-Time
Control Systems in Textiles
Real-Time Process Monitoring
The dispersive nature of textile technology, with hundreds of parameters to measure and control, often
brings the need for implementation of relatively complex and expensive automated systems. The processing
of textile slivers is a typical case. Figure 8.23 presents a common process flow diagram for the classical card
cotton spinning. The first passage double-head drawing frames (1DF1-1DF10) receive textile slivers from
the previous machine array of cards and are followed by a second-passage drawing frames, (2DF1-2DF10).
In this case, there are 160 input and 40 output slivers running at a speed of 5-10 m/s. Production and/or
quality control require that their linear density should be controlled on-line, at least at 40 points, in order
FIGURE 8.21
Structure of a first-generation data
acquisition and control system in textiles.
FIGURE 8.22
Basic structure of an automated production and quality control system.
© 2001 by CRC Press LLC
to ensure supply of the following processing sections with material of desired quality. Some parameters like
spectra, diagrams, control charts, etc. will have to be calculated, too. In addition, start/stop time intervals
for each machine/worker should be registered and classified, as well as summary statistics for the production
site as a whole. In this and similar cases, multi-purpose automation systems offered by the market cannot
meet the specific quality control requirements set forth by the textile technology. One solution is to
implement a smaller, dedicated system with flexible and open structure, allowing interconnection and
further integration. An example of such a system is shown in Figure 8.24. At the lowest Level 1, intelligent
field sensors provide standard signal, or communicate using the network, carrying information for the
linear density of the drawing frame slivers. Start/stop intervals and productivity are measured, as well. Local
controllers at Level 2 serve as data acquisition units with both analog and digital inputs. Basic statistics,
spectra, and quality charts related to the quality control requirements in textiles are obtained on-line. A
PC-based operator’s station at Level 3 controls the system via the bus interface unit (BIU) and communicates
with the local controllers. At preset time intervals, or on request, the station collects information from one
or all controllers and refreshes its internal data base, which is used to produce data sheets of various types,
including quality charts, and report on an hourly, daily, or monthly basis.
FIGURE 8.23
Common process flow diagram for card cotton spinning. (From Djiev, S.N. and Pavlov, L.I., 1995,
Low-cost automated system for on-line quality and production control in textiles, in
Proc. Control. Qual.
, (7), 179–183.
With permission from Elsevier Science.)
FIGURE 8.24
Hierarchy in distributed quality and production control systems. (From Djiev, S.N. and Pavlov, L.I.,
1995, Low-cost automated system for on-line quality and production control in textiles, in
Proc. Control. Qual.
, (7),
179–183. With permission from Elsevier Science.)
© 2001 by CRC Press LLC
Alarms are activated and/or machines are stopped if the linear density of the sliver goes beyond certain
limits during a preset time interval. This structure allows further development of the system towards
distributed feedback control of the drawing frames using the analog outputs of the local controllers and
variable-speed drives. From the network side, the control system field devices (network nodes of a single
drawing frame) take the form presented in Figure 8.25.
On-Line and Off-Line Quality Control of Textile Materials
In many cases with textile processes, the production quality is controlled by means of spectral analysis
of the output material, linear density of which is a basic quality parameter. The processed materials,
textile slivers, are passed through roller drafters to obtain desired cross-sectional area (thickness) and
linear density of the resulting product. It is an immanent property of these processes that they do not
serve as low-pass filters for the disturbances, as is the case with most of the other technological processes
in industry [Djiev, 1994]. As a result, regardless of whether the process is regulated or not, it never reaches
‘steady state’ due to the frequent disturbances of substantial magnitude. The latter are caused mainly by
the variations and/or dimensions of the input material properties. In some cases of machine kinematics
malfunction, the process itself may generate waves of irregularity.
The final estimate of the product quality cannot, therefore, be based only on elementary statistics or
control charts because the variations inside the samples are also of great importance. On the other hand,
the current values of the monitored quality parameter, in this case linear density, are practically unusable
as raw data. This is due to the great output speeds values (5-15 m/s) and the large number of control
points at the production site. For these reasons, an important part of the quality control procedures
becomes the evaluation of the spectral density
S
y
(
):
(8.1)
where,
y
(
t
)
ϭ
output linear density, T
ϭ
period [s], and
ϭ
frequency [rad/s].
The precise value of
S
y
(
) cannot be evaluated because of the finite bandwidth
⌬
of the filters used.
What can be controlled, in practice, is the average power of the signal for a given frequency band
0
Ϯ
(8.2)
FIGURE 8.25
Field-level network with intelligent end devices.
S
y
()
d
ϱϪ
ϩϱ
Ύ
1
T
T ϱ→
lim yt()
2
td
T
2
Ϫ
T
2
Ύ
ϭ
⌬
2
S
y
0
⌬
,()
1
⌬
S
Ύ
y
()
d
0
⌬
2
Ϫ
0
⌬
2
ϩ
Ύ
1
T
y
F
t()
2
td
0
T
Ύ
ϭϭ
© 2001 by CRC Press LLC
where,
y
F
(
t
) is the controlled signal passed through a filter with rectangular amplitude-frequency response
in the range
0
Ϯ
. This section briefly discusses approaches to on-line and off-line process control
quality using spectral criteria and their implementation in the textile industry.
Spectral Criterion
Consider a drafting process with input linear density
x
(
t
) and output linear density
y
(
t
) of the textile
sliver. A spectral criterion (SC) can be used here to measure the distance between the real spectrum
obtained from the process and the so-called normal spectrum
(8.3)
where,
W
s
(
j
)
ϭ
complex gain of the drafting process as a dynamic system (with or without automatic
control) through the main (load) channel
x
(
t
)
→
y
(
t
),
S
x
(
)
ϭ
spectrum of the input textile sliver (process load), and
S
ideal
(
)
ϭ
desired spectrum density of the output sliver as determined by the theory of the process.
In some cases, the ideal spectrum may be obtained in analytical form. For example, in textile
drafting the ideal spectrum for cotton slivers containing fibers of equal length
L
F
is
(8.4)
The additive correction
␣
(
) here is used to form the normal spectrum curve, and is associated with
the inevitable influence of the nonideal conditions on the process, including nonlinear phenomena,
uncontrolled disturbances, etc.
Formally, the value of the SC equaled the area with boundaries determined by the lines of the real and
the normal spectrum of the textile sliver. A graphic interpretation of the
SC
is presented in Figure 8.26. The
integral boundaries in Equation 8.3 are different for the sections A, B, C, and D, all shown in Figure 8.26.
FIGURE 8.26
Graphic interpretation of the spectral criterion. (From Djiev, S.N., 1997, Automated quality control
using spectral criteria, in
Proc. Control. Qual.
, 9(1–3), 17–21. With permission from Elsevier Science.)
⌬
2
SC W
s
j
()
2
S
x
() S
ideal
()
␣
()ϩ[]Ϫ{}
d
min
max
Ύ
ϭ
S
ideal
()
2
L
F
2
1
L
F
cosϪ()ϭ
© 2001 by CRC Press LLC
Off-Line Estimation of the Spectral Criterion
At present, automated quality control usually deals with time series (realizations of the controlled linear
density y(t)) [Djiev, 1997]. If, for example, N(N = N
S
.N
K
) values have been recorded with sample time
T
S
, then an estimate of the spectrum, using Fourier transform is given by
(8.5)
where, ϭ mean value of y(t) for the period T ϭ N
K
.T
S
,
ϭ ϭ wavelength at output linear speed
v of the textile sliver.
Smooth spectra are obtained by averaging, as in Equation 8.5, or by means of windows applied either
to the time series or to the spectrum itself [Papoulis, 1973].
As it previously stated, any attempt to execute
this task in real-time mode of the quality control systems is obstacled by the requirements for speed and
memory that cannot be met by the commonly used industrial computing devices.
On-Line Estimation of the Spectral Criterion
Hardware Realization
Estimates of the spectrum can be obtained using a system of n parallel bandpass filters with fixed
parameters, each one tuned to a central frequency
i
. The signal is processed following the algorithm
from Equation 8.2.
In this case, a subsequent analog-to-digital conversion is needed for the output signals of all channels
in order to integrate the spectrum analyzer in a computerized quality control system. The period T here
is critical for the precision of the estimates [Max, 1981]. Typical problems here are the unstable filters
frequencies
i
, and the variations of their gain and bandwidth values. This approach is used when
designing stand-alone quality control devices, working off-line.
Software Realization
The commonly used software approach is based on different modifications of the fast fourier transform
(FFT), or the Hartley transform [Baumgarter et al., 1989; Djiev, 1997]. The main disadvantage concerning
quality control, is the fixed number of spectrum (frequency) points of the FFT. Although interpolation
can be used for the visual presentation of the spectra [Papoulis, 1973] it is impossible to satisfy the needs
of the real-time quality control because the cycle time is usually very limited. On the other hand, on-
line parallel pipeline FFT techniques are too expensive to be widely implemented in industrial quality
control because they request sophisticated software and hardware [Petrovsky, 1988].
Another approach makes use of an optimal system of parallel digital bandpass filters [Djiev, 1997;
Petrovsky, 1988; Wong and Andres, 1993]. Each one of the filters can be presented with its differential
equation in the form of a ‘continuous’ transfer function with differential operator s:
(8.6)
or as a discrete function in the z-plane (z
Ϫ
K
representing a delay of k sample steps) [Djiev, 1997]:
(8.7)
Slg
()
ln 10
y
2
N
s
y
i
yϪ()exp j2
ij1Ϫ()N
k
ϩ
Ϫ
iϭ1
N
k
Α
2
jϭ1
N
s
Α
ϭ
y
2
v
yt() ⌸-filter ()
2
1
T
S
y
i
,⌬
(), i→
0
T
Ύ
→→→ 1,n[]ϭ
W
F
s()
y
F
s()
ys()
⌬
.s
s
2
⌬
.s
0
2
ϩϩ
,ϭϭ
W
F
z()
y
F
z()
yz()
k
1
1 z
2Ϫ
Ϫ
1 k
1
1Ϫ()k
2
z
1Ϫ
12k
1
Ϫ()z
2Ϫ
ϩϩ
,ϭϭ
© 2001 by CRC Press LLC
where the coefficients
and
independently determine the bandwidth ⌬
and the central frequency
0
of the filter with sample period T
S
.
Application of the Spectral Criterion in the Quality Control of Textile Slivers
The spectral density can be evaluated using a system of digital filters (described above) with a software
realization on a microcomputer process station [Djiev and Pavlov, 1995], or using single-chip digital
signal processors at field level [Petrovsky, 1988].
The program module algorithm of the digital filtration
[Flatau, 1988] for a given frequency band follows the equations:
(8.8)
where, x[k] is the value of the filter input signal x(t) at the moment t ϭ kT
S
, k = 0, 1, 2, …. The direct
programming of each element of the software spectrum analyzer is illustrated in Figure 8.27. In textile quality
control, the wavelengths range between 0.01 and 400 m (i.e.,
ϭ 0.15 – 6000 rad/s). For an estimate of the
spectral criterion in the entire range (see Figure 8.26) a total of 32 bandwidth filters of the type [Jourdain,
1973] are needed. More often, the complexity of the task is reduced when the textile sliver spectrum is
investigated in the sub-ranges A, B, C, and D in Figure 8.26, depending on the type of the technological
process.
The limited number of channels (32 max) and the narrow bandwidth make it possible for conventional
microprocessor or microcomputer, e.g., PC-based, systems to be used for on-line quality control based
on spectral estimates. This approach is usually implemented in low cost automated quality and production
control systems [Djiev and Pavlov, 1995], used for monitoring the quality of cotton slivers in textiles.
Integrating Control and Manufacturing Systems in Textiles
When investing in computer controlled/connected textile machines and installations, some considerations
must be made in advance. While in the late 1980s the overwhelming majority in that field were single
CAD, CAM and computer-aided quality control (CAQ) systems, today efforts should be made toward
FIGURE 8.27 Structural scheme of a bandpass digital filter for on-line spectra estimation. (From Djiev, S.N., 1997,
Automated quality control using spectral criteria, in Proc. Control. Qual., 9(1–3), 17–21. With permission from
Elsevier Science.)
k
1
⌬
T
s
2 ⌬
T
s
ϩ
ϭ
k
2
2
0
T
s
cosϭ
x
1
k[] xk[] k
2
x
2
k[]Ϫ 2x
2
k 2Ϫ[]ϩϭ
x
2
k[] k
1
x
1
k[] k
2
x
2
k 1Ϫ[]x
2
k 2Ϫ[]Ϫϩϭ
yk[] x
2
k[] x
2
k 2Ϫ[]Ϫϭ
© 2001 by CRC Press LLC
integrating these systems in flexible and open structures. The main reasons for this can be found in the
following list of disadvantages, which ‘island’ solutions exhibit:
The different subsystems, i.e., systems for purchase, planning, management on one side and for
patterning, weaving, knitting, etc., on the other work on separate databases, although the sub-
systems themselves may be quite computerized.
Multiple copies of database information exist in each one of these subsystems.
Data actualization becomes costly and ineffective.
Data exchange between the subsystems needs special actions to be taken, most of which are by
operators.
It is hard to fulfill the just-in-time production requirements.
From a more global point of view, there are three main challenges for today’s textile manufacturers:
To have a good estimate of the current market state.
To offer new products and/or models within short reaction time.
To keep the production process effective enough to be worth investing in.
Integrating the existing CAD/CAM, CAP, and CAQ systems into a computer-integrated industry unit
(CAIU) is an important step in that direction. A CAIU, in fact, represents the whole textile factory in
which the office, administrative, financial, and personnel management systems integrate their hardware,
software, and databases with the rest of the computer aided systems—those for planning, design, and
production. As with other industries, the following three fields of activity can be outlined for an auto-
mated textile factory: CAD, CAM, and Planning and Production Management (PPM).
Usually, the integrated state of these three subsystems is denoted as CIM. If the computer-aided office (CAO)
system is added [Schlotterer, 1989], we obtain a preliminary model of how a CAIU is built (Figure 8.28). A
more detailed description of the information and material flows in a CAIU is shown in Figure 8.29. It represents
a common CAIU model, adopted by some of the contemporary developers of integrated systems [Baumgarter
et al., 1989; Flatau, 1988]. As observed from the information flows in the CAIU, the unit management team
determines its goals based on the market demands and state. The quality control, production, and planning
systems have actually penetrated all other parts of the CAIU.
8.4 Summary
The world of industrial production, and textiles in particular, will be facing radical changes with the future
development of new concepts and technical means for automation. Computer integrated and flexible
production systems will substantially change the way people act and participate in the technological
FIGURE 8.28 Integrating computer aided systems in modern manufacturing.
© 2001 by CRC Press LLC
process. Routine and monotonous service duties are increasingly being replaced by managing, planning,
and controlling actions. Because of the specific requirements of textile processing, however, a large number
of workers will still be involved at the production site.
Textile entrepreneurs are not so enthusiastic when it comes to large investments, because automation
offers both opportunity and risk. Unlike high-tech fields, the textile industry often has a way out to the
emerging labor markets as the world becomes more and more open. In the recent decade, it became
much more profitable to establish new production facilities abroad than to start expensive programs for
production automation and system integration at home. The main reason for this is the great diversifi-
cation of labor costs around the world. For an optimal solution, both technical and economical consid-
erations need to be taken into account. Here, we leave the purely technical domain and enter a challenging
field where only an interdisciplinary approach, combining economics and engineering, will help the
textile industry make its way through.
FIGURE 8.29 CIM/CAI model for textile manufacturing.
© 2001 by CRC Press LLC
References
Baumgarter, H., Knischewski, K., and Wieding, H., 1989, CIM Basisbetrachtungen, Siemens AG,
Nurnberg-Moorenbrunn.
Binder, R., 1987, Automatizierungsmöglichkeiten in der Spinnerei, Melliand Textilber., (1) 527–532.
Djiev, S. N. and Pavlov, L. I., 1995, Low-cost automated system for on-line quality and production control
in textiles, Proc. Control Qual., (7), 179–183.
Djiev, S. N., 1997, Automated quality control using spectral criteria, Proc. Control Qual., 9(1–3), 17–21.
Djiev, S. N., 1994, Modeling a double-zone drafter as an object of control, Text. Res. J., 64, 449–456.
Djiev, S. N. and Pavlov, L. I., 1993, Untersuchung der dynamischen Eigenschaften elektromechanischer
Mewertüberträger bei der Feinheitsmessung von Faserbändern, Melliand Textilber., 74, 713–716.
Flatau, U., 1988, CIM Architectural Framework, Digital Equipment Corp., Mainard, MA.
Jourdain, G., 1973, Comparaison de différentes méthodes de reconstitution d’un signal fourni sous forme
échantillonnée, Anales des Télécommunications, 28(1–2).
Linggard, R. and Boyd, J., 1981, High speed digital filter bank, IEE Proc., 128 (E), 212–216.
Max, J., 1981, Méthodes et techniques de traitement du signal et applications aux mesures physiques,
I–Principes généraux et méthodes classiques, Masson, Paris.
Papoulis, A., 1973, Minimum bias windows for high-resolution estimates, IEE Trans., 1(19).
Petrovsky, A. A., 1988, Methods and microprocessor systems for real-time processing of wideband and
high-speed signals, 68–86, Nauka and Technika Publ., Minsk.
Rembold, U., Nhaji, B. O., and Storr, A., 1993, Computer Integrated Manufacturing and Engineering,
Addison-Wesley, Reading, MA.
Uster Bulletine, 1985, Uster, (33).
Schlotterer, H., 1989, CAI als Rationalizierungsperspektive in der Textilindustrie, Melliand Textilber., (1).
Wong, R. Y. and Andres, A. L., 1983, Efficient real-time signal processing with digital bandpass filters,
Proc. SPIE: Real Time Signal Process, YI, 431, 270.