Tài liệu Traffic Analysis Techniques 2 doc
Bạn đang xem bản rút gọn của tài liệu. Xem và tải ngay bản đầy đủ của tài liệu tại đây (741.8 KB, 36 trang )
1
IDIC – SANS GIAC LevelTwo
©2000, 2001
1
Traffic Analysis Techniques 2
Basic traffic characteristics:
– To, From, Date, Time
–Service, Type, or Class
– Sequence numbers, Sets, Patterns
– Weight or Severity
– Size
Welcome to the second half of our study of the fundamentals of traffic analysis. In the first part of
this topic, we discussed some of the basic characteristics that we pay particular attention to when
performing traffic analysis: To, From, Date, Time, Service, Type, Class, Sequence Numbers, Sets
and Patterns. Now let’s build on that foundation by adding weight, severity and size to our list of
analysis dimensions.
2
IDIC - SANS GIAC LevelTwo
©2000, 2001
2
Tiny Fragments
20:36:18.458174 [|tcp] (frag 44435:16@0+)
20:36:18.458793 142.165.206.93 >
my.firewall.net: (frag 44435:4@16)
20:36:18.459620 [|tcp] (frag 61893:16@0+)
20:36:18.460280 142.165.206.93 >
my.firewall.net: (frag 61893:4@16)
Size does matter!
Key to Understanding:
Penetration technique by splitting the header into two parts.
Detect and analysis by Brian Betterton, GCIA:
“History:
None previously observed.
Techniques:
This was a host port scan using tiny fragments.
Targeting:
Absolutely! This source has targeted my firewall specifically, null scanning using tiny
fragmented packets. They are attempting to go unnoticed.
Analysis:
The intruder is probably using nmap, running a null scan, such as in Detect 3. The
difference here is they are also using tiny fragmented packets to try to elude notice. It worked in this
case, as my firewall did not log these.
Severity Level:
(Critical + Lethal) – (System Countermeasures + Net Countermeasures) = Severity
Level
This is a firewall (5), but the attack is unlikely to succeed (1). The firewall did not log these
fragments, so I’ll use an average value for network countermeasures.
(5 + 1) – (5 + 3) = < 0”
When looking at fragmented traffic, some questions you should ask yourself are:
•Are the fragments too small?
•Do the fragments have the right offsets? Do the fragments overlap each other, or are there gaps
between the fragments?
•What is the purpose of the fragmentation?
In this case, the fragments are extremely small. In fact, the first fragment has only 16 bytes, yet the
TCP header itself should be at least 20 bytes long. So it would appear that this fragmentation has
purposely been done in order to split the TCP header between two packets, probably to evade
firewalls, packet filters or intrusion detection systems.
3
IDIC - SANS GIAC LevelTwo
©2000, 2001
3
20:10:49 172.16.82.11.6221 > hosta.1: S
20:10:49 172.16.82.11.6220 > 255.255.255.255.1: S
20:10:52 172.16.82.11.6222 > hostb.1: S
20:10:53 172.16.82.11.6289 > hostc.1: S
20:10:53 172.16.82.11.7300 > hostd.1: S
Trace with complete header shown on notes pages
Key to understanding:
We tend to focus on destination ports, but here we see
that source ports also have a story to tell.
Scan for TCPMUX
Indicator of a burst on system
Here is another scan; all attempts are made to destination port 1, TCPMUX. What makes this scan
interesting is the source ports. Look at the first three lines on the slide. According to the timestamps,
they occur during a three-second period. The source port numbers are 6220, 6221 and 6222. This
implies that no other connections were being initiated by the source system during that time.
Now look at the fourth line. It was logged only a second after the third line, yet the source port has
increased from 6222 to 6289. When we look at the fifth line, which was logged during the same
second as the fourth line, we see that the source port has really jumped – from 6289 to 7300. This is
evidence of a large burst of network activity on the source system – over 1000 ports issued during a
second.
20:10:49 172.16.82.11.6221 > hosta.1: S 3072319638:3072319638(0) win 512
20:10:49 172.16.82.11.6220 > 255.255.255.255.1: S 2109566624:2109566624(0)
win 512
20:10:52 172.16.82.11.6222 > hostb.1: S 1729073814:1729073814(0) win 32120
20:10:53 172.16.82.11.6289 > hostc.1: S 957786113:957786113(0) win 32120
20:10:53 172.16.82.11.7300 > hostd.1: S 4288288149:4288288149(0) win 32120
4
IDIC - SANS GIAC LevelTwo
©2000, 2001
4
NOTE: Slow arrival and two address families; this scan is
probably interleaved across multiple addresses.
14:13:54 newbie.hacker.org.10143 > 192.168.1.1.143:S
14:24:58 newbie.hacker.org.10143 > 172.31.1.1.143:S
14:35:40 newbie.hacker.org.10143 > 192.168.1.2.143:S
14:43:55 newbie.hacker.org.10143 > 192.168.2.1.143:S
14:54:58 newbie.hacker.org.10143 > 172.31.2.1.143:S
15:05:41 newbie.hacker.org.10143 > 192.168.2.2.143:S
15:13:59 newbie.hacker.org.10143 > 192.168.3.1.143:S
Your turn: What dimensions are displayed in this
historic example?
Original IMAP (TCP 143) Script
This example shows a classic IMAP scan. What dimensions are shown here? Remember, the basic
traffic external dimensions are:
• To, From, Date, Time
• Service, Type, or Class
• Sequence numbers, Sets, Patterns
• Weight or Severity
•Size
The static source port of 10143 introduces the notion of a signature attack. This is the source port
that was used on the original IMAP exploit reported to Bugtraq. This makes it really easy to detect
when this exploit script is used, which is becoming rare.
Other dimensions in the example include: time, to, from, service, and patterns. Note both the
destination network IDs and that only SYN packets were used.
5
IDIC - SANS GIAC LevelTwo
©2000, 2001
5
host.2822 > fw.53: S 37007:37007(0) win 512
fw.53> host.2822: S 12000:12000(0) ack 37008
win 32768 (DF)
host.2822 > fw.53: . ack 1 win 16060 (DF)
Key to understanding:
No attack here. Window sizes can be negotiated during
the TCP conversation; this was just one of the nicest
examples of this I have ever seen.
Negotiating Window Sizes
Not every trace that we look at is an attack or a probe. The example in this slide shows two hosts
negotiating the TCP window size. The window size is used to restrict the flow of packets by limiting
the number of packets that have been sent but not yet acknowledged. This is perfectly normal
behavior; however, if you are not familiar with window sizes, this may look suspicious to you.
6
IDIC - SANS GIAC LevelTwo ©2000, 2001
6
Sequential, Temporal,
Service Dimensions
• Sequence numbers as patterns
• Sequence numbers as signatures
• Time data for ordering
• Time data for correlation
• Service or application
So far, we have studied traffic analysis through its external dimensions, such as To,
From, and Service. Although dissecting the traffic using the external dimensions is
certainly the heart of traffic analysis, there are other dimensions that can be used as
well.
First, there are sequential dimensions – thinking of sequence numbers as patterns or as
signatures. We have already discussed this to some extent, but we will expand on this
concept in the coming slides.
Another way of analyzing data is by studying its temporal dimensions – using time data
for ordering or for correlating events.
A final way of examining the traffic is by using the service dimensions – focusing on a
particular service or application.
7
IDIC - SANS GIAC LevelTwo
©2000, 2001
7
10:16:58.602949 scanr.1869 > 172.20.211.0.137: udp 50
10:16:58.603041 scanr.1869 > 172.20.211.0.137: udp 50
10:17:00.763690 scanr.1869 > 172.20.211.0.137: udp 50
10:17:02.175284 scanr.1750 > 172.20.211.0.echo:udp81
10:51:57.583558 scanr.1869 > 172.20.211.0.137: udp 50
10:51:58.624647 scanr.1869 > 172.20.211.0.137: udp 50
10:52:00.175124 scanr.1869 > 172.20.211.0.137: udp 50
10:52:01.942465 scanr.1382 > 172.20.211.0.echo:udp81
… Only echoes shown from here on in
10:55:22.696118 scanr.1385 > 172.20.211.0.echo: udp 81
10:59:12.389749 scanr.1104 > 172.20.211.0.echo: udp 81
11:04:12.879154 scanr.1041 > 172.20.211.0.echo: udp 81
11:10:39.223615 scanr.1539 > 172.20.211.0.echo: udp 81
NetBIOS and Echo
This scan is a mixture of NetBIOS and UDP echo service connection attempts. The
biggest anomaly here is that the scan is sent to the legacy broadcast address,
172.20.211.0. Windows systems will not answer these broadcasts, so it is not clear
what the attacker’s intent is. Perhaps he or she is confused, looking for a router, or
possibly looking for a SAMBA system. Since the source port for the NetBIOS
attempts is not 137, this indicates that something other than NBTSTAT is being used
by the scanning computer to generate this traffic.
The pattern is stable across many packets – three NetBIOS-NS scans and then an
echo. The source port on the NetBIOS attempts is always constant, while the source
port on the echo attempts changes each time. So it appears that two separate
processes are running. Note that the echo source port is descending until the final
example, when it gets out of sequence. This might be the clue that allows an analyst
to tie this pattern to some other piece of information, but it would be a long shot.
8
IDIC - SANS GIAC LevelTwo
©2000, 2001
8
Web (TCP 80) Example
15:05:15 surfer.1497 > server.http: S 28396544:28396544(0) win 8192 (DF)
15:05:16 server.http > surfer.1497: S 115698281:115698281(0) ack 28396545
win 8760 (DF)
15:05:46 server.1123 > surfer.1533: P 739781:741229(1448) ack 1823985720
win 8116 (DF)
15:06:09 surfer.http > server.1424: R 2572545643:2572545643(0) win 0
15:06:09 server.1348 > surfer.7777: SFR 3105729:3107161(1432) ack
688054539 win 8320 (DF)
15:06:29 surfer.1497 > webserver.http: F 340:340(0) ack 10221 win 8760
(DF)
More of the transaction is shown in the notes
Your turn: what is wrong with this picture?
15:05:15.880000 surfer.1497 > webserver.http: S 28396544:28396544(0) win 8192
(DF)
15:05:16.100000 webserver.http > surfer.1497: S 115698281:115698281(0) ack
28396545 win 8760 (DF)
15:05:16.13 surfer.1497 > webserver.http: P 1:340(339) ack 1 win 8760 (DF)
15:05:18.93 surfer.1496 > webserver.http: P 380:743(363) ack 73 win 8688 (DF)
15:05:19.27 surfer.1496 > webserver.http: F 743:743(0) ack 73 win 8688 (DF)
15:05:19.71 surfer.1496 > webserver.http: R 28354188:28354188(0) win 0 (DF)
15:05:22.65 surfer.1497 > webserver.http: P 1:340(339) ack 1 win 8760 (DF)
15:05:46.92 webserver.1123 > surfer.1533: P 739781:741229(1448) ack 1823985720
win 8116 (DF)
15:06:09.39 surfer.http > webserver.1424: R 2572545643:2572545643(0) win 0
15:06:09.55 webserver.1348 > surfer.7777: SFR 3105729:3107161(1432) ack
688054539 win 8320 (DF)
15:06:29.99 surfer.1497 > webserver.http: F 340:340(0) ack 10221 win 8760 (DF)
15:06:58.36 surfer.1497 > webserver.http: R 28396885:28396885(0) win 0 (DF)
15:07:45.93 surfer.1491 > webserver.http: R 27843570:27843570(0) win 0 (DF)
15:08:02.13 webserver.http > surfer.1490: F 5681:5681(0) ack 589 win 8173 (DF)
So what is wrong with this picture? It starts out innocently enough, with a user and a web server. We see
several different ports in use on the client’s machine, but that is typical of HTTP traffic, where different
elements on a web page may each require their own connection. This trace gets weird in the middle, when
webserver’s port 1123 sends a PUSH/ACK to the user’s port 1533, the user sends a RESET from their port
80 to webserver’s port 1424, and webserver’s port 1348 sends a SYN/FIN/RESET to the user’s port 7777.
Although it’s hard to tell exactly what’s going on, it appears that the surfer may have come across a
malicious web site. The web site could be probing the user’s machine, by attempting to contact it on
common ports (HTTP, in this case) and by sending packets with odd flag combinations, such as
SYN/FIN/RESET.
9
IDIC - SANS GIAC LevelTwo
©2000, 2001
9
NetBIOS (TCP 139)
06:49:55.47 proberA.4197 > 172.20.139.137.139: S 596843772:596843772(0) win 8192
(DF)
06:49:58.44 proberA.4197 > 172.20.139.137.139: S 596843772:596843772(0) win 8192
(DF)
06:50:04.44 proberA.4197 > 172.20.139.137.139: S 596843772:596843772(0) win 8192
(DF)
06:50:16.43 proberA.4197 > 172.20.139.137.139: S 596843772:596843772(0) win 8192
(DF)
12:57:56.94 proberE.2038 > 172.20.216.29.139: S 294167370:294167370(0) win 8192
(DF)
12:57:59.91 proberE.2038 > 172.20.216.29.139: S 294167370:294167370(0) win 8192
(DF)
12:58:05.92 proberE.2038 > 172.20.216.29.139: S 294167370:294167370(0) win 8192
(DF)
12:58:41.96 proberE.2039 > 172.20.216.29.139: S 294212415:294212415(0) win 8192
(DF)
Your turn: pattern continues on notes pages. None
of the hosts exist. What can we tell from this pattern?
The pattern continued for weeks at multiple sites.
13:37:51.75 proberI.4186 > 172.20.215.205.139: S 22881687:22881687(0) win 8192 (DF)
13:37:54.96 proberI.4186 > 172.20.215.205.139: S 22881687:22881687(0) win 8192 (DF)
13:38:00.74 proberI.4186 > 172.20.215.205.139: S 22881687:22881687(0) win 8192 (DF)
13:38:12.89 proberI.4186 > 172.20.215.205.139: S 22881687:22881687(0) win 8192 (DF)
13:50:23.64 proberB.3293 > 172.20.53.123.139: S 355997160:355997160(0) win 8192 (DF)
13:50:26.55 proberB.3293 > 172.20.53.123.139: S 355997160:355997160(0) win 8192 (DF)
13:50:32.56 proberB.3293 > 172.20.53.123.139: S 355997160:355997160(0) win 8192 (DF)
13:50:44.54 proberB.3293 > 172.20.53.123.139: S 355997160:355997160(0) win 8192 (DF)
14:11:01.95 proberC.3491 > 172.20.245.182.139: S 57370977:57370977(0) win 8192 (DF)
14:11:04.88 proberC.3491 > 172.20.245.182.139: S 57370977:57370977(0) win 8192 (DF)
14:11:10.94 proberC.3491 > 172.20.245.182.139: S 57370977:57370977(0) win 8192 (DF)
14:11:23.06 proberC.3491 > 172.20.245.182.139: S 57370977:57370977(0) win 8192 (DF)
15:41:59.50 proberG.3278 > 172.20.252.141.139: S 266305199:266305199(0) win 8192 (DF)
15:42:02.70 proberG.3278 > 172.20.252.141.139: S 266305199:266305199(0) win 8192 (DF)
15:42:08.53 proberG.3278 > 172.20.252.141.139: S 266305199:266305199(0) win 8192 (DF)
15:42:21.09 proberG.3278 > 172.20.252.141.139: S 266305199:266305199(0) win 8192 (DF)
22:49:15.39 proberH.3658 > 172.20.124.23.139: S 14035939:14035939(0) win 8192
22:49:18.33 proberH.3658 > 172.20.124.23.139: S 14035939:14035939(0) win 8192 22:49:24.37
proberH.3658 > 172.20.124.23.139: S 14035939:14035939(0) win 8192 22:49:36.61 proberH.3658 >
172.20.124.23.139: S 14035939:14035939(0) win 8192
So what can we tell from this pattern? We can see that these are sets of 4 connection attempts. Within each set, the source
and destination ports are the same, and the sequence numbers are fixed. However, among the various sets of attempts, all
the source ports are different, and all the sequence numbers are different. So the signature is sets of 4 attempts with SYN
only set to destination port 139; also, the window size is always set to 8192.
These are most likely appearing in sets of 4 because of retries. Note that there is a clear pattern in the timestamps within
each set of 4 – the gap between attempts is 3 seconds, then 6 seconds, then 12 seconds. Normally, when retries occur, the
source ports and sequence numbers remain the same, as they do here.
10
IDIC - SANS GIAC LevelTwo
©2000, 2001
10
TTL
• In the notes pages are the Time To Live
fields from the traces in the previous
slide. Notice how they cluster around
120. This is not expected behavior. This
is also fixed in the nmap 2.08 release,
which has a decoy function so that the
decoy TTLs are random.
Analysis credit to Army Research Lab
Destination IP Address: 172.20.224.77
TTL: 118
Traceroute Back: Timeout occurred after 10/7/7 hops
Expected Traceroute hops: 10
Destination IP Address: 172.20.204.154
TTL: 120
Traceroute Back: 12/12/10 hops
Expected Traceroute hops: 8
Destination IP Address: 172.20.204.154
TTL: 120
Traceroute Back: 12/10/11 hops
Expected Traceroute hops: 8
Destination IP Address: 192.168.212.123
TTL: one connection 115, 3 connections 116
Traceroute Back: 14/13/12 hops
Expected Traceroute hops: 12-13
Destination IP Address: 172.20.122.157
TTL: 120
Traceroute Back: Timeout occurred after 12/11/11 hops
Expected Traceroute hops: 8
11
IDIC - SANS GIAC LevelTwo ©2000, 2001
11
Treating Port Numbers as
Sequence Numbers
• Can we get meaningful information
by treating port numbers as
sequence numbers?
Let’s explore whether we can get meaningful information by treating port numbers as
sequence numbers. If you think about it for a minute, there are similarities between port
numbers and sequence numbers. Normally, their values are incrementing over time.
Certain protocols, such as FTP and HTTP, tend to use a lot of port numbers during any
given session. In these cases, it may make sense to use all of the port numbers as
sequence numbers in order to better analyze the traffic.
12
IDIC - SANS GIAC LevelTwo ©2000, 2001
12
TCP Port Sequence (FTP)
09/04/97 07:39:17 C 1030 -> A ftp
09/04/97 07:39:29 A ftp-data -> C 1031
09/04/97 07:39:31 A ftp-data -> C 1032
09/04/97 07:39:32 A ftp-data -> C 1033
09/04/97 07:39:36 A ftp-data -> C 1034
09/04/97 07:39:37 A ftp-data -> C 1035
date time SRCIP src port DSTIP dest port
04/27/98 10:17:31 B 20 D 3062 t
04/27/98 10:27:32 B 20 D 4466 t
04/27/98 06:34:22 B 20 D 1363 t
04/27/98 09:12:15 B 20 D 4814 t
04/27/98 09:15:07 B 20 D 1183 t
04/27/98 10:11:30 B 20 D 1544 t
If we compare SRC/DST pairs, the pattern is obvious
This slide shows a very vanilla FTP file transfer. On the first line, C is establishing an
FTP connection with goslo. The source port called FTP-DATA (or TCP port 20, if you
prefer) remains fixed during the file transfer, and the destination port for C is
incrementing by one.
Note: FTP is rich in patterns caused by the large number of states in the protocol, as
well as some curious implementations of it. Grep “ftp|ftp-data” from a large volume of
traffic and sit down with a cup of coffee for a half hour sometime.
13
IDIC - SANS GIAC LevelTwo ©2000, 2001
13
Comparison of Two FTPs
Bounce versus normal
SRC/DEST Port Pairs
0
2000
4000
6000
12345678910
Packets
Port Number
A
B
FTP Bounce pattern falls out fairly easily
Let’s look at two different FTP sessions, A and B. The graph shows both sessions, with
the packet number along the bottom and the port number along the side. Both source
and destination ports are included on the graph. Here is the data that was used, showing
the source and destination port pairs for the A and B sessions:
A: 20 1031 20 1032 20 1033 20 1034 20 1035
B: 20 3062 20 4466 20 1363 20 4814 20 1183
The ports from most FTP sessions will cluster to A’s line in the graph, so the outlying
traffic will fall out fairly easily.
This graph was created in Excel as a default line chart.
14
IDIC - SANS GIAC LevelTwo ©2000, 2001
14
09/04/97 05:49:14 192.168.4.2 2051 -> smtp-ftp.swc.navy.mil 21
09/04/97 05:49:17 192.168.4.2 2051 -> smtp-ftp.swc.navy.mil 21
09/04/97 05:49:23 192.168.4.2 2051 -> smtp-ftp.swc.navy.mil 21
09/04/97 05:49:35 192.168.4.2 2051 -> smtp-ftp.swc.navy.mil 21
09/04/97 05:50:55 192.168.4.2 2055 -> smtp-ftp.swc.navy.mil 21
09/04/97 05:50:58 192.168.4.2 2055 -> smtp-ftp.swc.navy.mil 21
09/04/97 05:51:04 192.168.4.2 2055 -> smtp-ftp.swc.navy.mil 21
09/04/97 05:51:16 192.168.4.2 2055 -> smtp-ftp.swc.navy.mil 21
TCP Port Sequence (FTP)
Failed connection
What we see above is probably a failure to make a connection. The source host
(192.168.4.2) appears to be retrying four times. As with our earlier example, the
timestamps are increasing by 3, 6 and 12 seconds in each set of 4 attempts. Also, note
the source port column values, 2051 and 2055. The source port is changing between
each set of attempts, which means that this traffic is not being generated by a tool with a
fixed source port.
15
IDIC - SANS GIAC LevelTwo ©2000, 2001
15
Failed - Successful Connection
Failed Versus Successful FTP
0
1000
2000
3000
12345678910
Packets
Port Number
A
C
Note the two patterns are fairly similar to one another
This graph shows sessions A and C, which we looked at on the last two slides. A was a
successful FTP attempt, while C was an unsuccessful FTP attempt that retried several
times. This is the data that was used for the graphs, with the numbers being source port
/ destination port pairs:
A: 20 1031 20 1032 20 1033 20 1034 20 1035
C: 2051 21 2051 21 2051 21 2051 21 2055 21
Notice how similar the two patterns are; both are alternating between values that do not
appear to be changing (although the higher port numbers are actually changing very
slightly).
16
IDIC - SANS GIAC LevelTwo ©2000, 2001
16
All Three FTP Cases
0
1000
2000
3000
4000
5000
ABC
Series1
Series2
Series3
Series4
Series5
Series6
Series7
Series8
Series9
A 20 1031 20 1032 20 1033 20 1034 20
B 20 3062 20 4466 20 1363 20 4814 20
C 2051 21 2051 21 2051 21 2051 21 2055
This graph contains the data from the chart on the slide, which lists the source and
destination port pairs from session A (successful FTP), session B (FTP Bounce attack)
and session C (unsuccessful FTP). The data was plotted with Microsoft Excel using
cones. Note how B is clearly the odd pattern.
17
IDIC - SANS GIAC LevelTwo ©2000, 2001
17
6 FTP Cases
6 FTP Patterns Compared
0
2000
4000
6000
12345678910
A
B
C
D
E
F
A 201031 201032 201033 201034 201035
B 203062 204466 201363 204814 201183
C 2051 21 2051 21 2051 21 2051 21 2055 21
D 201121 201122 201123 201124 201125
E 201025 201026 201027 201028 201029
F 201124 201124 201124 201124 201124
This is the general pattern of a file transfer;
large http transfers are very similar.
Let’s expand our graph to include 3 more FTP sessions. Sessions D and E are from
successful FTPs, while session F is from a failed FTP. Of the 6 sessions, the only one
which is substantially different from the others is B, the FTP bounce attack. Note that
session F, where the file transfer failed, still doesn’t deviate from the expected pattern.
18
IDIC - SANS GIAC LevelTwo ©2000, 2001
18
6 FTP Cases (2)
0
1000
2000
3000
4000
5000
ABCDE F
Series1
Series2
Series3
Series4
Series5
Series6
Series7
Series8
Series9
A 201031 201032 201033 201034 201035
B 203062 204466 201363 204814 201183
C 2051 21 2051 21 2051 21 2051 21 2055 21
D 201121 201122 201123 201124 201125
E 201025 201026 201027 201028 201029
F 201124 201124 201124 201124 201124
B’s port scan is still obvious.
One of the problems that we face with intrusion detection is that there is a lack of good
visualization support. It bothers us too! We have found that using Perl to put commas
in the file allows us to suck the data we are evaluating into Excel so we can use its
graphing functions. Obviously, we only do this for cases where we don’t know what is
going on. Many times, the graphing will make the “oddball” pattern stand out. In this
case, by doing the cone graph in Excel, we can see that session B is clearly different
from all the others.
19
IDIC - SANS GIAC LevelTwo ©2000, 2001
19
What is Out of Bounds?
• Is it the pattern or the port ranges
that are out of bounds?
There’s a potential problem with the way that we have been doing the graphing of the
FTP sessions; we have not been adjusting the height of the graphs. It shouldn’t matter if
the initial client port is 1200 or 5000; what matters is the amount of change in that port
number during the FTP session. It would be easier to see some patterns if all entries
were adjusted to a maximum client port number, for instance. The next slide will
demonstrate what we need to do.
20
IDIC - SANS GIAC LevelTwo ©2000, 2001
20
“Stealthy” Port Scan
B’s numbers adjusted so they are all in A-F range
0
500
1000
1500
2000
2500
AB CDE F
A 20 1031 20 1032 20 1033 20 1034 20 1035
B 20 2055 20 1031 20 2051 20 1033 20 1124
C 2051 21 2051 21 2051 21 2051 21 2055 21
D 20 1121 20 1122 20 1123 20 1124 20 1125
E 20 1025 20 1026 20 1027 20 1028 20 1029
F 20 1124 20 1124 20 1124 20 1124 20 1124
Here’s a Microsoft Excel bar chart which shows the adjusted numbers. In this example,
all the numbers have been cooked so that none of B’s ports are higher than the highest
values from the other sessions, or lower than the lowest values from the other sessions.
Even after this adjustment has been made, we see that the pattern is still different than a
normal file transfer.
21
IDIC - SANS GIAC LevelTwo ©2000, 2001
21
Time IS On Your Side
• Synchronize your watches
–rdate, ntp
• Identify and allow for drift
• Order of events
• Correlation of non-relational data
If you can manage your time sources, then it becomes possible to place events observed
by disparate sensors in order.
Suppose you have detected a very large file transfer originating from engineering to
your_competitor.com. In engineering, you find a unix workstation, crashed, with a
dangling SCSI cable. The room is secured with a badge swipe; what do you do?
Note that the firewall logs and badge reader logs do not have a field in common; they
are non-relational, except for time.
22
IDIC - SANS GIAC LevelTwo ©2000, 2001
22
Links, Tallies and Profiles
• Link analysis
• Hourly, daily, weekly tallies
•Profile changes
Now we’re ready to move on to some additional types of traffic analysis. First, we will
talk about link analysis, which is a way of graphing traffic based on the flow of data
between IP addresses and/or ports. Next, we will look at tallies – periodic reports that
can show “low and slow” scans that other reports may not detect. Finally, we will
discuss profiling and how profile changes can tip you off that something abnormal is
occurring.
23
IDIC - SANS GIAC LevelTwo ©2000, 2001
23
Traffic Analysis: Links
A - C
D - C
C - A
B - D
C - A
D - A
A
B
C
D
When a message is passed between a From and a To, that creates a “link” between the
From and To. Entities joined by links are nodes.
The links can be weighted, in the case above by the number of connections, but the
weighting could be based on service or sequence numbers just as well. This approach
can be used to help the intrusion analyst tackle the really hard problems. For instance,
on the next slide, we have an example of some fairly inscrutable data.
24
IDIC – SANS GIAC LevelTwo
©2000, 2001
24
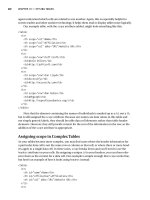
Link Analysis
•One way data flow
• Four ports involved:
1226, 119, 166, 85
• 1226, 119 are
dominant
1226
119
85 166
Is two way
communication
indicated?
10/10-04:51:48.961206 MY.NET.218.106:1226 ->
207.172.3.46:119
TCP TTL:126 TOS:0x0 ID:61083 DF
**SF*PAU Seq: 0xA Ack: 0x62AFF411 Win: 0x5010
=+=+=+=+=+=+=+=+=+=+=+=+=+=+=+=+=+=+=+=+=+=+=+=+=+=+=+=+
10/10-04:56:20.338924 MY.NET.218.106:1226 ->
207.172.3.46:119
TCP TTL:126 TOS:0x0 ID:55141 DF
**SF**AU Seq: 0xA6D60 Ack: 0xF9DD Win: 0x5010
=+=+=+=+=+=+=+=+=+=+=+=+=+=+=+=+=+=+=+=+=+=+=+=+=+=+=+=+
10/10-04:56:21.435483 MY.NET.218.106:1226 ->
207.172.3.46:119
TCP TTL:126 TOS:0x0 ID:41062 DF
21SFRPAU Seq: 0xA6D71 Ack: 0xF9E3EFF2 Win: 0x5010
=+=+=+=+=+=+=+=+=+=+=+=+=+=+=+=+=+=+=+=+=+=+=+=+=+=+=+=+
10/10-04:57:38.479016 MY.NET.218.106:166 ->
207.172.3.46:1226
TCP TTL:126 TOS:0x0 ID:10918 DF
*1SFRP*U Seq: 0x77000A Ack: 0x705DFB70 Win: 0x5010
=+=+=+=+=+=+=+=+=+=+=+=+=+=+=+=+=+=+=+=+=+=+=+=+=+=+=+=+
10/10-04:57:50.390941 MY.NET.218.106:1226 ->
207.172.3.46:119
TCP TTL:126 TOS:0x0 ID:51376 DF
21SFRPAU Seq: 0xA70E5 Ack: 0xFBB974FF Win: 0x5010
=+=+=+=+=+=+=+=+=+=+=+=+=+=+=+=+=+=+=+=+=+=+=+=+=+=+=+=+
10/10-04:58:05.637975 MY.NET.218.106:85 ->
207.172.3.46:1226
TCP TTL:126 TOS:0x0 ID:47033 DF
2*SFRPAU Seq: 0x77000A Ack: 0x715CFBFF Win: 0x5010
=+=+=+=+=+=+=+=+=+=+=+=+=+=+=+=+=+=+=+=+=+=+=+=+=+=+=+=+
10/10-05:01:37.982432 MY.NET.218.106:1226 ->
207.172.3.46:119
TCP TTL:126 TOS:0x0 ID:26200 DF
2*SF*P** Seq: 0xA79CB Ack: 0xA20088 Win: 0x5010
The data shown on this slide is clearly anomalous; just take a look at the TCP flag fields. Let us tell
you enough of the answer so that you do not go crazy. All of the data is a connection to a News
Server. So while our data clearly shows that port 1226 is dominant, using the “where is the traffic
coming from” rule, NNTP port 119 would be the key service. All the connections appear to be in
one direction, so we either have one-way communication, or we have two-way communication that
is using an out of band connection such as asynchronous routing so that we cannot detect responses.
Graphing a one way data flow direction is pretty boring, so we look for an additional feature in the
traffic, and on this slide we have found the port numbers add richness to our study. If you examine
the ports, you see a hint that two way communication may exist here. There is traffic from 1226 to
119 and also traffic from 119 to 1226, even though we only see the one direction. This data was part
of the student’s practical assignment from SANS in Monterey, October 2000, so you might enjoy
reading their analysis at />25
IDIC – SANS GIAC LevelTwo
©2000, 2001
25
10/10-04:35:00.981620 MY.NET.218.106:255 -> 207.172.3.46:1226
TCP TTL:126 TOS:0x0 ID:52704 DF
**SF*P** Seq: 0x77000A Ack: 0x3B10E031 Win: 0x5010
TCP Options => Opt 32 (32): 2020 2000 080A 0005 F052 0000 0000
0000 0000 0000 0000 0000 0000 0000 0000 EOL EOL EOL EOL EOL EOL
EOL EOL
10/10-04:42:19.551530 MY.NET.218.106:70 -> 207.172.3.46:1226
TCP TTL:126 TOS:0x0 ID:42238 DF
*1SF*P*U Seq: 0x77000A Ack: 0x4B44E8CB Win: 0x5010
TCP Options => Opt 32 (32): 2020 2000 01C9 8B5F 82AD 0014 0000
0000 0000 0000 0000 0000 0000 0000 0000 EOL EOL EOL EOL
10/10-04:43:59.871764 MY.NET.218.106:70 -> 207.172.3.46:1226
TCP TTL:126 TOS:0x0 ID:13137 DF
2*SFRP** Seq: 0x77000A Ack: 0x4F62EAC4 Win: 0x5010
TCP Options => Opt 32 (32): 2020 2000 56F1 1EE9 FBE2 0103 0000
0000 0000 0000 0000 0000 0000 0000 0000 EOL EOL EOL EOL EOL EOL
EOL EOL
=-=-=-=-=-=-=-=-=-=-=-=-=-=-=-=-=-=-=-=-=-=-=-=-=-=-=-=-=-=-=-
10/10-04:33:20.634850 MY.NET.218.106:1226 -> 207.172.3.46:119
TCP TTL:126 TOS:0x0 ID:2470 DF
**SFR*A* Seq: 0x46000A Ack: 0x36D0DE63 Win: 0x5010
04 CA 00 77 00 46 00 0A 36 D0 DE 63 06 17 50 10
w.F 6 c P.
22 02 3D A2 20 20 20 20 20 00 ".=. .
10/10-04:33:47.156693 MY.NET.218.106:1226 -> 207.172.3.46:119
TCP TTL:126 TOS:0x0 ID:11959 DF
*1SF*PAU Seq: 0xA Ack: 0x3813DEEC Win: 0x5010
10/10-04:34:33.532247 MY.NET.218.106:1226 -> 207.172.3.46:119
TCP TTL:126 TOS:0x0 ID:48081 DF
21SFRPAU Seq: 0xA39EF Ack: 0xDFBA8D48 Win: 0x5010
04 CA 00 77 00 0A 39 EF DF BA 8D 48 00 FF 50 10
w 9 H P.
22 38 B1 C4 20 20 20 20 20 00 "8 .
Link Analysis
•One way data flow
•No ephemeral
ports in use
• 1226, 119 are
dominant
1226
119
85 166
255
70
As we look at a second snippet of the traffic between these pairs, we begin to see the traffic has
particular behaviors. It may well be two way communication, even though we don’t see both traffic
directions. Be certain to note the unchanging sequence numbers in the top section. In the lower
section we see repeated content and also a packet with no content.
Obviously we don’t want to make a final call with so few packets, but based on what we have shown,
we appear to have a communication system of some form that follows fairly complex rules instead of
just a mess of totally broken packets with no order at all. As we add additional packets, we can
continue to expand the graph. Obviously one of the things we would look for are exceptions to the all
ephemeral ports, and a new IP address would help to show what is possible here.
10/10-03:42:06.639261 MY.NET.220.142:3937 -> 207.172.3.46:119
TCP TTL:126 TOS:0x0 ID:42796 DF
**SFR**U Seq: 0x510 Ack: 0xBAB17F78 Win: 0x5010
20 20 20 20 20 00 .
10/10-03:48:55.649195 MY.NET.220.142:0 -> 207.172.3.46:3937
TCP TTL:126 TOS:0x0 ID:10535 DF
*1SF***U Seq: 0x770510 Ack: 0xD0B1884D Win: 0x5010
TCP Options => Opt 32 (32): 2020 2000 0402 8496 82B0 0014 0000
0000 0000 0000 0000 0000 0000 0000 0000 EOL EOL EOL EOL