A simple and efficient approach for preconcentration of some heavy metals in cosmetic products before their determinations by flame atomic absorption spectrometry
Bạn đang xem bản rút gọn của tài liệu. Xem và tải ngay bản đầy đủ của tài liệu tại đây (204.29 KB, 14 trang )
Turk J Chem
(2016) 40: 988 1001
ă ITAK
c TUB
Turkish Journal of Chemistry
/>
doi:10.3906/kim-1604-76
Research Article
A simple and efficient approach for preconcentration of some heavy metals in
cosmetic products before their determinations by flame atomic absorption
spectrometry
ă
Nail ALTUNAY, Ramazan GURKAN
Department of Chemistry, Faculty of Sciences, Cumhuriyet University, Sivas, Turkey
Received: 25.04.2016
•
Accepted/Published Online: 10.09.2016
•
Final Version: 22.12.2016
Abstract: In the current study, a simple and efficient analytical method for preconcentration and determination of
Cd(II), Pb(II), and Sn(II) in some cosmetic samples, using ultrasonic assisted-cloud point extraction and flame atomic
absorption spectrometry, was developed. The method is based on the ternary complex formations of Sn(II), Pb(II), and
−
Cd(II), which are available in the form of neutral and/or anionic hydroxo complexes (Sn(OH) −
3 , Pb(OH) 3 , Cd(OH) 2 ,
+
and/or Cd(OH) −
3 ) , with Victoria Pure Blue BO (VPB ) in the presence of cetylpyridinium chloride at pH 8.5, and then
extraction of the formed ternary complexes into the micellar phase of polyoxyethylene sorbitan monostearate (Tween
60). Using the optimized conditions, a linear relationship was observed in the ranges of 12–330 µ g L −1 for Cd(II), 4–200
µ g L −1 for Pb(II), and 1–275 µ g L −1 for Sn(II). The detection limits for Cd(II), Pb(II), and Sn(II), respectively, were
3.70, 1.35, and 0.45 µ g L −1 , with a preconcentration factor of 50, and the precision as relative standard deviations was
lower than 4.2% for each analyte. The validity was verified by analysis of two certified reference materials. Finally, the
method was successfully applied to the determination of these metals in various cosmetic samples.
Key words: Extraction, green chemistry, heavy metals, pollution, spectroscopy, surfactants
1. Introduction
As is known, cosmetic samples have been commonly used to change the appearance of the skin, hair, and nails
by people worldwide for centuries. Cosmetic samples include face and body care preparations (creams, lotions,
soaps, etc.), color cosmetics (lipsticks, mascaras, eye shadows, etc.), and hair products (shampoos, colors, gels,
etc.). 1 Unfortunately, some harmful chemicals are known to occur during the preparation of cosmetic samples. 2
Some harmful chemical species in cosmetic samples are toxic elements such as lead (Pb), cadmium (Cd), arsenic
(As), mercury (Hg), and tin (Sn). Compounds of the elements are water-soluble, and sweat can support the
percutaneous absorption of elements. 3 Heavy metals (Pb, Cd, and Sn) in cosmetics can be also accumulated in
living tissues, particularly in human bodies, causing vital health problems such as to central nervous function,
lungs, kidneys, livers, and other vital organs. 4 Therefore, the directive 76/768/EEC and further revisions
banned the use of Cd, Co, Cr, Ni, and Pb as metallic ions or salts in the preparation of cosmetic formulations. 1
Hence, the accurate and reliable determination of heavy metal levels in cosmetic samples is one of the main
research subjects of analytical chemistry.
∗ Correspondence:
988
¨
ALTUNAY and GURKAN/Turk
J Chem
Numerous atomic spectroscopic and electroanalytical techniques such as flame atomic absorption spectrometry (FAAS), 5−7 atomic fluorescence spectrometry (AFS), 8 electrothermal atomic absorption spectrometry (ETAAS), 9,10 anodic and cathodic striping voltammetry (ASV and CSV), 11,12 inductively coupled plasma
optical emission spectrometry (ICP-OES), 13−15 differential pulse stripping voltammetry (DPSV), 16 and inductively coupled plasma mass spectrometry (ICP-MS) 17−19 have been used for determination of Cd, Pb, and
Sn in foods, cosmetics, and solid environmental samples. Among these techniques, FAAS is widely used for
determination of heavy metals in various matrices due to its good precision and accuracy, low cost, and simple
instrument. 20 It also has special features such as high selectivity and low susceptibility to matrix interferences.
However, the sensitivity of FAAS is not sufficient for determination of Cd, Pb, and Sn in many real samples
because they are found in very low concentrations in those samples. Thus, an analytical step such as extraction,
hydride generation, or preconcentration is required before FAAS detection. For alleviation of this problem,
ultrasonic assisted-cloud point extraction (UA-CPE) was recently developed as an alternative to conventional
liquid–liquid extraction (LLE) and co-precipitation. This extraction procedure shows some advantages such as
simplicity, quickness, lower toxicity, high recoveries, and high concentration factors. 21 It is usually insufficient
due to matrix interferences and trace amounts of metal ions. Initially, UA-CPE was employed for the separation
and preconcentration of chemical species from various sample matrices. It is important to mention that, when
the UA-CPE is applied for extraction of chemical species in different samples, it is necessary to add a suitable
chelating agent, which results in a complex formation with affinity to extraction solvent, which can easily be
extracted to surfactant-rich phase. 22
In the current study, before analysis by FAAS, we proposed the UA-CPE procedure for separation/preconcentration of Cd(II), Pb(II), and Sn(II) ions from cosmetic samples by using a Victoria Pure Blue BO, a
cationic triphenylmethane group dye, as a chelating agent in the presence of cetylpyridinium chloride (CPC)
and polyoxyethylene sorbitan monostearate (Tween 60) at pH 8.5. Analytical variables such as pH, the ionic and
nonionic surfactant amounts, the complexing agent amount, the sample volume, ultrasonic time, temperature,
and matrix effect were exhaustively investigated. The method was validated by analysis of two certified reference
materials (CRMs) by standard addition method, and then applied to the determination of the analytes in various
cosmetic samples with satisfactory results.
2. Results and discussion
2.1. Sample preparation
In current study, for digestion of the cosmetic samples and CRMs, complete acid digestion with heating was used.
The experimental steps of the process were as follows. All cosmetic samples (2.5 g) were accurately weighed
into beakers of 100 mL. Then an aliquot of 20.0 mL of a mixture of 65% (v/v) HNO 3 , 35% (v/v) H 2 O 2 , and
3 mol L −1 HClO 4 (2:1:1, v/v) was added to the beakers using a graduated pipette, and was completed to
100 mL with water. The resulting mixtures were allowed to decompose on heating plates at 125 ◦ C for about
1 h in a hood. At the end of 1 h digestion, the resulting mixtures were transferred into centrifugation tubes
and centrifuged for 10 min at 4000 rpm. 23 Then the solutions were filtered through a 0.45-µ m membrane filter
into volumetric flasks of 50 mL. The pH of the solutions was adjusted to 7.0 using dilute NaOH (1.0 mol L −1 )
and diluted to 50 mL with water. The above-mentioned sample preparation procedure was similarly applied to
CRMs (Clay CRM051-050 metals on soil and SRM 1548a typical diet). In the same way, the reagent blanks
were also prepared for the correction of the analytical signals of each metal. In the sample preparation step,
989
¨
ALTUNAY and GURKAN/Turk
J Chem
all sample preparations were repeated five times. For the determination of Cd(II), Pb(II), and Sn(II) in the
cosmetic samples by FAAS, an aliquot of 2.0 mL of the pretreated cosmetic samples and CRMs was submitted
to the proposed UA-CPE procedure.
2.2. The UA-CPE procedure
The UA-CPE procedure was carried out as follows. An aliquot of 10 mL of the standard solution containing
analytes (Cd, Pb, and Sn) was placed into a 50-mL centrifuge tube and the pH was adjusted to 8.5 using
tris-acetate buffer solution. Sequentially, 0.7% (w/v) of CPC, 0.25% (v/v) of Tween 60, and 1.5 × 10 −5 mol
L −1 of VPB + were added. Then the tubes were sonicated for 10 min at 60 ◦ C. In this stage, the solution
became cloudy and the formed ternary complexes were extracted into the micellar phase of Tween 60. After
that, for phase separation, the tubes were centrifuged for 5 min at 4000 rpm and the surfactant-rich phase was
obtained at the bottom of the centrifuge tubes. Because the resulting micellar phase was very viscous, it was
diluted to 1.0 mL using acidic methanol (containing 0.1 mol L −1 HNO 3 ) . By only varying the burner and
the radiant source, the contents of Cd, Pb, and Sn in samples were monitored and determined by FAAS. To
determine the effects that may result from the reagents used, a blank solution was also subjected to a similar
process and determined in parallel to the sample solutions and CRMs.
Data processing and all statistical calculations (ANOVA) were performed using Excel 2010 (Microsoft
Office). The results obtained by three replicated measurements of samples and each CRM sample were expressed
as mean ± SDs. In terms of accuracy and precision, Student’s t-test and variance ratio F-test were used to assess
whether there was a significant difference between certified and experimentally found values. A significance level
of 95% was adopted for all comparisons.
2.3. Optimization of UA-CPE conditions
To achieve the maximum recovery of each analyte, different analytical variables including pH, the ionic/nonionic
surfactant amounts, the chelating agent amount, the sample volume, ultrasonic time, temperature, and matrix
effect were investigated in detail. During the optimization step, a fixed concentration of 20 µ g L −1 of each
analyte was used, and one-at-a-time strategy was employed.
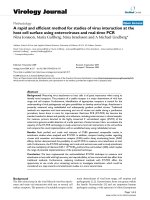
2.3.1. Effect of pH
The formation of a hydrophobic stable complex is required for a successful UA-CPE process. For this purpose,
pH is the first variable to be optimized, because the complex formation of Cd(II), Pb(II), and Sn(II) with
chelating agent mostly depends on their forms at a particular pH. Moreover, the recovery of each analyte
is significantly dependent on the pH of the aqueous solution. From the studies conducted in the pH range
of 6.0–9.5, the best recovery for each analyte was obtained at pH 8.5. It can be seen in Figure 1 that the
recovery increased along with increasing pH in the range of 6.0–8.5 and then gradually decreased. At higher
pHs than 8.5, the cause of the signal decrease may be the conversion of the chelating agent, VPB + , to carbinol
by nucleophilic attack of hydroxyl ions, OH − , in alkaline media. Among different buffers such as phosphate,
universal Britton–Robinson, and tris-acetate, the best sensitivity was obtained using the tris-acetate buffer.
Therefore, tris-acetate buffer at pH 8.5 was used to achieve the best recovery.
990
¨
ALTUNAY and GURKAN/Turk
J Chem
2.3.2. Effect of amount of chelating agent
The Victoria Pure Blue BO (VPB + ), which is a member of the cationic triphenylmethane group of dyes
containing a naphthylamine group with a hydrolysis constant of 2.16 (or pK a : 11.84), was selected as chelating
agent because it gives stable and suitable ion-pairing complexes with the most metals depending on environment
pH. Moreover, as a result of the resonance interaction between the carbocation, R + , and lone pairs of electrons
on the N-atoms of diethylamino and ethylamino substituents on aryl rings, it is a highly stable reagent with
a carbocation stability of pK R+ : 8.57 even in alkaline pHs, in which R + + H 2 O ↔ ROH + H + . This high
pK +
R value might be due to delocalization of the carbocationic change by strong resonance effect of one-NHET
and two-NET 2 on the structure of dye. Due to its positive surface charge, it is clear that Sn(II), Pb(II),
and Cd(II) ions, which can easily be hydrolyzed and form neutral and anionic hydroxo complexes, Sn(OH) −
3 ,
−
Pb(OH) −
3 , Cd(OH) 2 , and/or Cd(OH) 3 at higher pHs than 6.0 with hydrolysis constants of 3.80, 7.71, and 10.8,
respectively, can form stable ion-pair complexes in the presence of CPC as sensitivity enhancer in aqueous micelle
media at pH 8.5. 24−26 In this sense, after preconcentration from sample matrix with CPE in the presence of
excess SCN − and CPC at pH 2.0, ion-pairing reagent, VPB + , was successfully used in the determination of low
levels of molybdenum with a detection limit of 2.18 µg L −1 in the range of 7.5–1800 µ g L −1 . 27 Furthermore,
the reagent has been used successfully in the determination of Sb(V) in the range of 1–250 µ g L −1 with a
detection limit of 0.25 µ g L −1 after preconcentration by CPE at pH 10, while it is used in the determination
of Sb(III) in the range of 10–400 µ g L −1 with a detection limit of 5.15 µ g L −1 . 28 In order to achieve the
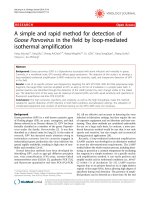
maximum recovery for each analyte, the effect of VPB + amount was investigated in the range of (8–20) ×
10 −5 mol L −1 . As can be seen in Figure 2, 15 × 10 −5 mol L −1 of VPB + can provide quantitative recovery
for each analyte, and concentrations of the VPB + higher than 15 × 10 −5 mol L −1 caused no change in the
recoveries except for Pb(II) with a slight decrease in signal. Consequently, 15 × 10 −5 mol L −1 of VPB + was
used to achieve the best recovery.
100
100
Cd(II)
Pd(II)
Sn(II)
90
80
Recovery, %
Recovery, %
80
70
60
60
40
50
Cd(II)
Pb(II)
Sn(II)
40
20
30
6
7
8
9
pH
Figure 1. Effect of pH on the recoveries of analytes under
the optimized conditions.
8
10
12
14
16
18
20
Victoria Pure Blue concentration, x 10 -5 mol L -1
Figure 2. Effect of Victoria Pure Blue BO amount on the
recoveries of analytes under the optimized conditions.
991
¨
ALTUNAY and GURKAN/Turk
J Chem
2.3.3. Effect of ionic surfactant amount
The cationic surfactant (CPC) was used as both a sensitivity enhancer and counter ion in the preconcentration
step of the ion-pairing complexes. It can effectively transfer ternary complexes into the micellar phase of
extracting agent, Tween 60, above critical micellar concentration (CMC), so as to cause an increase in sensitivity.
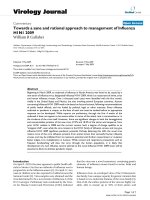
To ensure this, the effect of CPC in the range of 0.1%–1.0% (w/v) was optimized. From the results obtained
in Figure 3, it is understood that the CPC concentration strongly affects the recovery of each analyte. With
regard to the CPC concentration, the best recovery for each analyte was observed for 0.7% (w/v) of CPC.
Consequently, this value was used to achieve the best recovery.
2.3.4. Effect of nonionic surfactant amount
The main criterion for the best recovery of the UA-CPE process is nonionic surfactant type and concentration.
In the present study, polyoxyethylene sorbitan monostearate (Tween 60) was selected as the extracting nonionic
surfactant because of its features like ecofriendliness, low cost, and low cloud point temperature. On the other
hand, the surfactant concentration is very important to obtain a high preconcentration factor. When nonionic
surfactant concentration increases above the optimal value, the amount of the surfactant-rich phase increases
after the UA-CPE, and consequently the preconcentration factor decreases. The phase was also too sticky and
more difficult for subsequent handling. In this context, the effect of the Tween 60 concentration on the recovery
was investigated in the range of 0.01%–0.5% (v/v) for each analyte. The results are shown in Figure 4. The
recovery for each analyte was approximately the same between 0.2% and 0.3% (v/v) of Tween 60. This optimal
value, which corresponds to a concentration of 1.94 mmol L −1 , is above the critical micelle concentration (CMC)
of 0.0206 mmol L −1 (27 mg L −1 ). Therefore, a concentration of 0.25% (w/v) was used to achieve the best
recovery.
100
100
90
80
Recovery, %
Recovery, %
80
60
60
50
Cd(II)
Pb(II)
Sn(II)
40
70
40
Cd(II)
Pb(II)
Sn(II)
30
20
0.2
0.4
0.6
0.8
1.0
CPC concentration, (w/v)%
Figure 3. Effect of the CPC amount on the recoveries of
analytes under the optimized conditions.
0.1
0.2
0.3
0.4
0.5
Tween 60 concentration, (v/v)%
Figure 4. Effect of the Tween 60 amount on the recoveries
of analytes under the optimized conditions.
2.3.5. Effect of sample volume
Because the target analyte concentration in the selected sample is usually low, the sample volume is one of the
most important parameters for preconcentration and optimization. To evaluate the effect of sample volume, six
992
¨
ALTUNAY and GURKAN/Turk
J Chem
different volumes (2, 5, 10, 20, 30, and 40 mL) of sample were investigated by using model solutions for each
analyte under optimal conditions. As can be seen in Figure 5, the recovery for each analyte increases up to 10
mL sample volume. Above this volume, the recovery value of the Sn(II) ion remained stable, but the recoveries
of Cd(II) and Pb(II) decreased. Therefore, a sample volume of 10 mL was used to achieve the best recovery.
100
Recovery, %
90
80
70
60
50
40
Cd(II)
Pb(II)
Sn(II)
10
20
Sample volume, mL
30
40
Figure 5. Effect of the sample amount on the recoveries of analytes under the optimized conditions.
2.3.6. Effect of equilibrium temperature and ultrasound extraction time
For preconcentration procedure, the temperature of the assay medium is a very important parameter for the
formation of micelles. Therefore, the effect of the equilibrium temperature on the recovery for each analyte
was investigated in the range of 40–80 ◦ C under ultrasonic effect for 10 min. As a result of the experiments
conducted, the separation of the two phases was quantitatively complete at 60 ◦ C and the recovery of each
analyte was approximately the same. Consequently, an equilibrium temperature of 60 ◦ C was used to achieve
the best recovery. Ultrasound effect is an important stage at which the formation of micelles becomes well
dispersed in the aqueous solution. The ultrasound extraction time was defined as the time between the addition
of the Tween 60 and the end of sonication. To study this, the effect of ultrasound extraction time on the recovery
of each analyte was investigated in the range of 2–20 min. Consequently, optimum ultrasound extraction time
was adopted as 10 min. In addition to these experiments, centrifugation time and rate were investigated in
the range of 1000–4000 rpm and 2–10 min, respectively, because they are necessary when preconcentrating
trace amounts of each analyte with the best percent recovery in a short time. The results obtained show that
centrifugation for 5 min at 4000 rpm leads to the best recovery and sensitivity for each analyte.
2.3.7. Effect of diluting agent volume
The surfactant-rich phase obtained after the UA-CPE is very viscous, because the phase contains a high
concentration of Tween 60. In addition, the volume obtained is rather small for determination of the analytes
by FAAS. For these reasons, the viscosity of the surfactant-rich phase must be reduced with a suitable solvent,
and the volume should be increased. As a result of studies conducted with different solvents (methanol, ethanol,
acetonitrile, acetone, hydrochloric acid, acidic methanol, and acidic ethanol), the best and reproducible recovery
value for each analyte was obtained using acidic ethanol. The surfactant-rich phase was also diluted to 1.0 mL
with acidic methanol to obtain a high preconcentration factor.
993
¨
ALTUNAY and GURKAN/Turk
J Chem
2.3.8. The matrix effect
Because of the high selectivity provided by FAAS using a hollow-cathode lamp, the low sample recovery can
result from the preconcentration step. The cationic and anionic species, which are available as concomitant in
the composition of cosmetic samples, may either react with ligand or form a stable complex with metal ions.
The recoveries of the analytes may accordingly decrease. The effects of interfering ions on the recoveries of the
analytes were investigated using FAAS in the optimized reagent conditions. The results of the study as recovery
values and tolerance limits are presented in Table 1. Tolerance limit was defined as the highest amount of
foreign ions that produced an error not exceeding ±5.0% in the three replicate determinations of investigated
analyte ions. It is clear that the recovery is quantitative in the range of 95.1%–103.3% with a standard deviation
ranging from 0.7% to 1.4%. The tolerance limits were found to be in the range of 75–1000.
Table 1. Effect of some foreign ions on the recoveries of analytes under the optimized conditions.
Foreign ions
+
+
NH+
4 , K , Na
2+
2+
Ca , Sr , Mg2+
SO2−
4
Cr3+
Al3+
Cu2+
Cl−
As3+
Co2+
Fe3+
Zn2+
Tolerance limit
[Foreign ions]/[analyte]
1000
800
700
500
450
400
350
250
150
125
75
Recovery ± SD %
Cd(II)
Pb(II)
95.7 ± 1.2
102.1 ± 1.5
97.3 ± 1.4
101.4 ± 1.2
98.5 ± 1.1
96.8 ± 1.4
97.0 ± 1.3
97.2 ± 1.0
101.4 ± 1.7 95.3 ± 1.1
95.8 ± 0.9
96.0 ± 1.1
97.7 ± 1.1
97.4 ± 1.3
102.3 ± 1.2 102.9 ± 1.2
101.6 ± 1.1 95.5 ± 0.9
95.1 ± 0.7
103.3 ± 0.9
97.2 ± 1.2
102.4 ± 1.2
Sn(II)
97.5 ± 1.2
98.4 ± 1.1
98.9 ± 1.3
95.4 ± 1.1
97.7 ± 1.2
101.8 ± 1.3
102.4 ± 1.4
95.3 ± 1.0
97.6 ± 1.3
95.8 ± 1.2
95.4 ± 1.1
2.4. Analytical features
Analytical figures of merit of the method (regression equation, linear working range, the limit of detection, limit
of quantitation, precision, and enrichment factor) were achieved after the proposed preconcentration process
was applied to a serial standard solution of each analyte under optimized reagent conditions. The limits of
detection (LOD) and quantification (LOQ), defined as the ratio of three and ten times the standard deviation
of the blanks (σblank ) to the slope of the calibration graphs (m) constructed for Cd(II), Pb(II), and Sn(II) were
determined by analysis of a blank solution. The LOD obtained from 3σblank /m for Cd(II), Pb(II), and Sn(II)
were 3.70, 1.35, and 0.45 µ g L −1 , respectively. The LOQ obtained from 10σblank /m for Cd(II), Pb(II), and
Sn(II) were 12.2, 4.5, and 1.5 µ g L −1 , respectively. The sensitivity enhancement factor, which is calculated by
using the ratio of the slopes of calibration curves obtained with and without the preconcentration, was 75.8,
126.5, and 98.2 for Cd(II), Pb(II), and Sn(II), respectively. The precision as the percent relative standard
deviations (RSDs%) was generally lower than 4.2% for Cd(II) (30 µ g L −1 ) , Pd(II) (25 µ g L −1 ) , and Sn(II)
(15 µ g L −1 ). The other analytical features of the method are also demonstrated in Table 2.
2.5. The accuracy and analytical applications
The validity of the method was primarily evaluated by analysis of the certified reference materials like Clay
CRM051-050 metals on soil and SRM 1548a typical diet for Cd(II), Pb(II), and Sn(II) values. The results of the
994
Abs = 1.03 × 10⁻³ [Cd(II)] + 4.6 × 10⁻⁴
Abs = 4.56 × 10⁻³ [Pb(II)] + 3.48 × 10⁻⁴
Abs = 7.42 ì 103 [Sn(II)] + 2.14 ì 104
Cd(II)
Pb(II)
Sn(II)
LOD
àg L1
3.70
1.35
0.45
1
LOQ
àg L1
12.2
4.50
1.50
2
EF
75.8
126.5
98.2
3
Wavelengt
h (nm)
228.8
283.3*
286.3**
LC
(mA)
8
10
10
4
BH
(mm)
7
7
9
5
SB
(mm)
0.7
0.7
0.7
6
Air/C2 H2
flow rates
(L min−1 )
15.0/1.8
15.0/2.0
15.0/3.0
1
The limits of detection, 2 The limits quantification, 3 Enhancement factor, 4 Lamp current, 5 Spectral bandwidth, 6 Burner height.
*The more sensitive resonance line of 217.0 nm for Pb was not used in this study, due to causing fluctuations arising from noise in the analytical results.
**In a similar way, the more sensitive resonance lines of 224.6 and 235.5 nm for Sn were not used in this study, due to causing fluctuations in the analytical
results, so as to lead to poor precision in especially low concentrations.
Regression equation
Analyte
Linear
range
µg L−1
12–330
4–200
1–275
Table 2. The instrumental operation conditions of FAAS and analytical figures of merit of the method.
ă
ALTUNAY and GURKAN/Turk
J Chem
995
¨
ALTUNAY and GURKAN/Turk
J Chem
study are shown in Table 3, and there was good agreement between the certified and observed values for each
analyte. The accuracy was also investigated by standard addition method for each analyte. In this context,
different concentrations of Cd(II), Pb(II), and Sn(II) ions were spiked in the CRMs and selected cosmetics
samples. The method was then applied to these mixtures. The results obtained are extensively given in Tables
3 and 4. The recovery values for 20 and 30 µ g L −1 concentrations of Cd(II) were 95.4%–101.2% and 97.5%–
102.7%, respectively. The recovery values for 10 and 20 µ g L −1 concentrations of Pb(II) were 96.3%–101.8%
and 97.0%–101.3%, respectively. The recovery values for 15 and 25 µ g L −1 concentrations of Sn(II) were
96.5%–98.4% and 97.8%–100.9%, respectively.
Furthermore, the precision of the proposed procedure was investigated by means of the parameters of
repeatability and reproducibility. To assess repeatability (the intraday precision), five replicate measurements of
each analyte at levels of 20 and 40 µ g L −1 were made on the same day. In conclusion, the mean concentrations
of Cd(II) were 20.3 ± 0.4 and 39.5 ± 0.9 µg L −1 with a RSD ranging from 2.5% to 2.9%, respectively. The
mean concentrations of Pb(II) were 19.4 ± 0.8 and 40.6 ± 1.3 µ g L −1 with a RSD ranging from 2.4% to 3.2%.
The mean concentrations of Sn(II) were 20.5 ± 0.3 and 40.9 ± 1.1 µ g L −1 with a RSD ranging from 1.9% to
2.6%.
To assess reproducibility (the interday precision), the same concentrations of each analyte were measured
for five consecutive days. In conclusion, the mean concentrations of Cd(II) were 19.8 ± 0.3 and 39.7 ± 0.9 µ g
L −1 with a RSD ranging from 2.2% to 2.5%. The mean concentrations of Pb(II) were 19.5 ± 0.7 and 40.8 ±
1.2 µ g L −1 with a RSD ranging from 2.2% to 2.7%. The mean concentrations of Sn(II) were 39.7 ± 0.4 and
41.1 ± 1.3 µg L −1 with a RSD ranging from 2.3% to 2.7%.
To test its analytical applicability, the method was applied to determination of Cd(II), Pb(II), and Sn(II)
levels in various cosmetic samples including shampoo, conditioner, hair dye, lipstick, nail polish, gel, powder,
foundation, eyeliner, and skin cleanser by standard addition method. The results of the study were compared
in terms of the analyte contents. The mean metal contents were arranged in the following decreasing order:
Cd(II) > Pb(II) > Sn(II) for hair dye, nail polish, and skin cleanser; Pb(II) > Sn(II) > Cd(II) for shampoo,
foundation, gel, and lipstick; Cd(II) > Sn(II) > Pb(II) for powder and eyeliner; and Sn(II) > Cd(II) > Pb(II)
for conditioner. The further results are presented in Table 4. It can be seen that the RSDs obtained for Cd(II),
Pb(II), and Sn(II) in these samples are 1.7%–2.5%, 1.9%–2.9%, and 1.3%–2.1%, respectively.
Finally, a comparison of the proposed procedure with other methods reported in the literature for determination of Cd(II), Pb(II), and Sn(II) by atomic spectrometric and other techniques is given in Table 5. 29−35
The method shows a lower or comparable detection limit, good precision, and high sensitivity enhancement
factor with respect to other studies in the literature, and does not require any costly equipment. The chemicals
and equipment have features like low cost, low toxicity, simplicity, and robustness of the operational conditions.
For these reasons, the method can be generally applicable for routine analytical laboratories.
996
SRM 1548a typical diet
Added
Certified
(µg L−1 ) value
20
35 ± 1.5
30
10
44 ± 0.9
20
15
17.2 ± 2.6
25
The critical F (4,4) value is 6.39 for 95% confidence level and four degrees of freedom.
The critical t-value is 2.31 for 95% confidence level and four degrees of freedom.
a
b
Sn(II)
Pb(II)
Cd(II)
Analytes
Clay CRM051-050 metals on soil (µg kg−1 )
Added
Certified
Recovery
Found
(µg L−1 ) value
%
40.3 ± 1.3
95.4
20
60.7
±
1.8
97.2
42.2
30
70.8 ± 2.2
98.1
42.5 ± 1.7
96.3
10
52.9
±
1.9
97.8
44.1
20
63.1 ± 2.4
98.5
79.0 ± 3.1
96.5
15
94.6
±
3.3
97.6
81.9
25
105.2 ± 3.7 98.4
35.4
55.5
64.6
42.5
52.3
62.9
16.7
32.7
41.8
±
±
±
±
±
±
±
±
±
Found
0.9
1.7
1.9
0.8
1.2
1.3
2.6
2.9
3.1
(µg kg−1 )
Recovery
%
101.2
100.9
99.4
96.6
97.1
98.4
97.3
101.6
99.2
F-value
2.45, 2.57
1.78, 2.11
2.74, 1.90
-
a
Table 3. The analysis results of certified reference materials (CRMs) by the proposed method (n: 5).
Students
t-value
1.05, 0.87
0.75, 1.3
1.20, 0.95
-
b
ă
ALTUNAY and GURKAN/Turk
J Chem
997
998
Conditioner
Eyeliner
Powder
Lipstick
Gel
Foundation
Shampoo
Skin cleanser
Nail polish
Hair dye
Samples
Cd(II) (µg kg−1 )
Added Found
4.5 ± 0.1
25
28.3 ± 0.6
5.8 ± 0.1
25
30.2 ± 0.6
3.6 ± 0.7
25
29.3 ± 0.5
3.9 ± 0.1
25
27.8 ± 0.6
4.20 ± 0.08
25
30.1 ± 0.5
3.30 ± 0.06
25
27.2 ± 0.5
5.7 ± 0.1
25
30.2 ± 0.6
11.1 ± 0.3
25
37.1 ± 0.8
10.3 ± 0.2
25
36.7 ± 0.7
9.9 ± 0.2
25
34.2 ± 0.6
Recovery %
95.7
98.2
101.5
96.1
95.4
96.3
98.4
102.7
103.8
97.9
RSD %
2.3
2.0
2.5
2.2
2.1
1.7
2.3
2.2
1.9
1.7
1.8
1.7
2.4
2.1
2.5
2.2
2.3
2.0
2.4
1.9
Pb(II) (µg kg−1 )
Added Found
2.10 ± 0.06
15
16.3 ± 0.4
3.9 ± 0.1
15
18.4 ± 0.5
3.10 ± 0.07
15
17.8 ± 0.4
9.2 ± 0.2
15
23.4 ± 0.4
6.5 ± 0.1
15
22.0 ± 0.3
3.8 ± 0.1
15
18.9 ± 0.4
8.6 ± 0.2
15
22.8 ± 0.5
2.70 ± 0.08
15
16.9 ± 0.4
6.1 ± 0.1
15
20.1 ± 0.5
8.3 ± 0.2
15
23.9 ± 0.5
Recovery %
95.3
96.5
98.1
96.7
102.5
103.4
96.9
95.5
95.4
102.6
RSD %
2.8
2.4
2.6
2.5
2.5
2.2
2.3
2.0
1.9
1.8
2.4
2.1
2.2
1.9
2.9
2.6
2.7
2.4
2.6
2.3
Sn(II) (µg kg−1 )
Added Found
0.90 ± 0.01
20
20.1 ± 0.4
1.70 ± 0.03
20
20.8 ± 0.4
1.50 ± 0.03
20
21.9 ± 0.3
5.30 ± 0.08
20
24.6 ± 0.3
5.90 ± 0.01
20
24.9 ± 0.4
3.40 ± 0.06
20
22.4 ± 0.3
6.9 ± 0.1
20
26.3 ± 0.3
9.80 ± 0.2
20
28.7 ± 0.5
7.7 ± 0.1
20
28.4 ± 0.5
12.4 ± 0.2
20
32.9 ± 0.6
Recovery %
96.2
95.9
102.1
97.3
96.5
95.9
97.8
96.4
102.5
101.7
Table 4. Recovery and determination of the analytes from the cosmetic samples after the preconcentration (n: 5).
RSD %
1.9
1.8
2.0
1.8
1.8
1.5
1.6
1.4
2.1
1.8
1.7
1.4
1.6
1.3
1.8
1.7
2.0
1.6
1.9
1.7
ă
ALTUNAY and GURKAN/Turk
J Chem
¨
ALTUNAY and GURKAN/Turk
J Chem
Table 5. Comparison of the proposed method with other reported methods for preconcentration and determination of
the analytes.
Samples
Beverages
Solid samples
Vegetables
Pharmaceutical
ingredients
Tap water and
tea samples
Foods
Corn seeds
Cosmetic samples
a
Analyte(s)
Cd
Pb
Cd
Pb
Cd
Pd
Analytical
detection
technique
1.25–50
5–200
5–200
Detection
limit,
µg L−1
0.05
1.40
0.45
0.10
0.76
1.90
216–3000
1.44
3.2
50
500–5000
12–330
UA-CPE/FAAS 4–200
1–275
200
0.36
3.70
1.35
0.45
11.3
13.1
34
35
75.8
126.5 This work
98.2
GFAAS
CEFC/FAAS
SPE/ICP-OES
ASV
Cd
SPE/GFAAS
Sn
Sn
Cd
Pb
Sn
ICP-AES
ICP-MS
Linear working
range,
µg L−1
2.5–10
20–200
RSD %
a
3.2
8.4
4.7
5.7
50
94.9
≤ 4.2
EF
References
29
30
31
32
33
EF: Enhancement factor, ICP-MS: Inductively coupled-plasma-mass spectrometry, GFAAS: Graphite furnace atomic
absorption spectrometry, CEFC/FAAS: Carrier element free co-precipitation/Flame atomic absorption spectrometry,
SPE/ICP-OES: Solid phase extraction-inductively coupled plasma optical emission spectrometry, ASV: Anodic stripping
voltammetry, SPE/GFAAS: Solid phase extraction-graphite furnace atomic absorption spectrophotometry, ICP-AES:
Inductively coupled plasma atomic emission spectrometry.
3. Experimental
3.1. Instrument
The elements (Cd, Pb, and Sn) were determined by flame atomic absorption spectrophotometer (FAAS)
(Shimadzu AAS-6300 model, Japan) with deuterium background correction. An ultrasonic bath (UCS-10
model, Seoul, Korea), maintained at the desired temperature and ultrasonic power (40 kHz, 300 W), was used
for the UA-CPE procedure. A centrifuge (Universal-320, UK) with 50-mL calibrated centrifuge tubes (Isolab,
Germany) was used to accelerate the separation of the aqueous and surfactant-rich phases after the UA-CPE
procedure. A digital pH-meter equipped with a glass-calomel electrode (pH-2005, JP Selecta, Barcelona, Spain)
was used for pH measurements.
3.2. Standard solutions and reagents
All the chemicals were used of analytical grade and were purchased from Sigma (St. Louis, MO, USA) and
Merck (Darmstadt, Germany). Unless otherwise stated, all reagents and solutions were prepared with ultrapure
water (18.2 M Ω cm) obtained from a Labcanco water purification system (Kansas City, KS, USA). The stock
solutions of Cd(II), Pb(II), and Sn(II) of 1000 µ g L −1 were prepared by dissolving appropriate amounts of
CdCl 2 (≥99.0%, w/w), Pb(NO 3 )2 (≥99.0%, w/w), and SnCl 2 × 2H 2 O (≥ 98.0%, w/w) (Sigma) in diluted
HNO 3 or HCl (2.0%, v/v) solutions and completing with ultrapure water. Standard working solutions of the
each ion (0–500 µ g L −1 ) for construction of calibration curves and 20 µ g L −1 for the optimization experiments
were prepared by stepwise dilution of the stock solutions in appropriate ratios. An ionic surfactant solution,
999
¨
ALTUNAY and GURKAN/Turk
J Chem
cetylpyridiniumchloride (CPC) of 2.5% (w/v), was prepared by dissolving an appropriate amount of CPC
(Merck) in water and diluting to 100 mL in a flask. A nonionic surfactant solution, polyoxyethylene sorbitan
monostearate (Tween 60) (Sigma) of 1.0% (v/v), was prepared by diluting 1.0 mL of pure compound in 10 mL of
ethanol and diluting to 100 mL with water. Victoria Pure Blue BO solution (≥95.0% for HPLC assay, VPB + )
of 3.0 × 10 −3 mol L −1 , which is also known as 4-diethylamino)-alpha-4-ethylamino-1-naphthyl)benzylidene)
cyclohexa-2,5-dien-1-ylidene) diethylammonium chloride, was prepared by dissolving an appropriate amount of
the reagent (Sigma) in water and diluting to 100 mL in a flask. The following steps were followed to prepare
Tris-acetate buffer solution at pH 8.5. Dissolve 0.294 g of calcium chloride (CaCl 2 ) (Merck) and 12.11 g of tris
(hydroxymethyl) aminomethane in the water. Adjust the pH with 5 mol L −1 acetic acid and dilute to 1.0 L
with water. All glassware, pipettes, and plastic tubes were kept in 10% (v/v) HNO 3 in an ultrasonic bath for
2 h, and then rinsed five times with water before the start of the experiment.
3.3. Samples and certified reference materials
The cosmetic samples used in this study (shampoo, conditioner, hair dye, lipstick, nail polish, gel, powder,
foundation, eyeliner, and skin cleanser) were bought in a local cosmetics store in Sivas, Turkey. Two certified
reference materials (CRMs), Clay CRM051-050 metals on soil and SRM 1548a typical diet, supplied from
Reference Materials and Proficiency Testing (RTC), were used to validate the accuracy of the proposed method.
4. Conclusions
In the current study, a simple and efficient UA-CPE approach is presented and its analytical utility is demonstrated for the determination of Cd(II), Pb(II), and Sn(II) in cosmetic samples by FAAS. Thus, the nonionic
surfactant Tween 60 as extracting agent was successfully applied for the preconcentration of the selected analytes. The method is more ecofriendly and faster and has a higher sensitivity enhancement factor when
compared with conventional LLE methods. All the results obtained by using the optimized conditions confirm
the practicality and viability of the procedure, providing an important tool for quantification of low levels of
Cd(II), Pb(II), and Sn(II) in cosmetic samples. After the validity was verified by analysis of two CRMs, the
method was successfully applied to the analysis of the analytes in various cosmetic samples. In addition, the
method shows features such as simplicity, quickness, and relatively low cost when compared to sensitive, but
expensive, time consuming, poor precision especially at low concentrations, and complicated techniques such as
ASV, GFAAS, ICP-OES, ICP-MS, CE-, GC-, and/or LC-MS at normal or reverse phase mode.
Acknowledgment
Financial support from the Cumhuriyet University Scientific Research Projects Commission (CUBAP with
projects number of F-445), Sivas, Turkey, is sincerely appreciated.
References
1. Borowska, S.; Brz´
oska, M. M. J. Appl. Toxicol. 2015, 35, 551-572.
2. Darbre, P. D.; Harvey, P. W. J. Appl. Toxicol. 2014, 34, 925-938.
3. Al-Saleh, I.; Al-Enazi, S.; Regul, N. Toxicol. Pharmacol. 2009, 54, 105-113.
4. Kazi, T. G.; Jalbani, N.; Baig, J. A.; Arain, M. B.; Afridi, H. I.; Jamali, M. K.; Shah, A. Q.; Memon, A. N. Food
Chem. 2010, 119, 1313-1317.
1000
¨
ALTUNAY and GURKAN/Turk
J Chem
5. Ullah, H.; Noreen, S.; Rehman, A.; Waseem, A.; Zubair, S.; Adnan, M.; Ahmad, I. Arabian J. Chem. 2013. In
press.
6. Gă
urkan, R.; Altunay, N. Food Chem. 2015, 177, 102-110.
7. Pelit, F. O.; Demirdă
og
en, R. E.; Henden, E. Environ. Monit. Assess. 2013, 185, 9471-9479.
8. Li, Y.; Zhu, Z.; Zheng, H.; Jin, L.; Hu, S. J. Anal. At. Spectrom. 2016. In press.
9. Leao, D. J.; Junior, M. M.; Brandao, G. C.; Ferreira, S. L. Talanta 2016. In press.
10. Zhao, L. J.; Ren, T.; Zhong, R. G. Anal. Lett. 2012, 45, 2467-2481.
11. Jaiswal, A. K.; Das, S.; Kumar, V.; Gupta, M.; Singh, N. Int. J. Eng. Res. 2015, 4, 235-239.
12. Zhu, L.; Xu, L.; Huang, B.; Jia, N.; Tan L.; Yao, S. Electrochim. Acta 2014, 115, 471-477.
13. Welna, M.; Borkowska-Burnecka, J.; Popko, M. Talanta 2015, 144, 953-959.
14. Silva, F. L.; Duarte, T. A.; Melo, L. S.; Ribeiro, L. P.; Gouveia, S. T.; Lopes, G. S.; Matos, W. O. Talanta 2016,
146, 188-194.
15. Djedjibegovic, J.; Larssen, T.; Skrbo, A.; Marjanovi´c, A.; Sober, M. Food Chem. 2012, 131, 469-476.
16. Nascimento, D. S.; Insausti, M.; Band, B. S.; Lemos, S. G. Fuel 2014, 137, 172-178.
17. Sorbo, A.; Turco, A. C.; Di Gregorio, M.; Ciaralli, L. Food Control 2014, 44, 159-165.
18. Zhang, G.; Zhao, Y.; Liu, F.; Ling, J.; Lin, J.; Zhang, C. J. Pharm. Biomed. Anal. 2013, 72, 172-176.
19. Al-Qutob, M. A.; Alatrash, H. M.; Abol-Ola, S. AES Bioflux 2013, 5, 287-293.
20. Citak, D.; Tuzen, M. J. AOAC Int. 2012, 95, 1170-1175.
21. Altunay, N.; Gă
urkan, R.; Orhan, U. Food Addit. Contam. Part A 2015, 32, 1475-1487.
22. Maciel, J. V.; Soares, B. M.; Mandlate, J. S.; Picoloto, R. S.; Bizzi, C. A.; Flores, E. M.; Duarte, F. A. J. Agric.
Food Chem. 2014, 62, 8340-8345.
23. Iwegbue, C. M. A. Regul. Toxicol. Pharm. 2015, 72, 630-638.
24. Seby, F.; Potin-Gautier, M.; Giffaut, E.; Donard, O. F. X. Geochim. Cosmochim. Acta. 2001, 65, 3041-3053.
25. Ulusoy, H. I.; Aksoy, U.; Akcay, M. Eur. Food Res. Technol. 2013, 236, 725-733.
26. Soleimani, F.; Aghaie, H.; Gharib, F. J. Phys. Chem. 2008, 5, 73-78.
27. Altunay, N.; Gă
urkan, R. Food Chem. 2015, 175, 507-515.
28. Gă
urkan, R.; Aksoy, U.; Ulusoy, H. I.; Akácay, M. J. Food Compos. Anal. 2013, 32, 74-82.
29. Dessuy, M. B.; Vale, M. G. R.; Welz, B.; Borges, A. R.; Silva, M. M.; Martelli, P. B. Talanta 2011, 85, 681-686.
30. Duran, C.; Ozdes, D.; Sahin, D.; Bulut, V. N.; Gundogdu, A.; Soylak, M. Microchem. J. 2011, 98, 317-322.
31. Kılınc, E.; Dundar, A.; Ozdemir, S.; Okumus, V. At. Spectrosc. 2013, 34, 78-82.
32. Rosolina, S. M.; Chambers, J. Q.; Lee, C. W.; Xue, Z. L. Anal. Chim. Acta 2015, 893, 25-33.
ă Tă
33. Kalfa, O. M.; Yal¸cınkaya, O.;
urker, A. R. J. Hazard. Mater. 2009, 166, 455-461.
34. Boutakhrit, K.; Crisci, M.; Bolle, F.; Van Loco, J. Food Addit. Contam. Part A 2011, 28, 173-179.
35. Zhang, H.; Rui, Y. K. E-Journal of Chemistry 2011, 8, 782-786.
1001