Tài liệu Microsoft SQL Server 2000 Data Transformation Services- P3 pdf
Bạn đang xem bản rút gọn của tài liệu. Xem và tải ngay bản đầy đủ của tài liệu tại đây (778.07 KB, 50 trang )
Multidimensional Database Management Systems (OLAP)
You can create a multidimensional database schema in a relational database system. There are
also database systems that are specifically designed to hold multidimensional data. These sys-
tems are typically called OLAP servers. Microsoft Analysis Server is an example of an OLAP
server.
The primary unit of data storage in a relational database system is a two-dimensional table. In
an OLAP system, the primary unit of storage is a multidimensional cube. Each cell of a cube
holds the data for the intersection of a particular value for each of the cube’s dimensions.
The actual data storage for an OLAP system can be in a relational database system. Microsoft
Analysis Services gives three data storage options:
• MOLAP—Multidimensional OLAP. Data and calculated aggregations stored in a multi-
dimensional format.
•ROLAP—Relational OLAP. Data and calculated aggregations stored in a relational data-
base.
• HOLAP—Hybrid OLAP. Data stored in a relational database and calculated aggregations
stored in multidimensional format.
Conclusion
The importance of data transformation will continue to grow in the coming years as the useful-
ness of data becomes more apparent. DTS is a powerful and flexible tool for meeting your data
transformation needs.
The next chapter, “Using DTS to Move Data into a Data Mart,” describes the particular chal-
lenge of transforming relational data into a multidimensional structure for business analysis
and OLAP. The rest of the book gives you the details of how to use DTS.
Getting Started with DTS
P
ART I
76
05 0672320118 CH03 11/13/00 4:57 PM Page 76
Please purchase PDF Split-Merge on www.verypdf.com to remove this watermark.
CHAPTER
4
Using DTS to Move Data
into a Data Mart
IN THIS CHAPTER
• Multidimensional Data Modeling 78
• The Fact Table 82
• The Dimension Tables 84
• Loading the Star Schema 88
•Avoiding Updates to Dimension Tables 94
06 0672320118 CH04 11/13/00 5:03 PM Page 77
Please purchase PDF Split-Merge on www.verypdf.com to remove this watermark.
Getting Started with DTS
P
ART I
78
With the introduction of OLAP Services in SQL Server 7.0, Microsoft brought OLAP tools to
a mass audience. This process continued in SQL Server 2000 with the upgraded OLAP func-
tionality and the new data mining tools in Analysis Services.
One of the most important uses for DTS is to prepare data to be used for OLAP and data
mining.
It’s easy to open the Analysis Manager and make a cube from FoodMart 2000, the sample
database that is installed with Analysis Services. It’s easy because FoodMart has a star schema
design, the logical structure for OLAP.
It’s a lot harder when you have to use the Analysis Manager with data from a typical normal-
ized database. The tables in a relational database present data in a two-dimensional view. These
two-dimensional structures must be transformed into multidimensional structures. The star
schema is the logical tool to use for this task.
The goal of this chapter is to give you an introduction to multidimensional modeling so that
you can use DTS to get your data ready for OLAP and data mining.
A full treatment of multidimensional data modeling is beyond the scope of this book.
Most of what I wrote about the topic in Microsoft OLAP Unleashed (Sams, 1999) is
still relevant. I also recommend The Data Warehouse Lifecycle Toolkit by Ralph
Kimball, Laura Reeves, Margy Ross, and Warren Thornthwaite.
NOTE
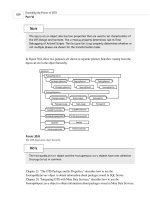
Multidimensional Data Modeling
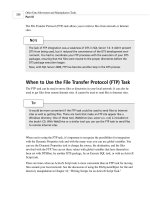
The star schema receives its name from its appearance. It has several tables radiating out from
a central core table, as shown in Figure 4.1.
The fact table is at the core of the star schema. This table stores the actual data that is analyzed
in OLAP. Here are the kinds of facts you could put in a fact table:
• The total number of items sold
• The dollar amount of the sale
• The profit on the item sold
• The number of times a user clicked on an Internet ad
• The length of time it took to return a record from the database
• The number of minutes taken for an activity
06 0672320118 CH04 11/13/00 5:03 PM Page 78
Please purchase PDF Split-Merge on www.verypdf.com to remove this watermark.
• The account balance
• The number of days the item was on the shelf
• The number of units produced
Using DTS to Move Data into a Data Mart
C
HAPTER 4
4
U
SING
DTS
TO
M
OVE
D
ATA INTO
A
D
ATA
M
ART
79
FIGURE 4.1
The star schema of the Sales cube from the Food Mart 2000 sample database, as shown in the Analysis Manager’s
Cube Editor.
The tables at the points of the star are called dimension tables. These tables provide all the dif-
ferent perspectives from which the facts are going to be viewed. Each dimension table will
become one or more dimensions in the OLAP cube. Here are some possible dimension tables:
•Time
•Product
• Supplier
•Store Location
• Customer Identity
• Customer Age
• Customer Location
• Customer Demographic
06 0672320118 CH04 11/13/00 5:03 PM Page 79
Please purchase PDF Split-Merge on www.verypdf.com to remove this watermark.
• Household Identity
•Promotion
•Status
• Employee
Differences Between Relational Modeling and
Multidimensional Modeling
There are several differences between data modeling as it’s normally applied in relational data-
bases and the special multidimensional data modeling that prepares data for OLAP analysis.
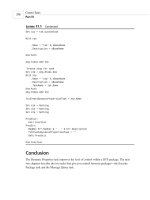
Figure 4.2 shows a database diagram of the sample Northwind database, which has a typical
relational normalized schema.
Getting Started with DTS
P
ART I
80
FIGURE 4.2
A typical relational normalized schema—the Northwind sample database.
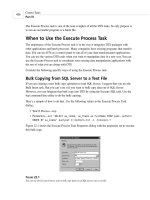
Figure 4.3 shows a diagram of a database that has a star schema. This star schema database
was created by reorganizing the Northwind database. Both databases contain the same infor-
mation.
06 0672320118 CH04 11/13/00 5:03 PM Page 80
Please purchase PDF Split-Merge on www.verypdf.com to remove this watermark.
FIGURE 4.3
A typical star schema, created by reorganizing the Northwind database.
Star schema modeling doesn’t follow the normal rules of data modeling. Here are some of the
differences:
• Relational models can be very complex. The proper application of the rules of normal-
ization can result in a schema with hundreds of tables that have long chains of relation-
ships between them.
Star schemas are very simple. In the basic star schema design, there are no chains of
relationships. Each of the dimension tables has a direct relationship with the fact table
(primary key to foreign key).
• The same data can be modeled in many different ways using relational modeling.
Normal data modeling is quite flexible.
The star schema has a rigid structure. It must be rigid because the tables, relationships,
and fields in a star schema all have a particular mapping to the multidimensional struc-
ture of an OLAP cube.
• One of the goals of relational modeling is to conform to the rules of normalization. In a
normalized database, each data value is stored only once.
Star schemas are radically denormalized. The dimension tables have a high number of
repeated values in their fields.
Using DTS to Move Data into a Data Mart
C
HAPTER 4
4
U
SING
DTS
TO
M
OVE
D
ATA INTO
A
D
ATA
M
ART
81
06 0672320118 CH04 11/13/00 5:03 PM Page 81
Please purchase PDF Split-Merge on www.verypdf.com to remove this watermark.
•Standard relational models are optimized for On Line Transaction Processing. OLTP
needs the ability to efficiently update data. This is provided in a normalized database that
has each value stored only once.
Star schemas are optimized for reporting, OLAP, and data mining. Efficient data retrieval
requires a minimum number of joins. This is provided with the simple structure of rela-
tionships in a star schema, where each dimension table is only a single join away from
the fact table.
The rules for multidimensional modeling are different because the goals are different.
The goal of standard relational modeling is to provide a database that is optimized for efficient
data modification. The goal of multidimensional modeling is to provide a database optimized
for data retrieval.
The Fact Table
The fact table is the heart of the star schema. This one table usually contains 90% to 99.9% of
the space used by the entire star because it holds the records of the individual events that are
stored in the star schema.
New records are added to fact tables daily, weekly, or hourly. You might add a new record to
the Sales Fact table for each line item of each sale during the previous day.
Fact table records are never updated unless a mistake is being corrected or a schema change is
being made. Fact table records are never deleted except when old records are being archived.
A fact table has the following kinds of fields:
• Measures—The fields containing the facts in the fact table. These fields are nearly
always numeric.
•Dimension Keys—Foreign keys to each of the dimension tables.
• Source System Identifier—Field that identifies the source system of the record when the
fact table is loaded from multiple sources.
• Source System Key—The key value that identifies the fact table record in the source
system.
• Data Lineage Fields—One or more fields that identify how and when this record was
transformed and loaded into the fact table.
The fact table usually does not have a separate field for a primary key. The primary key is a
composite of all the foreign keys.
Getting Started with DTS
P
ART I
82
06 0672320118 CH04 11/13/00 5:03 PM Page 82
Please purchase PDF Split-Merge on www.verypdf.com to remove this watermark.
Choosing the Measures
Some of the fields you choose as measures in your star schema are obvious. If you want to
build a star that examines sales data, you will want to include Sale Price as one of your mea-
sures, and this field will probably be evident in your source data.
After you have chosen the obvious measures for your star, you can look for others. Keep the
following tips in mind for finding other fields to use as measures:
• Consider other numeric fields in the same table as the measures you have already found.
• Consider numeric fields in related tables.
• Look at combinations of numeric fields that could be used to calculate additional mea-
sures.
•Any field can be used to create a counted measure. Use the
COUNT aggregate function and
a GROUP BY clause in a SQL query.
• Date fields can be used as measures if they are used with
MAX or MIN aggregation in your
cube. Date fields can also be used to create calculated measures, such as the difference
between two dates.
• Consider averages and other calculated values that are non-additive. Include all the val-
ues as facts that are needed to calculate these non-additive values.
• Consider including additional values so that semi-additive measures can be turned into
calculated measures.
Choosing the Level of Summarization for the Measures
Measures can be used either with the same level of detail as in the source data or with some
degree of summarization. Maintaining the greatest possible level of detail is critical in building
Using DTS to Move Data into a Data Mart
C
HAPTER 4
4
U
SING
DTS
TO
M
OVE
D
ATA INTO
A
D
ATA
M
ART
83
I believe that the Source System Identifier and the Source System Key should be con-
sidered standard elements in a fact table. These fields make it possible for fact table
records to be tied back to source system records. It’s important to do that for auditing
purposes. It also makes it possible to use the new drillthrough feature in SQL Server
2000 Analysis Services.
I also believe that a typical fact table should have data lineage fields so that the
transformation history of the record can be positively identified.
NOTE
06 0672320118 CH04 11/13/00 5:03 PM Page 83
Please purchase PDF Split-Merge on www.verypdf.com to remove this watermark.
a flexible OLAP system. Summarizing data is sometimes necessary to save storage space, but
consider all the drawbacks:
• The users will not be able to drill down to the lowest level of the data.
• The connection between the star schema data and the source data is weakened. If one
record in the star schema summarizes 15 records in the source data, it is almost impossi-
ble to make a direct connection back to those source records.
• The potential to browse from particular dimensions can be lost. If sales totals are aggre-
gated in a star schema for a particular product per day, there will be no possibility of
browsing along a customer dimension.
• Merging or joint querying of separate star schemas is much easier if the data is kept at
the lowest level of detail. Summarized data is much more likely to lead to independent
data marts that cannot be analyzed together.
• The possibilities for data mining are reduced.
Summarizing data in a star schema makes the most sense for historical data. After a few years,
the detail level of data often becomes much less frequently used. Old unused data can interfere
with efficient access to current data. Move the detailed historical data into an offline storage
area, where it’s available for occasional use. Create a summarized form of the historical data
for continued online use.
A cube created with summarized historical data can be joined together with cubes based on
current data. You join cubes together by creating a virtual cube. As long as two or more cubes
have common dimensions, they can be joined together even if they have a different degree of
summarization.
The Dimension Tables
By themselves, the facts in a fact table have little value. The dimension tables provide the vari-
ety of perspectives from which the facts become interesting.
Compared to the fact table, the dimension tables are nearly always very small. For example,
there could be a Sales data mart with the following numbers of records in the tables:
•Store Dimension—One record for each store in this chain—14 records.
•Promotion Dimension—One record for each different type of promotion—45 records.
•Time Dimension—One record for each day over a two-year period—730 records.
• Employee Dimension—One record for each employee—300 records.
•Product Dimension—One record for each product—31,000 records.
• Customer Dimension—One record for each customer—125,000 records.
Getting Started with DTS
P
ART I
84
06 0672320118 CH04 11/13/00 5:03 PM Page 84
Please purchase PDF Split-Merge on www.verypdf.com to remove this watermark.
• Combined total for all of these dimension records—157,089 records.
• Sales Fact Table—One record for each line item of each sale over a two-year period—
60,000,000 records.
While the fact table always has more records being added to it, the dimension tables are rela-
tively stable. Some of them, like the time dimension, are created and then rarely changed.
Others, such as the employee and customer dimension, are slowly growing.
One of the most important goals of star schema design is to minimize or eliminate the need for
updating dimension tables.
Dimension tables have the following kinds of fields:
•Primary Key—The field that uniquely identifies each record and also joins the dimension
table to the fact table.
•Level Members—Fields that hold the members for the levels of each of the hierarchies in
the dimension.
•Attributes—Fields that contain business information about a record but are not used as
levels in a hierarchy.
• Subordinate Dimension Keys—Foreign key fields to the current related record in subor-
dinate dimension tables.
• Source System Identifier—Field that identifies the source system of the dimension
record when the dimension table is loaded from multiple sources.
• Source System Key—The key value that identifies the dimension table record in the
source system.
• Data Lineage Fields—One or more fields that identify how and when this record was
transformed and loaded into the dimension table.
The Primary Key in a Dimension Table
The primary key of a dimension table should be a single field with an integer data type.
Using DTS to Move Data into a Data Mart
C
HAPTER 4
4
U
SING
DTS
TO
M
OVE
D
ATA INTO
A
D
ATA
M
ART
85
Smallint (2-byte signed) or tinyint (1-byte unsigned) fields are often adequate for the
dimension table primary keys. Generally, you will not be concerned about the size of
your dimension tables, but using these smaller values can significantly reduce the size
of the fact tables, which can become very large. Smaller key fields also make indexes
work more efficiently. But don’t use smallint or tinyint unless you are absolutely cer-
tain that it will be adequate now and in the future.
TIP
06 0672320118 CH04 11/13/00 5:03 PM Page 85
Please purchase PDF Split-Merge on www.verypdf.com to remove this watermark.
Levels of the Dimension Hierarchy
The levels of the dimension hierarchy are modeled in the star schema with individual fields in
the dimension tables. The names of these fields can be mapped to the levels of the dimension’s
hierarchies. The data values in these fields are the members of the levels in the hierarchies of a
dimension.
Table 4.1 shows what data looks like in the hierarchy fields of a customer dimension table.
This example is taken from the FoodMart 2000 sample database. Country, State Province, City,
and Name are levels of the one hierarchy in the Customer dimension. USA, CA, Altadena, and
Susan Wilson are all examples of members. Arcadia is one of the members of the City level in
the single hierarchy of the Customer dimension. Note all the repeated values in the fields at the
higher levels of the hierarchy.
T
ABLE 4.1 Sample Data in the Product Dimension
State
Country Province City Name
USA CA Altadena Susan Wilson
USA CA Altadena Michael Winningham
USA CA Altadena Daniel Wolter
USA CA Altadena Velma Wright
USA CA Altadena Gail Xu
USA CA Arcadia Christine Abernathy
USA CA Arcadia Roberta Amidei
USA CA Arcadia Van Armstrong
One dimension table can have more than one dimension hierarchy stored in it. Dimensions
often are viewed from a variety of different perspectives. Rather than choose one hierarchy
over another, it is usually best to include multiple hierarchies. The fields containing the levels
of multiple hierarchies in a dimension can be distinguished by using compound names such as
Sales District, Marketing District, Sales Region, and Marketing Region.
Attributes of the Dimension
Attribute fields give additional information about the members of a dimension. These fields are
not part of the hierarchical structure of a dimension.
The attributes in a product dimension could include fields such as Size, Weight, Package Type,
Color, Units Per Case, Height, and Width. Attributes most often use one of the string data
types, but they can also use numeric, datetime, or Boolean data types.
Getting Started with DTS
P
ART I
86
06 0672320118 CH04 11/13/00 5:03 PM Page 86
Please purchase PDF Split-Merge on www.verypdf.com to remove this watermark.
Attributes usually apply to members at the lowest level of the dimension, but they can be used
at higher levels. For example, if there is a geographic dimension where District is one of the
levels, District Population could be included as an attribute for that level of the dimension.
Rich, detailed attributes add value to the star schema. Each attribute provides a new perspec-
tive from which the cube can be browsed.
Here are some of the attribute fields in the Customer dimension of the FoodMart 2000 sample
database:
•Total Children
• Number Children at Home
• Marital Status
• Education
•Yearly Income
• Occupation
• Member Card
• Gender
The Time Dimension
Almost every star schema has a time dimension. By definition, data warehouse information is
gathered with respect to particular periods of time. The data reflects the state of reality at vari-
ous times in history.
A time dimension often has more than one hierarchy built in to it because time can be aggre-
gated in a variety of ways. The lowest level of the time hierarchy varies greatly. It could be the
day, the shift, the hour, or even the minute. The lower levels would be included only if there
were some valid reason to query at those levels of detail.
Significant attributes for a time dimension could include the following:
•A Special Day field, which could have the names of various holidays and other days of
significance for an organization.
•A Selling Season field, which could have a particular company’s self-defined annual
sales periods.
• Boolean fields indicating special types of days, such as Is Weekend, Is Holiday, Is
School Year, Is First Day Of Month, Is Last Day Of Month, and so on.
Using DTS to Move Data into a Data Mart
C
HAPTER 4
4
U
SING
DTS
TO
M
OVE
D
ATA INTO
A
D
ATA
M
ART
87
06 0672320118 CH04 11/13/00 5:03 PM Page 87
Please purchase PDF Split-Merge on www.verypdf.com to remove this watermark.
Subordinate Dimension Keys
Subordinate dimensions are dimensions that have been split off from a primary dimension for
the purpose of avoiding dimension table updates. This strategy is described in the last section
of this chapter, “Avoiding Updates to Dimension Tables.”
If you have a Customer dimension and a subordinate dimension called Customer
Demographic, you would include a subordinate dimension key field in the Customer table.
This field would hold the foreign key to the Customer Demographic record that currently
describes the customer.
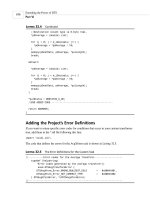
Loading the Star Schema
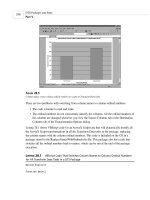
A DTS package built for a nightly data mart load could have the following elements:
1. Tasks that load data from the sources into the staging area.
2. Tasks that load and update the dimension tables.
3. A task that loads the fact table.
4. Tasks that use the data that has just been loaded—to process cubes and mining models,
to generate predicted data values, and to feed information back to the operational systems.
A package that loads a data mart is shown in Figure 4.4.
Getting Started with DTS
P
ART I
88
FIGURE 4.4
A DTS package that loads a data mart.
06 0672320118 CH04 11/13/00 5:03 PM Page 88
Please purchase PDF Split-Merge on www.verypdf.com to remove this watermark.
Loading Data into a Staging Area
A staging area is a set of tables that are used to store data temporarily during a data load.
Staging areas are especially useful if the source data is spread out over diverse sources. After
you have loaded the staging area, it’s easier to handle the data because it’s all in one place.
Data often needs to be cleansed as it’s loaded into a data mart. Data cleansing can involve the
following:
•Verifying the accuracy of the data.
• Correcting, flagging, or removing incorrect records.
• Homogenizing data that is in different formats.
• Replacing codes with meaningful data values.
•Filling in missing data from lookup tables.
Developers have different ideas about where data cleansing fits in the load process. It could be
done at any of the following times:
•As the data is loaded into the staging area.
•In the staging area, with the data being moved from one table to another, or with queries
that directly update the data in a table.
•As the data is moved from the staging area into the data mart.
Using DTS to Move Data into a Data Mart
C
HAPTER 4
4
U
SING
DTS
TO
M
OVE
D
ATA INTO
A
D
ATA
M
ART
89
I prefer not to use the first strategy. I like to copy data directly into the staging area
so that it is as similar to the source data as possible. If there is some question about
the data values, I can examine the data in the staging area as if it’s the same as the
source data.
In complex data cleansing situations, I cleanse it in steps in the staging area.
I prefer to do all the data cleansing as the data is moved from the staging area into
the data mart. I like to change the data in just one step so that everything that hap-
pens to the data can be examined by looking at the one step.
CAUTION
You can use the following DTS tasks to load data into a staging area:
• The FTP task to retrieve remote text files.
• The Bulk Insert task to load text files into SQL Server.
• The Parallel Data Pump task for hierarchical rowsets.
06 0672320118 CH04 11/13/00 5:03 PM Page 89
Please purchase PDF Split-Merge on www.verypdf.com to remove this watermark.
• The Execute SQL task when the data is being moved from one relational database to
another.
• The Transform Data task, for situations that require data cleansing or when none of the
other tasks are appropriate.
Loading the Dimension Tables
The dimension tables have to be loaded before the fact tables because there might be new
dimension records that need to have key values assigned before they can be referenced in the
fact table.
Getting Started with DTS
P
ART I
90
If possible, dimension tables should be preloaded with records. This is often done
with a Time dimension that has one record for each day. It could also be done for a
customer demographic dimension that has a limited number of combinations of pos-
sible values.
NOTE
It’s easier and more efficient if your source systems can give you the new records for the
dimension tables. It’s sometimes possible to generate a list of new products or new customers,
for example.
In many situations, you have to compare the data currently in your dimension table with the
data in the source to determine which of the records are new. You can do this by searching for
NULL values on the inner table of an outer join. The outer join gives you all the fields from the
source table, with the matching records from the dimension table. You search for NULL values
in the dimension table, which will limit the results to the new records that need to be added to
the dimension.
I prefer to include a field in all my dimension tables that specifies the source system and one
or more fields that contain the key values for the records in the source system. If I have these
fields in my dimension table, it’s simple to write a query that will retrieve all the new dimen-
sion records, using the following pattern:
SELECT src.ProductFamily,
src.ProductName,
src.ProductID,
3 As SourceSystemID
FROM Products src
LEFT OUTER JOIN dimProduct dim
ON src.ProductID = dim.ProductID
AND dim.SourceSystemID = 3
WHERE dim.ProductID IS NULL
06 0672320118 CH04 11/13/00 5:03 PM Page 90
Please purchase PDF Split-Merge on www.verypdf.com to remove this watermark.
The query that retrieves the new records for the dimension table can be used as the source
query for a Transform Data task. It could also be used in an Execute SQL task as a part of an
INSERT INTO command:
INSERT INTO dimProductID
(
ProductFamily,
ProductName,
ProductID,
SourceystemID
)
SELECT src.ProductFamily,
src.ProductName,
src.ProductID,
3 As SourceSystemID
FROM Products src
LEFT OUTER JOIN dimProduct dim
ON src.ProductID = dim.ProductID
AND dim.SourceSystemID = 3
WHERE dim.ProductID IS NULL
There can be many more complications. You may also want to do one or more of the
following:
• Add joins to lookup tables to fill in missing values or homogenize inconsistent data.
•Cleanse the data by writing transformation scripts.
•Create a natural key field in situations where there is no reliable source key. A natural
key is a concatenation of all the fields in a record that are needed to guarantee unique
records.
• Determine whether or not a record is new by using a complex algorithm in a transforma-
tion script.
Using DTS to Move Data into a Data Mart
C
HAPTER 4
4
U
SING
DTS
TO
M
OVE
D
ATA INTO
A
D
ATA
M
ART
91
It’s important to include a check for the correct SourceSystemID in the join clause. If
the same ProductID is used in different systems for different products, this query will
ensure that both of those records will be entered into the dimension table.
TIP
06 0672320118 CH04 11/13/00 5:03 PM Page 91
Please purchase PDF Split-Merge on www.verypdf.com to remove this watermark.
There are a couple of possibilities for storing the data lineage:
•You can use the built-in DTS lineage variables. These variables are described in Chapter
29, “Integrating DTS with Meta Data Services.”
•You can use a foreign key that references a lineage table, where the table stores all the
needed data lineage information. This solution would normally take up less space.
Updating the Subordinate Dimension Keys
My strategy for data mart design avoids the updating of dimension tables except for one type
of field—the subordinate dimension keys. You update these keys after all the dimensions have
been loaded, but before the fact table is loaded.
For example, if the import contains information about customers who have new addresses, the
CurrentAddressKey field in the Customer dimension table would have to be updated to the
appropriate value for the new address. The CustomerAddress dimension would have the appro-
priate source key fields to join to the source record so that the correct key value could be
found. The Customer dimension would have the appropriate source key fields to join to the
source record so that the proper customer could be identified. A data modification Lookup
query or a Data Driven Query task could be used to perform the update.
Loading the Fact Table
After the dimension tables have all been loaded and updated, the fact table is loaded.
The query used in the fact table load usually involves a join between the source data table and
all of the primary (but not the subordinate) dimension tables. The values for the measures and
the source key fields are filled from fields in the source table. The values for the dimension
keys are filled with the Primary Keys and the subordinate dimension keys in the dimension
tables.
If you had a star schema with four dimension tables, one of which was a subordinate dimen-
sion, the fact table query could look like this:
SELECT dimP.ProductKey,
dimC.CustomerKey,
dimC.CurrentAddressKey,
dimT.TimeKey,
src.SalesID,
3 As SourceSystemID
src.SalesCount,
src.SalesAmount
FROM Sales src
INNER JOIN dimProduct dimP
Getting Started with DTS
P
ART I
92
06 0672320118 CH04 11/13/00 5:03 PM Page 92
Please purchase PDF Split-Merge on www.verypdf.com to remove this watermark.
ON src.ProductID = dimP.ProductID
AND dim.SourceSystemID = 3
INNER JOIN dimCustomer dimC
ON src.CustomerID = dimC.CustomerID
AND dim.SourceSystemID = 3
INNER JOIN dimTime dimT
ON dimT.TheDate = src.SalesDate
AND dim.SourceSystemID = 3
As with loading the dimension tables, this query can be used as the source query for a transfor-
mation task or with an INSERT INTO statement in an Execute SQL task.
It’s often easier to identify the new fact table records than the new dimension table records in
the source data. Fact table records often come from data that is handled in batches or can be
identified by a particular date.
As with dimension table records, though, sometimes filtering can’t help you determine which
records are new and which have been already entered into a fact table. In those situations, you
can use an outer join with a search for the null values on the inner table. That outer join could
significantly hurt performance if your source data tables and your fact table are large.
There is an alternative strategy for loading a fact table when there are too many large tables
involved in the load. Even though this alternative involves more steps, it can be quicker when
the database server does not have adequate memory:
1. Modify the fact table’s primary source table in the data staging area by adding fields for
all of the dimension keys that are in the fact table.
2. Create a series of Execute SQL or Transform Data tasks, each of which updates the
source table by inserting the proper dimension key value. Each of these tasks will have a
query that joins from the source table to one of the dimension tables.
3. After the record has been updated with all the keys, insert the record into the fact table
without joining to any of the dimension tables. If you need to do an outer join between
the fact table and the source table, you do it in this step.
Using the Data
After the star schema is loaded, the DTS package can continue with tasks that make use of the
new data:
•You can use the Analysis Services Processing task to process your cubes and your min-
ing models so that the new data is reflected in these analytical tools.
•You can use the Data Mining Prediction Query task with the new data to predict signifi-
cant business information, such as which additional product you could most likely sell to
the new customers you have just loaded into your data mart.
Using DTS to Move Data into a Data Mart
C
HAPTER 4
4
U
SING
DTS
TO
M
OVE
D
ATA INTO
A
D
ATA
M
ART
93
06 0672320118 CH04 11/13/00 5:03 PM Page 93
Please purchase PDF Split-Merge on www.verypdf.com to remove this watermark.
• Local cube files and reports could be created and emailed or sent by FTP to the appropri-
ate individuals.
• The output of the prediction query could be used to update information in the OLTP sys-
tem.
Avoiding Updates to Dimension Tables
I believe that one of the most significant design goals in setting up a star schema is avoiding
updates to dimension tables.
Many people have described three options for handling changes to records in dimension tables:
1. Change the record.
2. Add a new record with the new values.
3. Add new fields so that a single record can have both the old and new values.
Each of these options is of value in limited situations, but none of them is adequate for normal
changes in dimension records.
Consider the simple problem of a customer moving from Minneapolis to St. Paul. Assume that,
as with the FoodMart 2000 sample database, you have been using the customer’s address infor-
mation as the single hierarchy of the Customer dimension. Here are the problems with each of
the strategies for changing dimensions:
• If you change the Customer dimension record to reflect the new address, you will invali-
date historical browsing of the information. If the customer bought something last year,
that purchase should be viewed with purchases made by people in Minneapolis, but it
will now appear as if a person living in St. Paul made the purchase.
• If you add a new record, you will take care of the first problem, but then you won’t be
able to easily connect the identities of your customers across a time period. If you query
your data mart for your best customers in the past year, the moving customers will not be
treated fairly because their purchases will be split between the two separate records. You
can work around this problem in Analysis Services by using calculated sets, but in my
opinion, the administrative problem in implementing the workaround is too great.
• The worst solution is to add new fields to keep track of new addresses and old addresses.
The data structure of the cube would become far too complex—and people are going to
keep on moving. The only time it’s practical to add new fields to track dimension change
is when there is a massive one-time change, such as a realignment of sales regions.
The only effective way to handle changing dimensions is to avoid them. You can avoid the
need to change dimensions by splitting off potentially changing fields into subordinate dimen-
sions.
Getting Started with DTS
P
ART I
94
06 0672320118 CH04 11/13/00 5:03 PM Page 94
Please purchase PDF Split-Merge on www.verypdf.com to remove this watermark.
Subordinate dimensions are used for business analysis like any other dimension. Each subordi-
nate dimension has a key value in the fact table, just like a regular dimension.
The difference between subordinate and regular dimensions is in how they are used to load the
fact table. The fact table’s dimension keys to subordinate dimensions are loaded from the regu-
lar dimension that is related to that subordinate dimension.
The customer dimension provides one of the best illustrations of this strategy. A customer
dimension could have several subordinate dimensions:
• CustomerLocation—Information about the country, region, state, and city where a cus-
tomer lives.
• CustomerAge—The customer’s age.
• CustomerLongevity—The number of years and months since the customer’s first pur-
chase.
• CustomerValue—A classification of the customer based on how valuable that customer
is to the company.
• CustomerCategory—The demographic category that describes the customer.
The primary customer dimension could be called CustomerIdentity to distinguish it from all
the subordinate dimension tables.
The CustomerIdentity dimension would have the following fields:
• CustomerIdentityKey
• CurrentCustomerLocationKey
•BirthDate
•FirstPurchaseDate
• CurrentCustomerValueKey
• CurrentCustomerCategoryKey
• CustomerSourceID
• SourceSystemID
•LineageKey
The portion of a star schema containing the customer dimension tables is shown in Figure 4.5.
When loading the fact table, the CustomerIdentityKey, CurrentCustomerLocationKey,
CurrentCustomerValueKey, and CurrentCustomerCategoryKey fields would be used to fill the
dimension key values.
Using DTS to Move Data into a Data Mart
C
HAPTER 4
4
U
SING
DTS
TO
M
OVE
D
ATA INTO
A
D
ATA
M
ART
95
06 0672320118 CH04 11/13/00 5:03 PM Page 95
Please purchase PDF Split-Merge on www.verypdf.com to remove this watermark.
FIGURE 4.5
The customer dimension tables in a star schema.
I recommend using a Primary Key for the CustomerAge and CustomerLongevity tables that
represents the actual length of time in years or months. You can then load the fact table by
using the DATEDIFF function with the BirthDate and FirstPurchaseDate fields in the
CustomerIdentity table.
The data in a CustomerAge table is shown in Table 4.2. The actual age is used for the Primary
Key, so the dimension key value to be entered into the fact table is always
DATEDIFF(‘y’,
PurchaseDate, BirthDate).A tinyint field can be used for this key. The
CustomerLongevityKey would probably use the number of months as the primary key value.
TABLE 4.2 Sample Data for a CustomerAge Table
AgePK MinorAgeRange MajorAgeRange
00-4 0-17
10-4 0-17
20-4 0-17
30-4 0-17
40-4 0-17
55-9 0-17
Getting Started with DTS
P
ART I
96
06 0672320118 CH04 11/13/00 5:03 PM Page 96
Please purchase PDF Split-Merge on www.verypdf.com to remove this watermark.
65-9 0-17
75-9 0-17
85-9 0-17
95-9 0-17
10 10-14 0-17
11 10-14 0-17
12 10-14 0-17
13 10-14 0-17
14 10-14 0-17
15 15-17 0-17
16 15-17 0-17
17 15-17 0-17
18 18-20 18-24
You can find the current description of a customer by joining the CustomerIdentity dimension
to its subordinate dimensions. Whenever the customer makes a purchase, the current value of
all the customer characteristics is entered into the fact table. If you examine the customer’s
purchases over a period of time, they will all be properly aggregated together. If you analyze
the customers by any of the subordinate dimensions, the value in effect at the time of the pur-
chase will always appear in the data.
Using DTS to Move Data into a Data Mart
C
HAPTER 4
4
U
SING
DTS
TO
M
OVE
D
ATA INTO
A
D
ATA
M
ART
97
TABLE 4.2 Continued
AgePK MinorAgeRange MajorAgeRange
There is one obvious drawback to the strategy of using subordinate dimensions—
there get to be a lot of dimensions!
Analysis Services in SQL Server 2000 can handle up to 128 dimensions in a cube. If you
want to do business analysis on a particular dimension, the key business need is to
see that the analysis can be done accurately.
The risk in adding more dimensions is that you increase the time required for process-
ing the cubes. You have to judge whether you have adequate time for cube process-
ing based on available hardware, the amount of data in the cubes, the amount of
time available for processing, your strategy in designing aggregations, and your strat-
egy in choosing processing options.
Storage space can be conserved by proper use of smallint and tinyint fields.
NOTE
06 0672320118 CH04 11/13/00 5:03 PM Page 97
Please purchase PDF Split-Merge on www.verypdf.com to remove this watermark.
Here is what you have to do to create subordinate dimensions:
1. Identify all the fields in a dimension that could possibly change.
2. Divide these potentially changing fields into those that are going to be used for business
analysis and those that are not.
3. Choose and implement one of the strategies for the fields that are not going to be used
for business analysis.
4. Divide the fields being used for business analysis into logical groupings to create subor-
dinate dimensions. Values based on dates, such as birth dates, often work best in their
own dimension. Values that are part of a common hierarchy should be placed in the same
dimension.
5. It’s all right if the original dimension has all of its hierarchy and attribute fields removed.
The original dimension still has value in
TOP COUNT, BOTTOM COUNT, and DISTINCT
COUNT analysis.
6. Add the subordinate key fields in the original dimension to hold the current value for the
record in each of the subordinate dimensions.
7. Add dimension keys for all the subordinate dimensions into the fact table.
8. Modify the import process to update the subordinate keys in the dimension tables when
necessary and to load all the subordinate keys into the fact table.
You have three options for fields that are not going to be used for business analysis. I prefer
the third option if it is practical in that particular information system. All of these options pro-
vide full flexibility for business analysis, though:
1. You can leave them in the primary dimension table and change them whenever you want.
2. You can move them into a separate information table that has a one-to-one relationship
with the dimension table. This information table is not really a part of the star schema.
3. You can eliminate them from the data mart and retrieve that information by joining on
the key value to the source system.
Conclusion
DTS is a great tool for loading a data mart. This chapter has given you some ideas about what
you need to do to accomplish that task.
The next chapters discuss the details of setting up DTS connections and the process of creating
transformation tasks.
Getting Started with DTS
P
ART I
98
06 0672320118 CH04 11/13/00 5:03 PM Page 98
Please purchase PDF Split-Merge on www.verypdf.com to remove this watermark.
IN THIS PART
5 DTS Connections 101
6 The Transform Data Task 125
7Writing ActiveX Scripts for a Transform Data
Task 179
8 The Data Driven Query Task 213
9 The Multiphase Data Pump 227
10 The Parallel Data Pump Task 247
DTS Connections and the Data
Transformation Tasks
PART
II
07 0672320118 PT2 11/13/00 4:56 PM Page 99
Please purchase PDF Split-Merge on www.verypdf.com to remove this watermark.
07 0672320118 PT2 11/13/00 4:56 PM Page 100
Please purchase PDF Split-Merge on www.verypdf.com to remove this watermark.