Tài liệu HPLC for Pharmaceutical Scientists 2007 (Part 21) ppt
Bạn đang xem bản rút gọn của tài liệu. Xem và tải ngay bản đầy đủ của tài liệu tại đây (754.22 KB, 49 trang )
21
TRENDS IN PREP
ARATIVE HPLC
Ernst Kuesters
21.1 INTRODUCTION
Directly from its beginning—now 100 years ago, when Michail Tswett devel-
oped the principles [1, 2] with the isolation of chlorophyll—chromatography
has always been a preparative technology, and its value in producing com-
pounds of high purity cannot be overemphasized. It was Paul Karrer [3] who
stated very early “. . . it would be a mistake to believe that a preparation puri-
fied by crystallization should be purer than one obtained from chromatographic
analysis. In all recent investigations chromatographic purification widely sur-
passed that of crystallization.” and Leslie Ettre, although not distinguishing
between analytical and preparative separations, denoted chromatography as
“the separation technique of the 20th century” [4]. From a historical point of
view, the beginnings of preparative isolation of natural compounds were cum-
bersome. For example, it is reported [5] that six years of work and processing
of 30 tons of strawberries was needed to finally obtain 35mL of an oil, the
essence of the fruit. This situation changed dramatically in the 1960s with the
theoretical understanding of the chromatographic process, the development
of high-performance liquid chromatography, and the synthesis of highly selec-
tive stationary phases. As a result of these improvements, the isolation of
natural compounds with preparative chromatography on production scale
(e.g., drug substances from fermentation processes) is still state of the art,even
after 100 years.
Today, preparative HPLC has also become a powerful technology in phar-
maceutical development and production either for isolation of impurities, for
937
HPLC for Pharmaceutical Scientists, Edited by Yuri Kazakevich and Rosario LoBrutto
Copyright © 2007 by John Wiley & Sons, Inc.
chromatographic purifications, or as part of a scale-up process and subse-
quently has been reviewed in a lot of monographs [6–10].
The term prepara-
tive amount thus covers the range from milligram quantities (amounts for
structure elucidation, analytical characterization, toxicology, or reference
material) to large-scale production of tons of intermediates and drug sub-
stances. The separations therefore can be performed on all types of columns,
starting from analytical ones up to production scale columns with 1-m i.d and
several meters in length. Typical applications are summarized in Table 21-1.
The success of preparative HPLC on a production scale has been made pos-
sible because of significant improvements made in several areas like (i) column
technology (today, mainly compressed columns are used), (ii) packing mate-
rials (pressure stable spherical particles with high homogeneity, either non-
chiral or chiral), and (iii) the understanding of the nonlinear process in
preparative HPLC (overloaded conditions) which resulted in new methods to
determine the adsorption isotherms and which consequently led to new con-
cepts like displacement chromatography and simulated moving bed (SMB)
chromatography, where the knowledge of such adsorption isotherms is a pre-
requisite for the design of the corresponding separation process.
The aim of this chapter is to highlight current developments in these various
fields of preparative HPLC, with particular emphasis on applications that have
been developed at Chemical & Analytical Development at Novartis Pharma
AG. Drug substance purifications from biological and synthetic sources are
presented, along with the separation of chiral and/or achiral molecules on
chiral stationary phases and typical isolations of by-products. Special attention
is given to the determination of adsorption isotherms and their interplay with
respect to the layout of chromatographic processes as well as the choice of
938 TRENDS IN PREPARATIVE HPLC
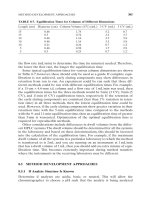
TABLE 21-1. Order of Magnitude and Purpose of Purified Amounts Obtained from
Preparative Chromatography
Amount of
Stationary Amount of
Column Type I.D. (mm) Purpose Phase (g) Product (g)
Analytical 1–5 Isolation of reference 0.2–3 0.0002–0.003
substances (MS or
NMR)
Analytical— 5–10 Starting materials 0.003–25 0.003–0.1
semipreparative for toxicology
Semipreparative 10–40 Intermediates for 25–100 0.1–5
—preparative lab synthesis
Pilot plant 100–300 Manufacturing of 100–1000 20–5000
drug substances
for pharmaceutical
development
Production 300–1,500 Manufacturing of 1,000–4,000,000 kg-tons
trade products
technology. The applications have been selected in such a way that a broad
variety of technologies like multiple injection,
recycling, displacement, and
SMB chromatography is covered. On-line detection tools have to fulfill other
demands in preparative chromatography than in analytical chromatography.
A special section has been devoted to this aspect below, and an instrument
that was developed in-house is presented.
21.2 METHOD DEVELOPMENT IN PREPARATIVE HPLC
Since chromatography scales up linearly and independently from the selected
technology (rationales when making a choice will be given later on), the
column containing the stationary phase is still the heart of the system. Method
development will therefore always start with the selection of the best station-
ary and mobile-phase composition to achieve an optimum in productivity,
which does not necessarily mean an optimum in selectivity.For example, a high
selectivity of α>10 has been obtained for the enantiomeric separation of β-
blocking agents like pindolol using amylose- or cellulose-derived stationary
phases, but the poor solubility of the racemates in the mobile phase (hexane/2-
propanol mixtures) will never result in an economic separation process. This
situation can be significantly improved by (i) solvent switch and (ii) adding of
bases or acids, which leads to higher solubility and productivity, although the
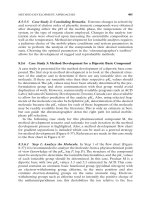
selectivity decreases. Figure 21-1 shows the separation of the enantiomers of
pindolol under different conditions [11, 12]. Even though the addition of TFA
clearly results in very distorted isotherms, the situation from the point of view
of the preparative separation is much improved, with the throughput increas-
ing from 322 to 860g of racemate per kilogram of chiral stationary phase per
day. Nevertheless, as a rule of thumb, in most cases higher productivities have
METHOD DEVELOPMENT IN PREPARATIVE HPLC 939
Figure 21-1. T
he effect of mobile-phase additives on pindolol on Chiralcel-OD
(analytical column). Mobile phase: (a) Methanol/diethylamine = 99.9/0.1, 20°C. (b)
Hexane/ethanol/trifluoroacetic acid = 60/40/0.5, 40°C. (c) Conditions as for (b), but
25-mg load. (Reprint from reference 12, with permission.)
been obtained under separation conditions where high selectivities have been
identified.
Therefore, in parallel, parameters like solubility of the sample in the
mobile phase, capacity of the stationary phase, stability, and work-up of
product containing fractions have to be determined. Once a robust system has
been developed, the possibilities of scale-up (solubility of sample, stability of
product in mobile phase, work-up, etc.) are investigated in the next step. And
finally the adsorption isotherms are measured as a guide to the appropriate
and economic technical realization on pilot plant or production scale.
21.2.1 Optimization of Selectivity
The first step, the search for an appropriate chromatographic system, can be
explored with the aid of analytical columns or even more easily in the case of
straight-phase chromatography with thin-layer chromatography (TLC). In the
case of chiral separations with chiral stationary phases (CSP), a quick survey
of separation strategies is provided by using electronic databases like Chir-
base in advance. Since each type of column overloading will result in a loss of
separation, the method development should start with the search for a suffi-
cient peak resolution R
s
. Under analytical conditions, the peak resolution R
s
is the result of the interplay of selectivity or separation factor α, retention time,
and column performance according to equation (21-1):
(21-1)
where a is the separation factor (selectivity) = k
2
/k
1
for k
2
> k
1
; k
1
and k
2
are
the capacity factors of substance 1 and 2, respectively; and N is the plate
number.
A rough estimation nicely highlights the contribution and importance of a
well-developed separation factor. Whereas changes in k from 3 to 5 only
improve the peak resolution by 10.7% and a doubling of N by 41.4%, the
increase of selectivity from 1.2 to 2.2 will result in an improvement of 83.3%.
Since in most cases the technical parameters like particle size and pressure
are given and used under optimum conditions, the search for high selectivity
cannot be overemphasized.
The main parameters to optimize the separation factor and peak resolu-
tion, respectively, are as follows:
•
Appropriate stationary phase (which not only seeks for the appropriate
polarity of the material; the “same stationary phase” from different sup-
plier may have a significant influence on the selectivity because of differ-
ences in the manufacturing process).
•
Appropriate mobile phase (which includes the choice and composition of
solvents, additives, and pH value).
R
k
k
N
S
=−
()
+
()
1
4
1
1
a
940 TRENDS IN PREPARATIVE HPLC
•
T
emperature. Especially the latter parameter should not be underesti-
mated. Although, as a rule of thumb, achiral separations are often per-
formed at elevated temperatures, it is generally believed that separations
on chiral stationary phases should best be performed at lower tempera-
tures. Nevertheless, sometimes it turns out that chiral separations
are entropy controlled and better selectivities are obtained at higher
temperatures [13–16].
Once the right set of parameters has been identified, computer-aided opti-
mization using modified sequential simplex or central composite design
methods can be applied to further fine-tune the separation under investiga-
tion, as has been published for the optimization of reverse-phase HPLC
[17–20] and chiral separations [21–23].
21.2.2 Scale-Up of Analytical Methods
21.2.2.1 Overloading. The fundamental difference between preparative
chromatography and analytical chromatography is the sample amount being
injected. In analytical chromatography the sample amount is extremely small
with regard to the amount of stationary phase (<1:10,000) and the chro-
matography is consequently performed in the linear range of the adsorption
isotherms of the components being separated. A rough calculation at that
point nicely demonstrates that a simple linear enlargement will never provide
an economic process. Therefore the injection amount will successively be
increased, which in the first instance will result in an adequate increase of peak
heights and peak areas while leaving the retention times and separation factors
unaffected.A further increase of the sample amount then will result in an over-
loading of the column and in deformed and moving peaks as a consequence
of a shift in the nonlinear range of the adsorption isotherms. Concave
isotherms will provide broader tailing peaks with shorter retention times,
whereas convex isotherms will show broader fronting peaks with greater
retention times. The separation of course will become poorer; nevertheless, as
long as it is sufficient, the process will become more and more economic. The
increase of the injected quantity until the two peaks touch is called touching-
band optimization [24], and an example is given in Figure 21-2 for the sepa-
ration of an artificial mixture of epothilone A and B.
This optimization approach has the advantage of being fast and simple, but
it often overlooks specific effects that happen at larger loads. These effects
concern the displacement of one product by another and have been described
by Guiochon and co-workers [25–28] and Cox and co-workers [29–31]. The
interplay of adsorption isotherm, peak form, and capacity factor k during
overloading of a column is depicted in Figure 21-3 [32].
Sometimes, during the course of determining the capacity of the stationary
phase and the adsorption isotherms, it turns out that significant preparative
amounts of reference material can easily be obtained even with analytical
METHOD DEVELOPMENT IN PREPARATIVE HPLC 941
942 TRENDS IN PREP
ARATIVE HPLC
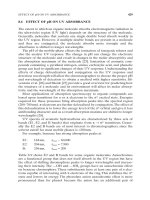
Figure 21-2. Separation of 247mg of epothilone A (first eluting) and B (structure given
below) on a semipreparative reversed-phase ODS column (25-cm × 2.0-cm i.d.).
Particle size 11µm, mobile phase acetonitrile/water = 4/6 (V/V), flow rate 15mL/min,
UV detection 250nm.
Figure 21-3. T
he effect of adsorption isotherm on peak form and capacity factor k
during overloading of a column. c
s
and c
m
= concentration of substance in the station-
ary and mobile phase; A, B, C, D refer to substance A, B, C, D, respectively.
columns. Given the good solubility of a racemic morphanthridine in the mobile
phase and the large separation factor
, the author decided to estimate the
capacity of the CSP for the given separation [33]. The injection amount sys-
tematically increased to estimate the final value for which a baseline sepa-
ration could be observed. To obtain on-scale peaks, UV detection was carried
out at 290nm, and the automatic injection device was replaced by a manual
loop with different volume sizes.After several runs the endpoint was the injec-
tion of 100mg of racemate dissolved in 250 µL of hexane/2-propanol = 1/1
(V/V). The preparative chromatogram of this run is shown in Figure 21-4. It
is obvious from the individual peak shapes that both enantiomers follow dif-
ferent adsorption isotherms. Whereas for the first eluting enantiomer, a linear
adsorption isotherm is observed, the corresponding one for the second eluting
enantiomer is much more complex. Nevertheless, both enantiomers are sepa-
rated to baseline and completely eluted within 15min. It is therefore obvious
that even without further optimization, a daily yield of 9.6g of resolved race-
mate can be achieved using an automatically injection device with repetitive
injection. Based on this result, several interesting production scenarios can be
derived. Just by increasing the inner diameter of the column, the production
of ton amounts/year with a daily mobile phase consumption of less than 1m
3
may be easily achieved.The results of the calculations are summarized in Table
21-2. As can be taken from Table 21-2, a respectable amount of 96kg of race-
mate can be resolved per day on a column containing 30kg of CSP. In a typical
pilot plant environment, such a column belongs to the smaller ones and also
METHOD DEVELOPMENT IN PREPARATIVE HPLC 943
Figure 21-4. Preparative enantioseparation of a morphanthridine analogue on an ana-
lytical Chiralpak-AD column (250-cm × 4.6-mm i.d.). Mobile phase Hexane/2-propanol
= 85/15 (V/V), 0.5 mL/min; temperature 40°C, UV detection 290nm, injection amount
100mg/250 µL hexane/2-propanol = 1/1 (V/V). (Reprint from reference 33, with
permission.)
the daily mobile-phase consumption of 7.2m
3
is not a technical hurdle
.A fully
automated chromatographic system would consequently provide a yearly pro-
duction of 35 tons of resolved racemate. Later on (Section 21.4.4) it is shown
that in most cases where conventional batch elution chromatography is com-
pared with simulated moving bed (SMB) applications with the same amount
of CSP, productivity can double and solvent savings up to 80–90% are
achieved.Assuming such a production scenario for the above-mentioned mor-
phanthridine analogue, a daily production of 192kg (corresponding to 70
tons/year) reflects a feasible order of magnitude. In addition, a daily solvent
consumption of 720L is negligible from a production point of view.
21.2.2.2 Solubility and Self-Displacement. In the previous scenario, the
feed concentration was gradually increased. This kind of overloading, called
concentration overloading, comes to an end when the solubility product of the
solute is achieved. A further increase of sample amount can then only be
achieved with volume overloading, the injection of larger feed volumes into
the column. Very often in practice the combination of both types of over-
loading comes into operation. In the case of an excellent selectivity in combi-
nation with a poor sample solubility, the addition of a more polar solvent
to the feed solution may help to achieve a higher productivity. As a result of
the slightly modified chromatographic system, a partial self-displacement is
observed, visualized by a doubling of the eluting peaks. Since, in addition, the
retention is shifted to shorter retention times, this improvement will also come
to an end when the first compound leaves the column unretained with t
0
.
Therefore sometimes the reverse occurs—for example, when a good sample
solubility meets excellent elution conditions. To avoid peak elution during the
injection period, the polarity of the feed solution is changed by addition of a
944 TRENDS IN PREPARATIVE HPLC
TABLE 21-2. Calculated Production Scenarios for a Preparative Enantioseparation
of a Morphanthridine Analogue on Chiralpak-AD
Analytical Pilot Plant Production
Amount of CSP Column Column Column
3g 3kg 30kg
Batch Elution Mode
Resolved racemate/day 9.6g 9.6kg 96.0kg
Resolved racemate/year 3.5kg 3.5 tons 35.0 tons
Solvent consumption/day 0.72L 0.72m
3
7.2m
3
SMB Mode
Resolved racemate/day NA 19.2kg 192.0kg
Resolved racemate/year NA 7.0 tons 70.0 tons
Solvent consumption/day NA 72L 0.72m
3
NA, not applicable with respect to preparative method.
further solvent in such a way that the solubility of the feed solution decreases
and takes significantly larger injection volumes into account.
Injection times
of 30min. and longer are acceptable as long as the sample stays retained at
the top of the column. After the injection is finished, the solutes are eluted
with the mobile phase that has a better solubility.An example of this approach
has recently been published for the purification of discodermolide [34] (Figure
21-4). A 38-g sample of crude product (82.4%) was dissolved in 11.2L of
2-propanol and diluted with 78.4L of water. After injection of this feed solu-
tion onto a column containing 15kg of ODS-RP-18 reversed-phase phase silica
gel, the drug substance was eluted with a mixture of acetonitrile/water = 25/75
(V/V) in an isocratic mode. It is noteworthy that in the large-scale synthesis
of 60g discodermolide, 39 steps (26 steps in the longest linear sequence) and
several chromatographic purifications were involved. A chromatographic
purification of such a “small” amount of a highly active drug substance which
delivered sufficient material for early-stage human clinical trials is the method
of choice, since extremely pure material is obtained on pilot plant equipment
in a very short time. Figure 21-5 shows a semipreparative purification of dis-
codermolide during method development on a lab-scale column and highlights
the effectiveness of the purification step.
21.2.2.3 Purity of Solvents, Stability of Products and Work-up. The quality
aspect of the solvents used as mobile phases should not be forgotten, since the
evaporation residue from the mobile phase can be significant. Assuming an
average product concentration of 1–2g/L mobile phase, it becomes obvious
that an evaporation residue of 10mg/L solvent leads to 1 g of evaporation
METHOD DEVELOPMENT IN PREPARATIVE HPLC 945
Figure 21-5. Purification of 101mg of crude discodermolide on 46 g of YMC-OD-A
5–15µm (column: 250-mm × 20-mm i.d.). The drug substance is dissolved in 31.4 mL of
2-propanol and 220.6mL of water are added. The feed solution is pumped with a flow
rate of 10mL/min onto the column, and the compounds are eluted afterwards with a
mixture of acetonitrile/water = 2/1 (V/V), flow rate 15 ml/min; UV detection 220 nm.
residue in 100g of product. Solvents that are used in preparative chromatog-
raphy should therefore have an evaporation residue of <10
−4
g/L.
To ensure a
good quality of the product, it is therefore sometimes necessary to purify the
solvents in advance prior to their use as mobile phase. This not only will have
an influence on the product quality, but also may, in addition, by removing
heavy metals and/or stabilizers, have an impact on the resolution and there-
fore also affect the ruggedness of the chromatographic process. As has been
shown by Dingenen [35], the switch from one supplier to another can lead to
the complete loss of selectivity in a chromatographic step.
Once a chromatographic system has been identified for a preparative
purpose, the stability and work-up procedure of the product-containing frac-
tions should be investigated. Sometimes it turns out that the products cannot
be isolated by simple removal of the solvents, because of thermal instability
or too basic or acidic conditions in the mobile phase. In such a case an appro-
priate extraction procedure from the mobile phase may help to isolate the
products.
21.2.3 Adsorption Isotherms and Their Determination
The most common technique used in preparative chromatography is still iso-
cratic batch elution. However, more sophisticated technologies like recycling,
gradient elution, displacement, or the simulated moving bed (SMB) process
are being increasingly applied to enhance productivity and yields. A fair com-
parison between these rivaling technologies is only possible on the basis of
real occurring concentration profiles that agree excellently with the theoreti-
cal predictions. The substantial progress that has been achieved in modeling
preparative chromatography was reviewed recently [36–38].
The underlying equilibrium-dispersion model, for which the mass balance
for solute i in a N component mixture and a volume element is given in equa-
tion (21-2), has been very often successfully applied to quantify chromato-
graphic processes under overloaded conditions.
(21-2)
In this equation, c is the concentration in the fluid phase and q is the quantity
in the solid phase. The column porosity e (expressed as phase ratio F = (1 −
ε)/ε) defines the fraction of the fluid phase in the column. Furthermore, u
stands for the linear velocity and t and x are the time and space coordinates,
respectively. All contributions leading to band-broadening are lumped in a
simplifying manner into an apparent dispersion coefficient, D
ap
. In equation
(21-2), it is assumed that the two phases are constantly in equilibrium
expressed by the adsorption isotherms. Due to the nonlinear character of the
isotherm equations, the solution of equation (21-2) requires the use of numeri-
∂
∂
∂
∂
∂
∂
∂
∂
c
t
F
qc
t
u
c
x
D
c
x
iNcccc
i
i
i
ap
i
N
i
+
()
+= = =
()
2
2
12
1, , , with , , ,
946 TRENDS IN PREPARATIVE HPLC
cal methods. The Godunov method is a good choice, because it exploits quan-
titatively the knowledge about numerical dispersion effects that are caused by
usage of finite difference approximations
. The method allows the application
of rather coarse grids leading to fast calculations [39]. The adaption to simu-
late multicolumn countercurrent processes has been reported in detail [40].
The application of the model and these numerical solutions allows the simu-
lation of elution chromatography, recycling chromatography, simulated
moving bed chromatography,and annular chromatography on a personal com-
puter within a few minutes. A systematic investigation (theoretical simulation
on the basis of determined adsorption isotherms and experimental verifica-
tion) to compare the different chromatographic modes has recently been pub-
lished by Seidel-Morgenstern for the separation of a binary mixture consisting
of two isomers of a steroid [41, 42].
The concentrations of component i in the liquid and in the solid phases, C
i
and q
i
, respectively, are related through the adsorption isotherms [equation
(21-3)].
(21-3)
The knowledge of these adsorption isotherms is the main prerequisite for
applying the mathematical models to simulate preparative HPLC, displace-
ment or simulated moving bed chromatography. Several methods (e.g., frontal
analysis, elution by characteristic point, minor disturbance method, adsorp-
tion–desorption, and chromatogram fitting) are available for the determina-
tion of the equilibrium data and have been reviewed by Nicoud and
Seidel-Morgenstern [43] and very recently by Seidel-Morgenstern [44]. It is
beyond the scope of this chapter to describe all methods with their benefits
and drawbacks in detail, and the interested reader is referred to the literature
[i.e., 39–44]. Nevertheless, three methods (given below) that we have used
in our laboratories are briefly summarized to illustrated the underlying
principles.
21.2.3.1 The Elution by Characteristic Point Method (ECP). An easy and
simple method to measure the adsorption isotherms for pure components is
the ECP method suggested by Cremer and Huber [45].This method evaluates
chromatograms recorded after injecting samples of large size on a column. As
a basic requirement for the applicability of the ECP method, the column has
to be very efficient. Under these conditions, thermodynamics determine the
shape of the chromatographic profiles and kinetic effects can be neglected. If
a large sample size is injected on the column, usually the front of the obtained
chromatogram is sharpened and the tail is dispersed. The concentration–time
relation of the dispersed tail (Figure 21-6a) is completely defined by the course
of the adsorption isotherm in equation (21-4), where t
R
represents the reten-
tion time, t
0
the void volume, and F the phase ratio.
qfCC C i N
iN
=
()
=
12
1, , , , ,,
METHOD DEVELOPMENT IN PREPARATIVE HPLC 947
948 TRENDS IN PREP
ARATIVE HPLC
Figure 21-6. Experimental setup of ECP (a), MDM (b), and ADM (c) method for the
determination of adsorption isotherms. The concentration–time relation of the dis-
persed tail in the ECP approach (a) is completely defined by the course of the adsorp-
tion isotherm, as can be visualized by the injection of increasing samples amounts.
Solvent injections at defined concentrations will result in pulses in the MDM approach
(b) which are linked to the adsorption isotherms. Although very precise during appli-
cation of the ADM method, the data points of the adsorption isotherms (c) have to be
measured individually.
(21-4)
21.2.3.2
The Minor Disturbance Method (MDM). The principle of the
MDM method is based on a stepwise saturation of the column with different
known feed concentrations. After reaching equilibrium, small samples pos-
sessing a different concentration are injected and the corresponding retention
times are measured. Figure 21-6b illustrates the principle of the perturbation
method for a single component dissolved in a nonadsorbable eluent. At zero
time a small (analytical) sample size is injected without preloading on the
column. In the following steps the column is saturated at different concentra-
tions and small amounts of pure eluent are injected at the times marked with
arrows. Possible deviations of the retention times at higher concentrations are
caused by the nonlinearity of the adsorption isotherm. Since the method
depends only on the analysis of times, no detector calibration is necessary. To
determine the competitive isotherms for a binary mixture, the same procedure
can be applied, saturating the column with different solutions of known con-
centration of the two components.At each plateau a perturbation induces then
two pulses. Using the column mass balance equation and the coherence con-
dition introduced in the frame of the equilibrium theory [46], equation (21-5),
being the derivative of the adsorption isotherms, can be derived. In other
words, the principle of the MDM method is the determination of parameters
of an isotherm model from measured retention times.
(21-5)
21.2.3.3 The Adsorption—Desorption Method (ADM). Although time-
and sample-consuming, the ADM method leads directly to the adsorption
isotherms and has often proved to be the most precise method. After satura-
tion of the column with defined increasing solute concentrations C
E
i
, the cor-
responding amounts of solutes m
i
in the column of volume V are obtained
after desorption in each step with the same solvent mixture (Figure 21-6c).
Equilibrium conditions assumed, the corresponding concentrations in the sta-
tionary phase q
E
i
are obtained according to equation (21-6) (e denotes the
porosity and phase ratio, respectively):
(21-6)
The experimental setup of the above-mentioned approaches are summarized
in Figure 21-6.
To model the adsorption equilibrium, a suitable isotherm equation has to
be chosen. For mixtures, the model equations are usually coupled to take into
qC C C
mVC
V
iN
EE E E
iE
iN
i
12
1
1, , , , , ,
()
=
−
−
()
=
e
e
tt F
dq
dC
ik
R
i
i
k
ik,
,, ,2=+
=
0
11
dq
dC
tC t t
tF
i
i
C
R i inj
i
=
()
−−
0
0
METHOD DEVELOPMENT IN PREPARATIVE HPLC 949
account the competition for available adsorption sites. The so-called multi-
Langmuir equation (21-7) was found to represent a lot of experimental data
satisfactorily
.
(21-7)
For enantiomeric separations, the modified competitive Langmuir equation
(21-8) was found to represent several sets of experimental data satisfactorily
[47]. This equation considers noncompetitive and competitive adsorption at
different types of adsorption sites. Other useful equations are described and
reported in the literature [48, 49].
(21-8)
21.2.3.4 Curiosities. The following example may, in addition, illustrate the
importance of known adsorption isotherms. The enantiomeric separation of
3-benzyloxycarbonyl-2-t-butyloxazolidinone on the CSP Chiralcel-OD by
Francotte [50] revealed a concave adsorption isotherm for the first eluting
enantiomer and a convex one for the second eluting antipode (Figure 21-7).
With increasing sample amounts, the first enantiomer will therefore be shifted
to shorter retention times while the second enantiomer is shifted to longer
retention times. Good solubility of the racemate and a high capacity of the
q
aC
bC
iN
i
ii
jj
j
N
ii
=
+
=
=
∑
1
1
1
+ C , , ,l
q
aC
bC
iN
i
ii
jj
j
N
=
+
=
=
∑
1
1
1
, , ,
950 TRENDS IN PREPARATIVE HPLC
Figure 21-7. Preparative enantiomeric separation of 3-benzyloxycarbonyl-2-t-
butyloxazolidinone on Chiralcel-OD (50
cm × 5 cm); mobile phase hexane/2-propanol
= 8/2 (V/V), 50mL/min; injection amounts 2g (hatched area) and 3 g. (Reprint from
reference 50, with permission.)
stationary phase are fortuitous. In exceptional cases, where the concave
adsorption isotherm crosses the convex one
, even a reversal of the elution
order is obtained and can be used to achieve a higher productivity as has been
demonstrated by Roussel et al. [51] for the separation of the enantiomers of
3-(2-propylphenyl)-4-methyl-4-thiazolin-2-one on microcrystalline cellulose
triacetate.
21.3 COLUMNS AND STATIONARY PHASES
In the past, preparative HPLC has been dominated by the use of irregular par-
ticles of large size, broad size distribution, and low mechanical stability. Since
many improvements with respect to design and manufacturing of silica-based
particles have been achieved, nowadays the field of preparative HPLC is domi-
nated by the use of spherical particles with narrow distribution size, good
mechanical stability, and high loadability.The loadability is determined by the
following parameters: surface area, pore size, size distribution, and in special
cases (e.g., enantiomeric separations with CSP) ligand density. These para-
meters are systematically optimized by the manufacturers [52] of stationary
phases, and highly efficient columns are obtained and good packing of the
column provided. An improvement in the methodology of column packing
automatically results in reaching the required efficiency with shorter bed
lengths and in a better productivity.
21.3.1 Stationary Phases
The most widely used packing materials in preparative HPLC are the silica-
based particles. Although irregular particles are still available, for preparative
columns most applications tend to use spherical packings, since better pack-
ings are obtained and for additional reasons mentioned below. Underivatized
silica and C18 reversed-phase material (for most applications) are available in
packed column as well as bulk quantities. Aside from silica, columns based
upon other spherical packings are available, like organic polymers based upon
poly (styrene-divinylbenzene) (PS-DVB). These materials have excellent
separation properties in the field of peptide and protein purification. The
columns can be used for or cleaned with caustic solutions, where silica-based
material often has shortcomings. In addition, the manufacturing process has
meanwhile been improved in such a way that mechanical stability is achieved
comparable to that exhibited by silica-based stationary phases. It is out of the
scope of this chapter to list all stationary phases with their advantages and lim-
itations being used in preparative HPLC, and the interested reader is referred
to the literature [53]. Nevertheless, two types of stationary phases have
emerged during the last years which seem to be cornerstones of new innova-
tions. Their importance is still increasing and they are therefore discussed in
a little bit more detail:
COLUMNS AND STATIONARY PHASES 951
•
Chiral stationary phases for the separation of chiral and achiral
compounds
•
Preparative monoliths
21.3.1.1
Chiral Stationary Phases (CSP). The direct separation of enan-
tiomers by preparative HPLC is now widely used, and a large number of CSP
are commercially available. As a method to produce both enantiomers of a
drug candidate directly at the beginning of the clinical development, it is
becoming more and more attractive because it allows the rapid and easy
supply of amounts for biological testing, for toxicological studies, and even, in
a later stage, for clinical testing. In addition, data on the activity and toxicity
profiles of the individual enantiomers are meanwhile systematically required
by health authorities for new drugs submitted for registration. In addition, the
concurrent development of simulated moving bed chromatography (a chro-
matographic system that ideally separates two component mixtures, see later)
was fortunate for the boom in enantiomeric separations now reaching a pro-
duction scale. Several reviews have been published [54–58] introducing CSP
based on naturally occurring polymers (e.g., cellulose and amylose), synthetic
chiral polymers (e.g., poly(meth)acrylamides), and chirally modified silica gels
(e.g., “Pirkle phases,” classifiable into π-acceptor and π-donor phases). While
some 10–20 years ago it was generally believed that each chiral separation
problem needed its own CSP for resolution, the applications of the last years
have clearly revealed that up to 90% of all chiral separations can be performed
with the aid of about 4 CSP. The “Daicel columns”—in particular, Chiralcel-
OD and Chiralpak-AD (Figure 21-8)—have demonstrated their superior
status in the field, and several applications are mentioned in Table 21-4.
952 TRENDS IN PREPARATIVE HPLC
Figure 21-8. Structure of Chiralcel-OD and Chiralpak-AD
.
Whereas the separation of racemates on these two CSP are obvious, recent
applications demonstrate that achiral isomers
, especially aromatic compounds
with substituents in different positions, are extraordinarily well separated on
Chiralcel-OD and Chiralpak-AD as well (Figure 21-9). It is to be expected
that further examples will follow and more and more achiral separation prob-
lems will be solved in the future on CSP.
21.3.1.2 Monoliths. Very recently, both silica-based and polymeric mono-
lith preparative columns were introduced [59]. The positive feature of mono-
liths is their high permeability; thus, for preparative chromatography, they can
be operated at high flow rates and still exhibit their good efficiency. Mono-
lithic silica rods, offered by Merck (Darmstadt, Germany), are porous mono-
liths consisting of a skeleton with interconnecting macropores. Inside the silica
skeleton a large number of mesopores is present. The mesopores determine
the surface area of the sorbent, which is necessary for a high maximum load-
ability.The independent control of macro- and mesopores is a prerequisite for
achieving a material useful for preparative chromatography. The monolithic
silica rods are prepared via sol–gel process [60]. By varying the amount of
polyethylene oxide in the starting sol mixture, the size of the macropores can
be influenced (typically 3mm). The controlled formation of the mesopores is
achieved by immersion of the silica in an aqueous ammonium hydroxide solu-
tion. The duration and temperature of the process determine the mesopore
size. Preparative applications have recently been published with the purifica-
tion of 45mg cyclosporine A from fermentation broth on a PrepROD col-
umn (100 × 25mm i.d.) within a few minutes [61]. And by using eight columns
COLUMNS AND STATIONARY PHASES 953
Figure 21-9. Separation of Br isomers of a drug intermediate on Chiralpak-AD
(250 × 4.6mm); mobile phase n-hexane/2-propanol = 100/5, 0.8 mL/min; temperature
30°C, UV detection 210 nm.
simultaneously in a SMB unit, the separation of a 1.3-kg mixture consisting of
χ- and δ-tocopherol from vegetable oil could be achieved in one day
.
In the field of polymer-based monolith columns, BIA (Lubliana, Slovenia)
has expanded its line of methacrylate copolymer convective interaction media
(CIM) columns.The 800-mL column, based upon a poly(glycidylmethacrylate-
co-ethyleneglycoldimethacrylate) polymer, was functionalized with a diethy-
lamino group to be used for anion exchange separations. With a dynamic
protein-binding capacity of 20 to 60-g protein/mL wet support, this col-
umn is focused on industrial scale biochromatography and is the first cGMP-
compliant, industrial-scale monolith with a Drug Master File and other
documentation for scale-up from research purification.
21.3.2 Particle Size, Shape, and Distribution
As has been outlined in the preceding section [equation (21-1)], the efficiency
of the column is linked with the number of plates and with the particle size of
the stationary phase, respectively. Theoretical work has shown [62] that there
is an optimum particle size that depends on the conditions of the purification:
the selectivity of the phase system, the isotherms, and so on. Accordingly, it is
not possible to define an absolute optimum particle size. Nevertheless, most
industrial applications are published with stationary phases using particles
between 10 and 30µm. From a practical point of view (pressure reasons), it is
very unlikely that material with less than 5µm will be used. The same is true
for material with larger particles than 30µm. A larger impact is noticed with
respect to the particle size distribution. As has been demonstrated by Colin
[63], a column with an artificial mixture of 3- and 8-µm particles exhibits a
three times larger pressure drop than a comparable column with exactly 6-µm
particles. From an economic point of view, it is necessary to run the equipment
while using its full pressure capabilities, and high flow rates will then contribute
to the productivity directly. In other words, a packing material with a large size
distribution is not a good choice because the pressure capability of the equip-
ment is used to overcome the flow resistance created by the small particles
rather than speed up the separation. Whereas spherical particles are made
directly at the right size with a very narrow size distribution, angular particles
are obtained by crushing and sieving,which yields a broader particle size.Since
the latter is not desirable, as mentioned before, spherical particles are very
often advantageous. Nevertheless, angular material is sometimes used, espe-
cially when the efficiency is sufficient and the price of the material is more
attractive.
21.3.3 Columns and Packing Procedures
For a given type of stationary phase, the efficiency of a column is mainly deter-
mined by the column length and the packing procedure. The quality of a
packing technique can easily be derived from well-defined parameters: (i) the
954 TRENDS IN PREPARATIVE HPLC
efficiency expressed in terms of reduced plate height, (ii) the reproducibility
of the filling procedure (an important factor for the setup of SMB systems),
and (iii) the long-term stability of the column to ensure continuous operation.
It is meanwhile common practice to use the dry filling approach for materials
with a particle size above 25µm ± 5 µm and the slurry method for smaller par-
ticles
. Both methods and their advantages have been described in detail by
Dingenen [64]. Of the problems associated with increasing the column size,
the redistribution of particles seems to be the major one. This is related to the
loss of wall support, or, in other words, the existence of unstable regions
formed in the bed during the packing process. They correspond to bridges of
particles surrounding empty spaces. If these bridges collapse (because of shear
forces, mechanical vibrations, etc.), redistribution takes place, resulting in
reduced efficiency because diffusion takes place in these voids, resulting in
band distortion and loss of separation power. The technology to fill large
columns should avoid the formation of such voids. This hurdle can be over-
come by using compression techniques. This does not mean that the redistri-
bution will not happen, but the consequences are eliminated. Several
compression methods have meanwhile been described in the literature [64]
and are used for preparative HPLC. Nevertheless, it should be pointed out
that most applications are performed with equipment using dynamic axial
compression. With this approach, the column is packed and operated with a
high piston pressure. The pressure is always maintained on the bed during
column operation, and the piston always pushes on the bed. It is obvious that
under these conditions the efficiency of the column can be held, since the
formation of voids is permanently corrected. It has been demonstrated that
columns operated under dynamic axial compression showed no loss in effi-
ciency after days, whereas the efficiency dropped by 50–70% for columns with
the same material which were operated without piston pressure after the
packing. By means of the axial compression technique, it is also possible to
reproducibly fill columns. Furthermore, the packed bed is stable and the bed
length can easily be adjusted over a broad range just by choosing the desired
amount of slurry. In addition, it is possible to remove the packing in a fast
and clean way from the column, and finally the technology is easily scaled-up
from semipreparative columns to large-diameter columns for industrial
applications.
21.4 CHOICE OF PREPARATIVE LC TECHNOLOGY
From a process-engineering point of view, there is now a better understand-
ing of the development of concentration profiles in chromatographic columns
under overloaded conditions available. This includes in particular the quanti-
tative description of displacement and tag-along effects caused by competitive
adsorption. Since it is now possible (as mentioned before) to simulate con-
centration profiles on a personal computer,the choice of the appropriate mode
CHOICE OF PREPARATIVE LC TECHNOLOGY 955
of chromatography is easily achieved. Nevertheless, in pharmaceutical devel-
opment,
the equipment is very often given, and the chromatographic method
will be adjusted accordingly. In addition, the amount to be purified has also a
great influence on the chosen technology.The following section is intended to
briefly introduce the different routes of preparative chromatography that are
mainly used on pilot plant and production scale.
21.4.1 Classical Batch Elution
The most common approach used, especially in early development when small
quantities (several kilogram) have to be purified, is classical batch elution.The
lack of a need at that early stage to optimize the separation very often leads
to suboptimized processes that seem to be disadvantageous in comparison
with an excellent designed countercurrent process. Nevertheless, this com-
parison will become more favorable for batch elution when the full capacity
of the column is being used. It should not be forgotten for preparative runs in
isocratic mode that the process can be optimized in such a way that several
separations can be performed successively on a column until the compounds
of the first injection elute. The net elution time is then identical with the time
interval between two injections.An appropriate application for the separation
of a racemate of a drug substance intermediate on a CSP is shown in Figure
21-10.
21.4.2 Recycling Chromatography
In the case of low separation factors, recycling chromatography is often
used to allow higher injection amounts. The technology nicely mimics
longer columns without having the drawback of higher backpressure, and it
can easily be adapted to conventional equipment. For the closed-loop recy-
cling approach, a connection between detector outlet and pump inlet was first
demonstrated by Porter and Johnson [65, 66] (a schematic diagram is given in
Figure 21-11). In the period of recycling, the sample is reinjected in the column
several times after passing the pump. By switching the four-port valve, the
recycling procedure can be stopped and the samples will be eluted. In its peak
shaving approach the switching process of the four-port valve can be arranged
in such a way that pure side fractions are collected and the area of incomplete
separation is again recycled. Both approaches therefore offer a solution to
problems in preparative chromatography where under normal batch elution
only partially resolved products are obtained. Since no fresh mobile phase is
required during the recycling process, the solvent savings in recycling chro-
matography are considerable.
Theoretical treatments on recycling chromatography have been pub-
lished by Chizhkov [67], Martin [68], and Coq [69]. Seidel-Morgenstern and
Guiochon [70] developed a mathematical model to design recycling and
956 TRENDS IN PREPARATIVE HPLC
CHOICE OF PREPARATIVE LC TECHNOLOGY 957
Figure 21-10. Enantiomeric separation of a drug substance intermediate on a chiral
stationary phase [semipreparative column (34-cm × 10-cm i.d.) containing 1.8
kg of
CSP]; 5g of racemate is injected every 4 minutes onto the column; this is the identical
time interval for the peak widths of both enantiomers after elution.
Figure 21-11. Schematic diagram of the closed-loop rec
ycling apparatus.
peak-shaving chromatography under overloaded conditions. From a practical
point of view
, enantiomeric separations with CSP are very attractive, with
chemical purity of the racemate provided. The first separation of enantiomers
was performed by Schlögl. Others followed, recognizing the time and mobile-
phase savings in the technology.An excellent review of preparative chromato-
graphic resolution of racemates on CSP on a production scale by closed-loop
recycling chromatography has recently been published by Dingenen and
Kinkel [71].The separation of kilogram quantities within one week is reported
for hetrazepine, α-(2,4-dichlorophenyl)-1H-imidazole-1-ethanol, benztriazole
derivatives, γ-aryl keto esters, and an alkylated 2-piperazinecarboxamide on
various CSP. An outstanding preparative example has been described by
Dingenen and Kinkel for the enantiomeric separation of 2,2′-dihydroxy-1,
1′-binaphthyl, whose enantiomers can be separated on a chiral polyacry-
lamide-diol-silica copolymer, prepared from N-acryloyl-(S)-phenylalanine
diethylamide. By peak shaving of the first-eluted enantiomer starting in the
first cycle, 1.35g of racemate dissolved in 1.3mL of eluent were separated
within 12min. The productivity and solvent consumption has been calculated
for a semipreparative column (250-mm × 100-mm i.d.) filled with 1kg of CSP.
More than 18kg of racemate can be separated per week with a total solvent
consumption of 3760L, an amount easily handled in a pilot plant.
Examples from our group have been worked out for the separation of 1-
phenylethanol on Chiralcel-OD [72] and for the separation of a 2,6-dimethyl-
8α-aminoergoline intermediate on Chiralpak-AD [73]. For the latter
racemate, 0.5g has been separated on 192g Chiralpak-AD after three recy-
clings (Figure 21-12).
958 TRENDS IN PREPARATIVE HPLC
Figure 21-12. Separation of 0.5
g of racemic 2,6-dimethyl-8α-aminoergoline inter-
mediate on 192g of Chiralpak AD.
21.4.3 Displacement Chromatography
In displacement chromatography [74–76] the packed column is equilibrated
with a mobile phase that has a very low affinity to the stationary phase
. Then
the feed solution containing the mixture dissolved in the mobile phase is
injected in such a way that the components are adsorbed at the top of the
column. In the next step the solution of a displacer substance that has stronger
affinity to the stationary phase than any of the feed components is pumped
into the column. The components of the feed arrange themselves upon the
action of the displacer front moving down the column into a “displacement
train” of adjoining square wave concentration pulses of the pure substances,
all moving with the same velocity. After the product zones have passed, the
column is regenerated by removing the displacer and re-equilibrating with the
mobile phase. This additional operational step does not contribute directly to
the separation, but is an undesirable feature of the technique.The relationship
between the final pattern in displacement development and the isotherms of
the displacer and the feed components is illustrated in Figure 21-13.As can be
taken from the figure, the concentrations of fully developed zones of the com-
ponents are determined by the intersections of the individual adsorption
isotherms with the operating line.The requirement for complete displacement
development to occur is that the isotherms should be convex and that the
operating line drawn as the chord of the displacer isotherm intersects the
isotherms of all feed components. Having in mind all additional prerequisites
(like the search for a suitable displacer,determination of adsorption isotherms,
etc.), it becomes obvious that the successful development of a chromato-
graphic displacement process is more time-consuming than in the classical
elution mode. On the other side, the increase in productivity (as a result of
higher injection amounts) is very often many-fold in comparison to prepara-
tive chromatography under nonlinear conditions.
21.4.3.1 Examples. The majority of published displacement processes deal
with the purification of peptides [77] and proteins [78–80] and the separation
of racemates [81–83]. An example from our group may again highlight the
potential of displacement chromatography for the purification of peptides.The
peptide backbone of a calcitonin analogue is produced by solid-phase syn-
thesis. Following cleavage from the resin and purification by conventional
reversed-phase elution chromatography, the peptide is glycosylated in the
presence of acetic acid and dimethylformamide. The crude product (Figure
21-14a) with a content of 75% contains the di-glucose form of the peptide and
unreacted peptide (starting material) as the most crucial impurities which have
to be removed.
Estimation of adsorption isotherms, the search for an appropriate displacer,
scale-up, and optimization of the method with an analytical column will
be described elsewhere [84]. The result of this development report can be
summarized as follows. After equilibration of the reversed-phase column
CHOICE OF PREPARATIVE LC TECHNOLOGY 959
(Hyperprep ODS 8µm) with mobile phase (28% acetonitrile and 0.2% phos-
phoric acid),
the feed was dissolved in the mobile phase at a concentration of
20mg/mL, and the total feed mass was about 1/140th of that of the stationary
phase in the column. The displacer solution contained benzyldimethylhexa-
decyl ammonium chloride dissolved at 5mg/mL in a solution of 32% acetoni-
trile and 0.2% phosphoric acid. Upon breakthrough of the peptide
960 TRENDS IN PREPARATIVE HPLC
Figure 21-13. Relationship between the final pattern in displacement development and
the isotherms of the displacer and feed components. The intersection of the operating
line with the feed component isotherms determines their concentrations in the dis-
placement train. The isotherm of component 1 lies beneath the operating line, hence
it is eluted in the mobile phase. (Reprint from reference 74, with permission.)
front—monitored by UV detection at 250nm—fractions were collected and
analyzed.
Finally, the column was regenerated with 70% acetonitrile and 0.4%
phosphoric acid at the beginning and ending with pure methanol. The purifi-
cation effect is illustrated in Figure 21-14b, demonstrating that a final purity
of 99.7% for the drug substance has been achieved. The process has been
scaled-up, and several runs on pilot plant equipment have been performed. A
careful comparison of drug substance chromatography in elution and dis-
placement mode has been explored and production scenarios calculated. The
results are summarized in Table 21-3.
The direct comparison has been made between a typical run in a 50-cm ×
30-cm i.d. column running in the elution mode and the results of a displace-
ment run on a 25-cm × 15-cm i.d. DAC column. In both cases, it is possible to
carry out two runs per day (about eight per week is more realistic). Produc-
tion rates with the two methods are quite similar. However, in displace-
ment, eight times less sorbent is employed, and solvent consumption is
much lower. Two advantages of the elution method are that it requires no
CHOICE OF PREPARATIVE LC TECHNOLOGY 961
Figure 21-14. HPLC analysis of calcitonin analogue (crude reaction product) after gly-
cosylation (a) and after displacement chromatography (b).