Tài liệu HPLC for Pharmaceutical Scientists 2007 (Part 8C) pdf
Bạn đang xem bản rút gọn của tài liệu. Xem và tải ngay bản đầy đủ của tài liệu tại đây (470.51 KB, 21 trang )
the flow rate (mL/min) to determine the time (in minutes) needed. Therefore,
the lower the flow rate, the longer the equilibration time.
Some typical equilibration times for various column dimensions are shown
in Table 8-7; however, these should only be used as a guide. If complete equi-
libration is not achieved, early eluting components may show differences in
retention from run to run. An experiment could be run such that three dif-
ferent methods could be run with different equilibration times. For example,
if a 15-cm × 4.6-mm i.d. column and a flow rate of 1mL/min was used, then
the equilibration times for the three methods would be 5 min (3 CV), 9min (5
CV), and 11 min (6 CV) equilibration times, respectively. If the retention of
the early eluting components are consistent (less than 1% variation in reten-
tion time) in all three methods, then the lowest equilibration time could be
used. However, if the early eluting components show greater variation in their
retention time with the 5-min equilibration time compared to the methods
with the 9- and 11-min equilibration time, then an equilibration time of greater
than 5 min is warranted. Optimization of the optimal equilibration time is
required for reproducible methods.
Other considerations include differences in dwell volumes from the differ-
ent HPLC systems.The dwell volume should be determined for all the systems
in the laboratory and based on these determinations, this should be factored
into the calculation of the equilibration time. For example, if the maximum
dwell volume of all the systems in a particular laboratory to which the method
is transferred to is 2 mL and you are running on an instrument at 1 mL/min
that has a dwell volume of 1 mL, then you should add an extra minute of equi-
libration time. This becomes extremely important during method transfers
where the instruments in the receiving laboratory may be different.
8.5 METHOD DEVELOPMENT APPROACHES
8.5.1 If Analyte Structure Is Known
Determine if analytes are acidic, basic, or neutral. This will allow the
chromatographer to choose a pH such that the analyte is being analyzed
METHOD DEVELOPMENT APPROACHES 385
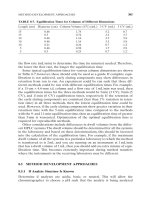
TABLE 8-7. Equilibration Times for Columns of Different Dimensions
Length (cm) Diameter (cm) Column Volume (CV) (mL) 3 CV (mL) 5 CV (mL)
15 0.46 1.74 5.2 8.7
15 0.3 0.74 2.2 3.7
10 0.46 1.16 3.5 5.8
10 0.46 1.16 3.5 5.8
10 0.21 0.24 0.7 1.2
5 0.46 0.58 1.7 2.9
5 0.3 0.25 0.7 1.2
predominately in one ionization state. Use the rules for pH shift and pK
a
shift
to ensure that the analyte is one predominant ionization state and choose the
appropriate mobile-phase pH (see Chapter 4).
Some general guidelines are as follows: If your target analyte is an acidic
analyte (pK
a
≥ 3), use a 0.2 v/v% phosphoric acid mobile phase. If target
analyte is a basic analyte (pK
a
≥ 7–9), use an ammonium acetate buffer (pH
5.8) to analyze in its ionized form or use a 25 mM ammonium hydroxide buffer
(pH 10.5) or 25 mM N-methyl pyrrolidine buffer (pH 10.5) to analyze in its
neutral form. Use a 10-cm × 3.0-mm column packed with 3-µm particles and
intermediate polarity phase such as a C8 column that is stable for the pH at
which you may be running the probe separation. Run in the gradient
mode using an acidic buffer or a basic buffer from 5% to 95% of organic
component, or up to the buffer solubility limit over 10 min, and use an
isocratic hold for 10 min to ensure elution of hydrophobic components. Use a
flow rate of 0.8–1 mL/min flow rate and 40°C temperature. Injection volume
should be on the order of 5–20 µL and the concentration of the analyte should
be 0.5–1 mg/mL. This corresponds to approximately 5–20 µg injected on
column. On the other hand, for neutral analytes higher analyte loading
such as 50–100 µg maybe used since nonideal interactions with the stationary
phase are less prevalent. Note that for ionizable compounds, especially
basic compounds when analyzed in their ionized state, higher mass on column
may lead to mass overload of “hot spots” on the bonded phase and poor peak
efficiencies may be observed. Try not to load more than 10 µg on column
for basic compounds. Usually greater loading capacity is obtained for basic
compounds when they are analyzed in their neutral state. Note that for
columns with larger inner diameters such as 4.6 mm, larger sample loads may
be acceptable.
Once the probe gradient is run, check the diode array purity; and if LC-MS
is available, run as well to check for peak homogeneity. If you have any known
precursors or impurities, run them as well to ensure resolution from the main
component and to make sure they are adequately retained. The main analyte
should elute between k 2–5. If the main component elutes at k = 2–5 and is
spectrally pure and the impurities all elute k > 1, the method is complete. If
the retention factor of the impurities is below 1, then an isocratic hold at the
initial organic composition should be implemented until the minor component
(impurity) elutes k > 1 and then a linear gradient can be implemented. The
method could be further optimized by increasing the flow rate as long as the
backpressure limitation of the system has not been reached. A general rule of
thumb is that the backpressure should not exceed 85% of the maximum back-
pressure for a particular HPLC system.
If resolution is not achieved between a critical pair, the use of a shallower
gradient can be investigated. If that does not increase the resolution, then a
longer column (15-cm column, packed with 3-µm particles of the same sta-
tionary phase type) should be used with a reduced flow rate of 0.7 mL/min
(due to backpressure limitations).
386 METHOD DEVELOPMENT
If separation is still not achieved, consider using a different organic modi-
fier such as mixture of MeCN and methanol to possibly induce changes in the
selectivity. Also, the wavelength of detection must be considered, especially if
MeOH is used due to its UV cutoff (absorbs <210 nm). If methanol does give
you desired selectivity, then an analyst needs to determine if sufficient
response (S/N > 10 :1) is obtained at desired LOQ (i.e., 0.05% solution of
target), especially if the wavelength for detection is <210nm.
If changing the organic modifier does not work, consider changing the
mobile-phase pH (analyze the molecule in a different ionization state). For
example, if a basic compound was originally analyzed under basic conditions
(pH >> pK
a
), try to use acidic conditions (pH << pK
a
) with the acetonitrile in
the initial gradient. If that still does not work, then consider using a different
stationary phase (phenyl or polar embedded) employing the initial gradient,
with initial aqueous mobile phase and acetonitrile organic modifier, and repeat
the process that was performed on the original column used for initial method
development. The final method optimization may include varying the gradi-
ent slope, column temperature, and flow rate.
Note that multiple pH values and columns can be screened in gradient
mode at the same time as well. This will increase the efficiency/probability of
obtaining the best column/conditions and the best demonstrated chromato-
graphic selectivity. Note that the aqueous phase pH values that would be
chosen for these pH/column screening studies should be based on knowledge
of the physicochemical properties of the molecule, taking into consideration
the mobile-phase pH and analyte pK
a
shifts in the hydro-organic media.
8.5.2 If Method Is Being Developed for Separation of Active and
Unknown Component
Define the criteria for the method such as the LOQ, maximum run time, wave-
length detection, and so on. Look at the structure of the target analyte (esti-
mate pK
a
) or use ACD (advanced chemistry development) and determine the
best pH to run the method. Try to use shorter columns for gradient scouting
experiments (5 cm × 4.6mm ) packed with 3-µm columns or use a high-
pressure system (max pressure 15,000 psi) with 10-cm × 2.1-mm, 1.7-µm parti-
cles. Use 35–45°C as starting temperature. If pH scouting studies are needed,
run a probe linear gradient using 0.2 v/v% phosphoric acid on a short column
(5-cm × 4.6-cm column) to determine the isocratic conditions for the
pH studies. Run pH studies isocratically to determine the desired pH region
to understand the behavior of the impurities in the analyte mixture. The
desired pH region of the aqueous phase is the pH region where the retention
of the components in the mixture do not significantly change their retention
as a function of the pH of the aqueous phase. Track impurities using diode
array if possible. Run a linear gradient at a pH within the desired pH region
and hold at high organic concentration on 5-cm × 4.6-mm column. If
you obtain sufficient resolution, then you are finished. If you need more
METHOD DEVELOPMENT APPROACHES 387
resolution, then use a 15-cm × 3-mm i.d. column. If resolution is obtained,
then you are finished. If desired resolution/selectivity is not obtained, then
screen different organic modifiers/different stationary phase types. Note
that the separation of the critical pair may be obtained on an alternate
stationary phase that offers additional selectivity. In addition to the weak
dispersive types of interaction that are available on a C8 or C18 phase,
phenyl phases may provide additional interactions such as π–π-type interac-
tions and may assist in providing additional selectivity. If the impurities/active
are very polar, the use of polar embedded phases may provide additional selec-
tivity by introduction of a secondary type of interaction such as hydrogen
bonding close to the surface in the organic-enriched layer. Alternatively, for
basic compounds, different counteranions could be introduced in the mobile
phase in order to increase retention of protonated basic amines. These are
known as chaotropic reagents and were discussed in Section 4.10. This may
lead to increased retention and increased selectivity between critical pairs of
components.
Moreover, if the laboratory has an automated method development system,
then this could be used to determine the best set of gradient conditions to give
the best resolution between the critical pair or pairs on multiple columns.
When using an automated method development system such as AMDS
(Waters, MA) for gradient optimization, generally two types of organic mod-
ifiers are used at two different temperatures employing a steep/shallow gra-
dient on two to six columns. Based on these scouting runs and the users’
acceptance criteria for the method, a resolution map is generated by input of
the data into Drylab, Chromsword, ACD, or another program. From this res-
olution map the best conditions are chosen and optimized (change in flow rate,
multistep gradient ramps, etc.), and these conditions are run to confirm that
the method that was predicted is indeed representative of the actual separa-
tion. This is typically called a verification run. AMDS relies on constraints of
the DryLab model. Note that Drylab is not suitable for the following types of
compounds:
•
Chiral compounds
•
Achiral isomers or diastereomers
•
Inorganic ions
•
Carbohydrates
•
Proteins and peptides
The DryLab model utilized in Waters AMDS has additional requirements:The
number of sample components should not exceed 12; peak area% should be
greater than 1%. These requirements are necessary to achieve greater predic-
tion accuracy only. Any discrepancies could be corrected manually in DryLab
using the data entry screen by manually entering the retention of the compo-
nents from the scouting runs (to assign the peaks with a certain number).
DryLab has been used for the method development of model drug candidates
388 METHOD DEVELOPMENT
and their degradation products, by optimization of temperature and gradient
slope, and the historical review on the milestones and concepts in the devel-
opment of DryLab software is given in references 20–23.
8.5.3 Defining System Suitability
System suitability parameters with their respective acceptance criteria
should be a requirement for any method. This will provide an added level
of confidence that the correct mobile phase, temperature, flow rate, and
column were used and will ensure the system performance (pump and
detector). This usually includes (at a minimum) a requirement for injection
precision, sensitivity, standard accuracy (if for an assay method), and retention
time of the target analyte. Sometimes, a resolution requirement is added for
a critical pair, along with criteria for efficiency and tailing factor (especially
if a known impurity elutes on the tail of the target analyte). This is added
to ensure that the column performance is adequate to achieve the desired
separation.
System suitability requirements for retention time, efficiency, resolution,
and tailing factor are set based on prior method challenging experiments and
prior method development experience. This is a dynamic process; and as the
user gains more experience with the method, the breadth of the acceptance
criteria is further expanded until the method is finally validated for the
intended purpose.
Two examples are given for setting system suitability requirements for
challenging separations. In the first example, if a separation is to be carried
out where the retention of the target analyte may have a greater propensity
to vary with slight changes in pH, tighter controls for the pH requirement
should be implemented, where the pH of the aqueous phase should be
controlled to ±0.05 units. Moreover, some preliminary experiments should
be performed using an aqueous mobile-phase pH ±0.2 units from the desired
pH to determine if this will have an effect on the critical pairs in the separa-
tion and what the desirable retention time window is. This information is
useful to define the system suitability criteria for the method. Also, it is rec-
ommended to run the separation on different lots of columns to see if there
is any lot-to-lot variability. Preferably, running the separation on columns that
were made from different batches of base silicas is desirable. Also, obtaining
columns from different synthetic bonding batches made on the same batch of
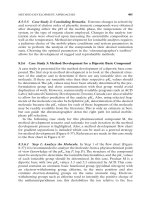
silica is also desirable. In the example shown in Figure 8-22 for a drug product
that contains two actives, three different columns from three different lots of
base silica were used and the pH of the aqueous mobile phase was varied from
5.7 to 6.1, with the target pH being 5.9. Some of the specific system suitability
parameters and acceptance criteria that were set included tailing factors (5%
peak height), retention time windows for peaks A and B, and sensitivity
requirement. Some of the selected system suitability parameters were set to
the following:
METHOD DEVELOPMENT APPROACHES 389
System Suitability Parameters
•
Tailing factor (5% peak height) for peak B ≤ 1.5
•
Tailing factor (5% peak height) for peak A ≤ 1.5
•
Rt for peak A must be 12.0 ± 1.3 min
•
Rt for peak B must be 21 ± 1.0 min
•
The S/N of the LOQ solution (0.05%) for both actives A and B must be
≥10:1
In the second example, if it is known that a potential degradation product can
occur and will elute close to the active, a resolution requirement should be set
for this critical pair.When trying to set a resolution requirement between crit-
ical pairs of impurities, standard samples containing the critical pair should be
readily available. However, standard samples may not be available with all
critical impurities so the standard may be spiked with authentic impurities. If
authentic impurities are not available or are in limited quantity, then the drug
substance may be degraded in solution using mild stress conditions to produce
a decomposition product or products that can be used to define a resolution
requirement for a critical pair. The mild stress conditions should produce
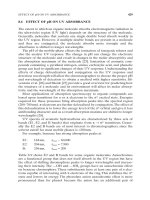
decomposition products in situ in a fast time scale. In the following example
in Figure 8-23, the drug substance was stressed with 3% hydrogen peroxide
for 1 hr at 25°C and 80°C to generate impurity A. At 80°C, suitable degrada-
tion was obtained to determine the resolution requirement between impurity
A and the active B (target analyte). This requirement was set because it was
postulated that this drug substance could be readily oxidized. Indeed in
solid state stability studies, minor amounts of the impurity A (oxidized impu-
rity) were observed under accelerated conditions (40°C/75% RH, 3 months).
390 METHOD DEVELOPMENT
Figure 8-22. Waters XBridge 150- × 3.0-mm, 3.5-µm C18 column. Column temperature
40°C [(A) 90%: 20 mM ammonium phosphate buffer: 10% MeCN, (B) 100% MeCN].
Gradient: 10% A to 85% B over 38 min. Flow: 0.6 mL/min.
Another example in regard to in situ degradation for generation of a system
suitability sample is given in the literature [24].
8.5.4 Case Study 1: Method Development for a Zwitterionic Compound
Method development for the analysis of a zwitterionic drug substance by
reversed-phase HPLC was undertaken.The zwitterionic compound A contains
an acidic functionality, (
w
w
pK
a
4.0) and a basic functionality (
w
w
pK
a
3.0). Both of
these pK
a
values were determined using ACD Labs (Advanced Chemistry
Development, Toronto, Canada) software. Given this information, the chro-
matographer could apply the pH and pK
a
selection rules (including pH and
pK
a
shifts) outlined in Sections 4.5 and 4.6 in Chapter 4 to select the optimal
pH to work at in order to avoid working near the pK
a
values of either of
the ionizable functionalities. The following case study will illustrate (a) why
working at pH values at or near the pK
a
values of the API will lead to sepa-
rations that may not be robust and (b) what influence the pH has on the inher-
ent retention of intermediate compound A and related synthetic by-products.
These experiments could be conducted as an exercise to further understand
the effect of pH on the retention of the species in the sample of interest since
the synthetic by-products may have different ionizable functionalities then the
parent compound (intermediate).
METHOD DEVELOPMENT APPROACHES 391
Figure 8-23. In situ degradation for generation of system suitability solution.
8.5.4.1 Gradient Screening. An initial method development was performed
using a Phenomenex Luna C18 (2) column with acetonitrile as the organic
mobile-phase component, and the aqueous portion was a 10 mM ammonium
monohydrogen phosphate buffer adjusted to pH 2 with phosphoric acid. Ini-
tially, a linear gradient was used from 60% to 80% MeCN with a hold at 80%
MeCN for 10 minutes. An early eluting component was observed close to the
void volume using this probe gradient. Also, no peaks were seen to elute
during the 80% MeCN isocratic hold. Therefore, a new gradient method
(shown in Figure 8-24) with an initial isocratic hold to retain the more polar
species and removal of the latter isocratic hold at 80% MeCN was used. The
new method employed an isocratic hold at 50% MeCN for 5 min, and then a
linear gradient was run from 50% MeCN to 80% MeCN from 5 to 25 minutes.
Note that a 150- × 4.6-mm column was used, but a 150- × 3.0-mm could have
been easily used with proper adjustment of the flow rate.
8.5.4.2 pH Screening Study. Once the probe gradient method is selected, a
pH study can be conducted. The pH study in gradient mode was carried out
using 10 mM ammonium monohydrogenphosphate as a buffer. The
w
w
pH of the
aqueous portion of the eluent was adjusted to 2, 3, 4, 5, 6, and 7 with phos-
phoric acid. Phosphate is not a buffer at pH 4 and 5, but this is only used for
the pH screening experiment. In the event that pH 4 or 5 was deemed accept-
able for the separation, a suitable buffer that has buffering capacity in that
392 METHOD DEVELOPMENT
Figure 8-24.
w
w
pH study on zwitterionic compound A on a Phenomenex Luna C18 (2)
column. Method conditions are indicated in the figure.