Tài liệu Evolving the neural network model for forecasting air pollution time series pdf
Bạn đang xem bản rút gọn của tài liệu. Xem và tải ngay bản đầy đủ của tài liệu tại đây (421.57 KB, 9 trang )
Engineering Applications of Artificial Intelligence 17 (2004) 159–167
Evolving the neural network model for forecasting
air pollution time series
Harri Niska
a,
*, Teri Hiltunen
a
, Ari Karppinen
b
, Juhani Ruuskanen
a
, Mikko Kolehmainen
a
a
Department of Environmental Sciences, University of Kuopio, P.O. Box 1627, Kuopio FIN-70211, Finland
b
Finnish Meteorological Institute, Sahaajankatu 20 E, Helsinki FIN-00880, Finland
Abstract
The modelling of real-world processes such as air quality is generally a difficult task due to both their chaotic and non-linear
phenomenon and high dimensional sample space. Despite neural networks (NN) have been used successfully in this domain, the
selection of network architecture is still problematic and time consuming task when developing a model for practical situation. This
paper presents a study where a parallel genetic algorithm (GA) is used for selecting the inputs and designing the high-level
architecture of a multi-layer perceptron model for forecasting hourly concentrations of nitrogen dioxide at a busy urban traffic
station in Helsinki. In addition, the tuning of GA’s parameters for the problem is considered in experimental way. The results
showed that the GA is a capable tool for tackling the practical problems of neural network design. However, it was observed that the
evaluation of NN models is a computationally expensive process, which set limits for the search techniques.
r 2004 Elsevier Ltd. All rights reserved.
Keywords: Feed-forward networks; Time series forecasting; Parallel genetic algorithms; Urban air pollution
1. Introduction
The forecasting of air quality is one of the topics of air
quality research today due to urban air pollution and
specifically pollution episodes i.e. high pollutant con-
centrations causing adverse health effects and even
premature deaths among sensitive groups such as
asthmatics and elderly people (Tiittanen et al., 1999).
A wide variety of operational warning systems based on
empirical, causal, statistical and hybrid models have
been developed in order to start preventive action before
and during episodes (Schlink et al., 2003). In recent
years, the considerable progress has been in the
developing of neural network (NN) models for air
quality forecasting (Gardner and Dorling, 1999; Koleh-
mainen et al., 2001; Kukkonen et al., 2003).
Despite the latest progress, there still exist some
general problems that must be solved when developing a
NN model. In the air quality forecasting, especially, the
selection of optimal input subset (Jain and Zongker,
1997; John et al., 1994) becomes a tedious task due to
high number of measurements from heterogeneous
sources and their non-linear interactions. Moreover,
due to a complex interconnection between the input
patterns of NN and the architecture of NN (related to
the complexity of the input and output mapping, the
amount of noise and the amount of training data), the
selection of NN architecture must be done simulta-
neously. These aspects requires the formulation of
search problem and the investigation of search techni-
ques which are capable of facilitating model develop-
ment work and resulting more reliable and robust NN
models.
In this context, the evolutionary and genetic algo-
rithms (GA) (Holland, 1975) have proven to be power-
ful techniques (Yao, 1999) due to their ability to solve
linear and non-linear problems by exploring all regions
of the state space and exploiting promising areas
through genetic operations. The main drawbacks related
to the using of GAs for optimising NNs have been high
computational requirement and complex search space
(Miller et al., 1989), which are due to the randomly
directed global search and the stochastic nature of NNs.
In order to overcome these problems, there have been
considerable efforts to find the computationally efficient
set of control parameters (De Jong, 1975; Grefenstette,
1986; B
.
ack et al., 1997; Eiben et al., 1999), to utilise
ARTICLE IN PRESS
*Corresponding author. Fax: +358-17-163191.
E-mail address: harri.niska@uku.fi (H. Niska).
0952-1976/$ - see front matter r 2004 Elsevier Ltd. All rights reserved.
doi:10.1016/j.engappai.2004.02.002
parallel computing techniques (Cant
!
u-Paz, 1995)andto
minimise computational burden related to the fitness
evaluation of NNs (Yao, 1999). The fitness evaluation
has been generally done by using some fitness approx-
imation approach rather than exact computing despite
the risk of biased estimates.
The objective of this work was to investigate the
capability of coarse-grained GA (migration model;
Section 2.3) within the design of NN model for
forecasting next day air quality (Nitrogen dioxide
(NO
2
)) at urban traffic station in Helsinki. The model
considered was the fully connected multi-layer percep-
tron (MLP) which was trained and evaluated with four
years of observational data (Sections 2.1 and 2.6) and
using the practice discussed later in Section 2.2. The
search was focused on the architectural issues of the
MLP (Section 2.4), because it is still unclear how
these issues affect the capability of MLP to forecast
concentrations. In addition, the meta-evolutionary
approach was experimentally used for tuning the
coarse-grained GA (Section 2.5) in order to maximize
search efficiency which was valuable in terms of
computational requirements. Finally, the evolutionary
design of NNs was repeated multiple times and results
were validated and assessed in terms of general and
episode (model’s capabilities in episodic situations)
performance (Section 2.7).
2. Materials and methods
2.1. Experimental data
The test data selected to be considered in this study
was extracted from the APPETISE
1
(Air pollution
Episodes: Modelling Tools for Improved Smog Man-
agement, database.
The data set comprised the concentrations of airborne
pollutants and meteorological soundings and observa-
tions, monitored in Helsinki metropolitan area during
the years 1996–1999. The data quality was examined
and the fairly small fraction (ranged from 1% to 5%) of
missing concentration data was obtained. The missing
values were imputed using the hybrid method, i.e., a
combination of linear interpolation and self-organizing
map (Junninen et al., 2004) which is applied earlier in
this domain by Kukkonen et al. (2003) and Schlink et al.
(2003). The purpose of data imputation was to allow a
consistent and fair model comparison exercise.
2.1.1. Concentration data
The concentration data comprised the hourly con-
centration of NO
2
,NO
x
,O
3
,PM
10
,SO
2
and CO
monitored (processed according to routine quality
control and quality assurance procedures employed by
the Environmental Office of the Helsinki Metropolitan
Area Council) at the urban air quality monitoring
station in T
.
o
.
ol
.
o (in Helsinki central). The station under
consideration is permanently located (in the middle of a
busy junction; not in a street canyon) and represents one
of the most polluted parts of the city.
2.1.2. Meteorological data
The pre-processed meteorological data, based on a
combination of the data from synoptic stations at
Helsinki–Vantaa airport (about 15 km north of Helsinki
downtown) and Helsinki–Isosaari (an island about
20 km south of Helsinki), was selected to be used in
this study, as it is best representative for the whole of the
urban area and contains also relevant derived atmo-
spheric turbulence parameters. The mixing height (the
depth of the unstable air in atmospheric boundary layer)
and turbulence parameters were evaluated using a
meteorological pre-processing model (Karppinen et al.,
1997) based on the sounding observations at Jokioinen
(90 km northwest of Helsinki) and the routine meteor-
ological observations. For a detailed description of the
data sets, the reader is referred to Kukkonen et al.
(2003).
2.2. Multi-layer perceptron model
The forecasting of air quality can be considered as a
non-linear regression problem between predictors (such
as meteorological and air quality variables) and
predictand (in this case, hourly concentration). Neural
networks, in particular the multi-layer perceptron
(Hornik et al., 1989), provide a flexible and non-linear
tool for tackling regression problems in the air quality
modelling (Gardner and Dorling, 1999). There are
arguments, which both support and explain the wide
use of the MLP in that domain. Primarily, extremely
non-linear relationships exist in the real world and it is
inappropriate to attempt to understand these problems
using traditional regression. Moreover, it has been
shown that the MLP can be trained to approxi-
mate any smooth, measurable (highly non-linear)
function without prior assumptions concerning the data
distribution.
On the ground of these aspects, the MLP was chosen
to be considered in this study. The MLP was applied for
prediction by training the network to output the next
day value of NO
2
(T+24 h, where T is the forecasting
point) of a forecasted pollutant, given an input vector
containing earlier air quality measurements at T+0 h
and weather observations at T+24 h (simulating a
weather forecast). In the training early stopping strategy
was used instead of using regularisation techniques
(Kukkonen et al., 2003) because of lower time require-
ment. The early stopping was adopted by using the
ARTICLE IN PRESS
1
IST 1999-11764, EC framework V programme.
H. Niska et al. / Engineering Applications of Artificial Intelligence 17 (2004) 159–167160
validation set 30/70 to assess the generalisation ability
during training. The training was stopped when the
validation error increased for five iterations and the
weights and biases at the minimum of the validation
error were utilised. As the training parameters, 1000
epochs, scaled conjugate gradient back-propagation,
sigmoid transfer functions for hidden units and linear
transfer function for output were used.
2.3. Coarse-grained genetic algorithm
Parallel techniques (Cant
!
u-Paz, 1995), such as coarse-
grained GA (regional/migration model), which support
the using of several processors have been developed
mainly for decreasing high computational requirements
but also for simulating natural evolution in more detail.
Compared to the pure GA (Holland, 1975), which
operates on fixed-sized population using three main
operators: selection, crossover and mutation, the coarse-
grained GA divides population into a few subpopula-
tions which are kept relatively isolated from each other.
The new operations namely migration and competition
between subpopulations are used for exchanging in-
dividuals between populations. For more details, please
refer to Cant
!
u-Paz (1995).
It is argued that the parallelisation not only decrease
computation time, but also decrease objective function
evaluations when compared a single population algo-
rithm (Pohlheim, 2000). Consequently, even a single
processor computer can deliver better results by
implementing the parallel algorithm in a pseudo-
parallel. In this context, the utilisation of the parallel
GA in the design process of NNs becomes interesting.
2.4. Problem formulation—encoding
An important phase related to the evolutionary search
is to define (encode) the problem in a proper manner.
This is important because in a poor encoding, the search
might be confined in a certain area of the search space
and consequently, stuck in a local minimum. Numerous
encoding approaches, such as direct where each
phenotypic feature is encoded by exactly one genotypic
code, and indirect encoding where only some character-
istics are encoded, are presented and tested in the
evolution of NN models (Yao, 1999). The trend
has been towards indirect encoding due to its better
scalability for example, but the direct encoding
can be suitable for the precise and fine-tuned search
of NNs.
In this work, we focused on the search of high-level
architecture of MLP namely the inputs and hidden
layers. The design of low-level architecture (connections
and transfer functions by node), or any other para-
meters such as learning algorithms were not considered.
A combination of direct and indirect encoding was
utilised by using a parametric binary representation
where the number of hidden neurons was within the
range of 1–31 on a layer, the number of hidden layers
was one or two, and network inputs (the number of
inputs varied 1–49) exist (Fig. 1). The Gray coding
2
was
used in the encoding of number of hidden neurons in
order to achieve smooth evolutionary landscape.
2.5. Selection of efficient search parameters
For maximising the search efficiency, the optimum
distribution parameters (populations, migration and
competition) of coarse-grained GA were searched by
using the meta-evolutionary approach (Grefenstette,
1986). In this scheme, two genetic algorithms namely a
meta-level one (MGA) and a base-level one (BGA)
exist; the BGA (parameters under tuning) undergoes
evolutionary process which is controlled by the MGA
(Fig. 2). The parameters selected for tuning were the
ARTICLE IN PRESS
b
12
b
13
b
14
• • • b
60
b
1
b
2
b
3
b
4
b
5
b
6
b
7
b
8
b
9
b
10
b
11
(1-2)
hid.layers
hid.neurons on
layer 1 (1-31)
hid.neurons on
layer 2 (1-31)
model inputs
(1-49)
Fig. 1. The encoding practice used (parametric binary presentation)
where bn is the n bit (0/1). The number of hidden layers is derived from
the first bit (0=1 hidden layer, 1=2 hidden layers), the number of
hidden neurons is derived via the Gray transformation and inputs
selected to the model simply from the bits (0=absence and
1=presence).
;;
the control parameters defined on the
Metal-level GA
ground of the GEATbx standard settings for real/integer
valued genes; the search problem (BGA) encoded into
F
1
integer gene.
F2
Base-level GA;
populations, migration
and competion
(parameters under
tuning) are controlled
by the MGA; other
search parameters are
the same as in the
MGA;
Numerical test problem
Langermann's 10-
dimensional(N=10)
multimodal test
function with
empirically defined
optimum
Fig. 2. The tuning of control parameters by using meta-evolutionary
technique where F
1
is the fitness function of the meta-level (the number
of objective function evaluations) and F
2
the fitness function of the
base-level (Langermann’s multimodal test function).
2
The Gray coding is a method for transforming a function mapping
such that binary representations of consecutive numerical values differ
by a single bit.
H. Niska et al. / Engineering Applications of Artificial Intelligence 17 (2004) 159–167 161
number of populations (1–10), the number of indivi-
duals (1–50) in migration interval (1–50), migration rate
(0–100% of population), competition interval (1–50)
and competition rate (0–100%).
2.5.1. Meta-level GA
The MGA complied with the idea of coarse-grained
GA with the parameters defined on the ground of
GEATbx ( standard settings
for integer/real-valued optimisation problems (Pohl-
heim, 2000). Four subpopulations with total population
size of 90 were evolved (500 generations) using
unconstrained migration (rate of 0.1) every 20th
generation (exchanging the best individuals in complete
net structure) and mutation with rate of 1 (a mutation
per individual) and mutations steps of 0.1 (rough), 0.03
(standard), 0.01 (fine) and 0.003 (very fine). The
selection of individuals (BGAs) for recombination was
done using stochastic universal sampling (provides zero
bias and minimum spread) and the recombination using
the discrete recombination of real/integer valued genes.
2.5.2. Base-level GA
The BGA was encoded at the meta-level into the six-
dimensional integer-valued gene, in which each geno-
typic code represented the value of control parameter
under tuning. The parameters of the BGA, excluding the
parameter under tuning (controlled by the MGA), were
the same as in the MGA (for real/integer-valued
problem). As the fitness of the BGA (meta-fitness), the
average (three independent runs) number of objective
function evaluations F
1
for reaching a defined optimum
(in a test problem discussed later) was used. The BGA
candidates, which were not able to convergence into the
optimum within defined 5000 objective function
calculations, were penalised with the difference
between achieved value and a global minimum of a test
problem.
2.5.3. Test problem
The use of a real control systems and particularly
systems based on the training of NNs at the base-level is
impractical due to the requirements of low computation
time. However, it is important that a problem at the
base-level corresponds to the problem under optimisa-
tion in order to achieve valid results. For selecting a
feasible test problem, we evaluated a relatively large
MLP population with random MLP inputs and
architectures, and used Sammon’s gradient method
(Sammon, 1969) to visualise the form of multidimen-
sional fitness landscape in two dimensions. On the
ground of this information, we decided to use the
multimodal test function of Langermann (Bersini et al.,
1996) to be considered as the test problem at the base-
level.
f ðxÞ¼ À
X
m
i¼1
c
j
exp À
1
p
X
N
j¼1
ðx
j
À a
ij
Þ
2
!
 cos p
X
N
j¼1
ðx
j
À a
ij
Þ
2
!!
; ð1Þ
where m=30, N=10 and 0px
i
p10. The real valued
matrix A=a
ij
is not presented here due to space
requirement; the reader is referred to Bersini et al.
(1996).
The global optimum of the function is À1.4, which
seemed to be very difficult to reach even by using the
huge populations. Also, it was detected, that in most
cases, test runs trapped on the local optima of À0.42863
and in some cases, reached the local optima of
À0.80600. When the reaching global optimum proved
a complex task, the local optima of À0.80600 was
considered as the sufficient optimum for the problem. It
is probably, that the BGA reaching the proposed
optimum (not trapped on À0.42863), have some hill-
climbing abilities which can be useful in the real-world
case.
2.5.4. Selected parameters
The tuning results indicated that even relatively small
populations can be capable of reaching the defined
optimum within the given limit of objective function
calculations (5000). However, the meta-evolutionary
approach proved extremely noisy due to the nature of
assessment of meta-level fitness. For the same solution
(BGA), one could obtain many different values of the
meta-fitness. Therefore, the tuning of control parameter
became a largely empirical task, in which the results of
the meta-tuning, traditional hand-tuning and the
literature were used.
Finally, two subpopulations (15, 15) with total size of
30 with migration interval of 15, migration rate of 10%,
mutation (binary) rates of 1 and 2 (mutations per
individual), double point crossover (suitable for binary
gene) and selection of stochastic universal sampling were
chosen to be considered as search parameters. The
competition operation between populations was not
adopted. The overall size of populations (30) was kept
relatively small due to the computational issues and so
the risk of poor convergence arises. However, when
comparing the population size to some earlier studies
(Grefenstette, 1986), the population size near 30 has
proven to be adequate.
2.6. Fitness assessment of MLP model
The evaluation (fitness assessment) of MLP models
was carried out in straightforward manner by running
the real system for each model five times (in order to
ARTICLE IN PRESS
H. Niska et al. / Engineering Applications of Artificial Intelligence 17 (2004) 159–167162
minimise fluctuation). The data from the years 1996–
1998 was used as training data and data from the year
1999 as model validation data. This approach was
computationally expensive due to long training times of
NN models. However, it was utilised because it was
anticipated to yield more reliable estimates for model
fitness compared to approaches based on fitness
approximation. In order to get around the computa-
tional requirements, we decreased the amount of data
used in the training (10% random sample of training
data).
The fitness of model was assessed from the observed
and predicted values by calculating the index of
agreement (IA) (Eq. (2)), which is a dimensionless
measure limited to the range of 0–1 and thus, allows
the comparison of different models (Willmott et al.,
1985).
IA ¼ 1 À
P
N
i¼1
ðP
i
À O
i
Þ
2
P
N
i¼1
ðjP
i
À
%
OjþjO
i
À
%
OjÞ
2
"#
; ð2Þ
where N is the number of data points, O
i
the observed
value, P
i
the predicted value and
%
O is the average of the
observed data. The final estimate of model goodness
(fitness function, F) was then calculated as the average
IA of five runs,
F ¼
X
N
i¼1
ð1 À IAÞ=N; ð3Þ
where N is the number of runs and the IA is scaled to the
range from 0 (maximum performance) to 1 (minimum
performance).
2.7. Model evolution runs and validation
Finally, the coarse-grained GA with the selected
parameters (Section 2.5) was used for evolving the
MLP for the forecasting problem (Fig. 3). The starting
populations were initialised with the random set of MLP
models (see the encoding in the Section 2.4) and 150
generations were executed with elitism. A series of 10
independent runs were performed in order to minimise
the risk of poor convergence.
After that, the performance of evolutionary approach
was verified by evaluating a reference model and
evaluated models multiple times (5) using all the data
from the years 1996–1998 in the training (during
evolution 10% random sample was used). In the
reference model, all variables were included as inputs
and parameters were selected based on experience and
knowledge (Kolehmainen et al., 2001). The parameters
used were 25 hidden neurons, learning algorithm of
scaled conjugated gradient back-propagation, the per-
formance function of regularized mean squared error
(RMSE), hyperbolic sigmoid tangent for the hidden
layers and linear for the output layer.
The performance assessment was performed in the
context of general performance (IA) and exceedance
performance. The latter was calculated in order to get
better understanding of the model’s capabilities in the
episodic situations. Statistical measures selected for
exceedance assessing were the success index (SI) which
has been detected to be able to represent performance in
exceedance forecasting as well as the overall goodness
between predicted and observed data (Schlink et al.,
2003) and the fraction of false alarms (FA). In the
calculations, the threshold value of 100 mg/m
3
(the
national guideline is 70 mg/m
3
) was used for an
ARTICLE IN PRESS
Evaluation (Eq.3) of
randomly initialised
populations (15, 15)
Generation
150
Selection of parents
using stochastic
universal sampling
Competition of
populations was not
utilised
Migration within the
interval of 15 gen. and
rate of 0.1
Reinsertion of
offsprings with elitism
Evaluation of
offsprin
g
s (Eq.3)
Binary mutation with
rates 0.02 and 0.04
Recombination of
parents using double
point crossover
Terminate after
150 generations
<
Fig. 3. The main stages and operations in the migration GA used for
evolving the MLP models.
0 50 100 150
0.16
0.15
0.14
0.13
0.12
0.11
0.1
Generations
Fitness(F)
Fig. 4. Convergences resulting in the evolutionary model design.
H. Niska et al. / Engineering Applications of Artificial Intelligence 17 (2004) 159–167 163
exceedance and the SI and the FA were derived as
follows:
SI ¼ TPR À FPR ð4Þ
where TPR=A/M,(0pTPRp1), FPR=(FÀA)/
(NÀM), (0pFPRp1),
FA ¼ðF À AÞ=F; ð5Þ
ARTICLE IN PRESS
Table 1
The optimised models achieved in the optimisation runs (1–10). The chosen inputs are marked with ‘x’ and strongly relevant variables are shaded
H. Niska et al. / Engineering Applications of Artificial Intelligence 17 (2004) 159–167164
where the fraction of correctly predicted exceedances
(TPR, true positive rate) represents the sensitivity of
model and the false positive rate (FPR) the specificity of
model. In the equations, A is the correctly predicted
exceedances, M is all observed exceedances, F is all
predicted exceedances and N is the total number of
observations.
3. Results
3.1. Evolved MLP models
The results obtained in the evolutionary runs are
illustrated in Fig. 4 and Table 1. In all the cases,
maximum fitness values (Eq. (3)) of evaluated models
were of the order 0.11 (IA=0.89). When considering the
architectures (Table 1), remarkable variations can be
seen. Particularly, it can be observed that even a
relatively small amount of hidden neurons is sufficient
in the case of two hidden layers (9–1 and 13–1).
This is largely due to the universal approximator
theorem (Hornik et al., 1989), which states that a two-
hidden layer network may achieve the same accuracy
with a single hidden layer neural network with fewer
hidden layer neurons. However, the use of two
hidden layers did not improve the capability of MLP
considerably.
When considering the results in the context of input
subsets, strongly relevant, weakly relevant and irrelevant
inputs (John et al., 1994) can be detected. As expected,
some timing (hour, week day), pollution (NO
2
and O
3
at
T+0) variables were selected with high probability due
to their strong association with the temporal variation
of traffic (the most important source of pollution).
Similarly, some meteorological parameters (wind direc-
tion, wind speed, temperature, solar evaluation, friction
velocity) which determine the atmospheric dispersion
conditions were found to be strongly relevant. Addi-
tionally, there was set of weakly relevant variables which
were also needed in the forecasting and some irrelevant
or disturbing ones (week end, state of ground) which
were not needed. Finally, it can be concluded that
roughly 20710 from total of 49 inputs included
adequate information for achieving the performance
described in the results.
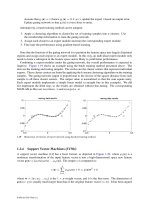
3.2. Validation statistics
The validation statistics is presented for each model
and the reference models in Table 2 and the scatter plots
(forecasted versus observed) in Fig. 5. Compared to the
reference model, a slight increase in the performances
was detected in terms of general performance (IA).
When considering the exceedance performances (SI and
FA) of the evolved models, a moderate improvement
was achieved. However, the consideration of SI and FA
proves clearly, that after the optimisation, the capability
of MLP for forecasting exceedances was still somewhat
poor (SI varied 0.11–0.28) including the large fraction of
false alarms (roughly 40–70%). Moreover, Fig. 4
demonstrates that the models clearly underpredicted
high concentrations (>100 mg/m
3
) which can be seen in
Table 2 as poor SI indices. Therefore, it can be stated the
evolving of model inputs and high-level architecture
itself could not improve the performances of the models
significantly. However, more robust and reasonable
models were produced, that are very important features
in practical applications.
4. Conclusions
In this paper a genetic algorithm was tested for
designing the multi-layer perceptron model for forecast-
ing urban air pollution. The results showed that GA is
ARTICLE IN PRESS
Table 2
The validation results of the optimised models (1–10) and the reference model when testing models multiple times. The minimum and maximum
indices are in bold
Model IA SI FA (%)
Min Max Mean Std Min Max Mean Std Min Max Mean Std
1 0.911 0.913 0.912 0.001 0.12 0.19 0.16 0.03 43.8 65.5 55.2 7.8
2 0.903 0.910 0.907 0.003 0.10 0.23 0.15 0.05 50.0 75.0 65.1 10.0
3 0.902 0.912 0.907 0.004 0.16 0.23 0.18 0.03 43.5 65.4 56.3 8.3
4 0.898 0.912 0.906 0.006 0.16 0.24 0.21 0.04 47.1 53.6 49.7 2.9
5 0.896 0.910 0.905 0.005 0.10 0.23 0.18 0.05 57.1 76.9 65.7 7.9
6 0.910 0.914 0.912 0.002 0.16 0.19 0.17 0.02 43.8 54.6 47.4 4.4
7 0.907 0.911 0.908 0.001 0.11 0.19 0.15 0.03 45.0 67.9 54.6 10.1
8 0.903 0.906 0.905 0.002 0.12 0.21 0.18 0.04 56.5 70.0 60.5 5.5
9 0.909 0.914 0.912 0.002 0.12 0.19 0.16 0.03 47.1 60.9 54.4 5.9
10 0.903 0.908 0.906 0.002 0.19 0.28 0.22 0.03 61.0 69.4 65.0 3.9
REF 0.892 0.902 0.897 0.004 0.05 0.14 0.09 0.03 42.9 78.6 61.9 15.2
REF—reference model.
H. Niska et al. / Engineering Applications of Artificial Intelligence 17 (2004) 159–167 165
an applicable technique in this domain; it is capable of
searching feasible high-level architectures and particu-
larly reducing the need of computational efforts by
eliminating irrelevant inputs. In the case of air quality
forecasting this can also imply smaller costs due to the
smaller amount of measurements required. No clear
connection between architectural issues and perfor-
mance was found, so it is reasonable to use somewhat
ARTICLE IN PRESS
Fig. 5. Plots of forecasted versus observed values (mg/m
3
) by the reference model (‘‘Ref.’’) and the evolved models (1–10). The plots are further
enhanced with a least-squares fitting line (dotted) and a line showing perfect fit (solid).
H. Niska et al. / Engineering Applications of Artificial Intelligence 17 (2004) 159–167166
simpler architecture instead of complex one in order to
minimise the risk of noise over-fitting.
Further research will be focused particularly on the
fitness evaluation of NN models, in the context of
minimising computational cost. Solutions for that could
be a fitness approximation based approach where e.g. a
simpler form of model, which can be evaluated quickly
during the evaluation phase. Additionally, it was
detected that the evolution of MLP inputs and
architecture itself did not improve the ability of the
MLP to forecast high concentrations significantly,
which is largely due to the under-representation of these
cases in training data (in this case about 1% of all
training instances). Therefore, further work is needed on
issues such as boosting, where the frequency of high
concentration values is increased, enhancing the error
term by using some regularization technique and
recurrent neural networks, where the temporal patterns
are better considered.
Acknowledgements
This research was funded by the Academy of Finland
(FORECAST, Project No. 49946) and utilised the
findings and database of EU funded project APPETISE
( />References
B
.
ack, T., Fogel, D., Michalewicz, Z., 1997. Handbook of Evolutionary
Computation. Institute of Physics Publishing Ltd., Bristol and
Oxford University Press, New York.
Bersini, H., Dorigo, M., Langerman, S., Seront, G., Gambardella, L.,
1996. Results of the first international contest on evolutionary
optimisation. In: Proceedings of the Third IEEE Conference on
Evolutionary Computation, pp. 611–615.
Cant
!
u-Paz, E., 1995. A summary of research on parallel genetic
algorithms. Technical Report IlliGAL No. 95007, University of
Illinois at Urbana-Champaign.
De Jong, K.A., 1975. Analysis of the behaviour of a class of genetic
adaptive systems. Ph.D. Thesis, Department of Computer and
Communication Sciences, University of Michigan.
Eiben, A.E., Hinterding, R., Michalewicz, Z., 1999. Parameter control
in evolutionary algorithms. IEEE Transactions on Evolutionary
Computation 3 (2), 124–141.
Gardner, M.W., Dorling, S.R., 1999. Artificial neural networks (the
multi-layer perceptron)—a review of applications in the atmo-
spheric sciences. Atmospheric Environment 33, 709–719.
Grefenstette, J., 1986. Optimization of control parameters for genetic
algorithms. IEEE Transaction on Systems, Man, and Cybernetics
16 (1), 122–128.
Holland, J.H., 1975. Adaptation in Natural and Artificial Systems.
University of Michigan Press, Ann Arbor.
Hornik, K., Stinchcombe, M., White, H., 1989. Multilayer feedfor-
ward networks are universal approximators. Neural Networks 2,
359–366.
Jain, A., Zongker, D., 1997. Feature selection: evaluation, application
and small sample performance. IEEE Transactions on Pattern
Analysis and Machine Intelligence 19 (2), 153–158.
John, G.H., Kohavi, R., Pfleger, K., 1994. Irrelevant features and the
subset selection problem. In: Cohen, W., Hirsh, H. (Eds.), The 11th
International Conference on Machine Learning. Morgan Kaufman
Publishers, San Francisco, CA.
Junninen, H., Niska, H., Tuppurainen, K.,Ruuskanen, J., Kolehmai-
nen, M., 2004. Methods for imputation of missing values in
air quality data sets. Atmospheric Environment, accepted for
publication.
Karppinen, A., Joffre, S., Vaajama, P., 1997. Boundary layer
parametrization for Finnish regulatory dispersion models. Inter-
national Journal of Environment and Pollution 8, 557–564.
Kolehmainen, M., Martikainen, H., Ruuskanen, J., 2001. Neural
networks and periodic components used in air quality forecasting.
Atmospheric Environment 35, 815–825.
Kukkonen, J., Partanen, L., Karppinen, A., Ruuskanen, J., Junninen,
H., Kolehmainen, M., Niska, H., Dorling, S., Chatterton, T.,
Foxall, R., Cawley, G., 2003. Extensive evaluation of neural
networks of NO
2
and PM
10
concentrations, compared with a
deterministic modelling system and measurements in central
helsinki. Atmospheric Environment 37, 4539–4550.
Miller, G., Todd, P., Hedge, S., 1989. Designing neural networks using
genetic algorithms. In: Schaffer, J. (Ed.), The Third International
Conference on Genetic Algorithms and Their Applications, CA,
San Mateo.
Pohlheim, H., 2000. Tutorial for the genetic and evolutionary
algorithm toolbox for use with MATLAB (GEATbx) version
3.30, .
Sammon Jr., J.W., 1969. A nonlinear mapping for data structure
analysis. IEEE Transactions on Computers C-18 (5), 401–409.
Schlink, U., Dorling, S., Pelikan, E., Nunnari, G., Cawley, G.,
Junninen, H., Greig, A., Foxall, R., Eben, K., Chatterto, T.,
Vondracek, Richter, M., Dostal, M., Bertucco, L., Kolehmainen,
M., Doyle, M., 2003. A rigorous inter-comparison of
ground-level ozono predictions. Atmospheric Environment 37,
3237–3253.
Tiittanen, P., Timonen, K.L., Ruuskanen, J., Mirme, A., Pekkanen, J.,
1999. Fine particulate air pollution, resuspended road dust and
respiratory health among symptomatic children. European Re-
spiratory Journal 12, 266–273.
Willmott, C.J., Ackleson, S., Davis, R., Feddema, J., Klink, K.,
Legates, D., O’Donnell, J., Rowe, C., 1985. Statistics for the
evaluation and comparison of models. Journal of Geophysical
Research 90 (C5), 8995–9005.
Yao, X., 1999. Evolving artificial neural networks. Proceedings of the
IEEE Transactions on Neural Networks 87 (9), 1423–1447.
ARTICLE IN PRESS
H. Niska et al. / Engineering Applications of Artificial Intelligence 17 (2004) 159–167 167