Tổng quan giá vàng trên thế giới
Bạn đang xem bản rút gọn của tài liệu. Xem và tải ngay bản đầy đủ của tài liệu tại đây (4.71 MB, 29 trang )
An Impressionistic View of the “Real” Price of Gold Around the World
Claude B. Erb
Los Angeles, CA 90272
Campbell R. Harvey
Duke University, Durham, NC 27708
National Bureau of Economic Research, Cambridge, MA 02138
The “real” price of gold in the US is historically high, relative to its history as an actively tradable
asset. But what about the real price of gold in other countries? It turns out that, in our
impressionistic sample of 23 countries, the real price of gold is high everywhere. The real price
of gold is high in “troubled” countries as well as in “safe” countries. If the real price of gold is a
barometer of perceived troubles then there is trouble everywhere. Or, alternatively, gold is just
expensive everywhere.
This research is motivated by our earlier paper, Erb and Harvey (2012), The Golden Dilemma,
/>
_______________________
Version: September 18, 2012.
1
Electronic
Electroniccopy
copyavailable
availableat:
at: /> />
Historically, the “real” price of gold, the inflation-adjusted price of gold, has been
predictive of future inflation-adjusted gold returns. Erb and Harvey (2012)1 noted that in the
United States, since 1975, when the real price of gold was above its historical average, future
real returns were below average. Subject to many caveats, it is seems reasonable to ask if the
real price of gold can be thought of as something like the “PE ratio” of the gold market. It may
be a coruscatingly insightful question to ask, or it may be a horrible question to ask. But how
can it hurt to ask? Investors in gold should determine for themselves if gold is like most other
assets, where valuation matters, or if the price of gold is free of any valuation concerns. Just as
the nominal and real yields of bonds differ from one country to another, and just as stock
market price-earnings ratios differ from one country to another, it is certainly possible that
estimates of the real price of gold may differ from country to country. The focus of our paper is
to move beyond a US-centric vision of the real price of gold and to analyze how the real price of
gold has behaved from the perspective of investors in different countries around the world.
By examining the real price of gold in 23 countries, it is possible to form an impressionistic
sense of the answers to a few questions:
Is the real price of gold historically high in some countries and historically low in others?
Across countries, what does the historical price of gold look like when adjusted for
inflation?
Across countries, does the inflation adjusted price of gold have a trend?
There are close to 200 countries in the world, so examining 23 leaves most countries
unexamined. The 23 countries are listed in Table 1. Cumulatively, these countries have a
population of about 4.4 billion people, or about 62% of the total population of the world. The
real price of gold is not directly observable. It must be estimated. We take the approach that it
should be possible to describe a procedure in which anyone should be able to calculate the real
price of gold. To do this we:
i. Look at the price of gold in terms of a country’s local currency
ii. Where necessary we use “old” currencies such as the Deutsche mark, French
franc and Italian lira2
iii. Divide the local currency gold price by that country’s inflation index
1
Erb and Harvey (2012), The Golden Dilemma, at />The exhibits use currency exchange rates provided by Bloomberg. Prior to the introduction of the euro, the
national currency in Germany was the mark. At the time of the conversion of the mark to euros, Bloomberg uses
the official conversion rate of 1.95583 marks per euro. This process makes it possible to maintain a history of
Deutsche mark prices as well as other “old” currencies.
2
2
Electronic
Electroniccopy
copyavailable
availableat:
at: /> />
Table 1: Countries and Inflation and Currency Tickers
Country
1. US
2. Canada
3. Mexico
4. Brazil
5. Argentina
6. UK
7. France
8. Germany
9. Switzerland
10. Spain
11. Italy
12. Denmark
13. Sweden
14. Russia
15. Turkey
16. Egypt
17. South Africa
18. India
19. China
20. Japan
21. Indonesia
22. Australia
23. New Zealand
Inflation
Ticker
Name
Currency
Ticker
Name
Index=
100
Approximate
Population
(millions)
CPI INDX
CACPI
2736639
2236639
2136639
UKRPI
1326639
1346639
GRCPI
SZCPII
1846639
1366639
1286639
1446639
9226639
1866639
4696639
1996639
5346639
ICPECHN
1586639
5366639
AUCPI
1966639
USD
CAD
MXN
BRL
ARS
GBP
FRF
DEM
DEM
CHF
ESP
ITL
DKK
SEK
RUB
TRL
EGP
ZAR
INR
CNY
JPY
IDR
AUD
NZD
Aug-83
Jul-02
Sep-05
Jul-05
Jul-05
Jan-87
Aug-05
Jul-05
Jun-95
Dec-10
May-05
Jul-05
Apr-05
Jun-05
Jun-05
Aug-05
Jul-05
Jul-05
Jul-05
Dec-95
Apr-93
Oct-05
Mar-90
Sep-05
311
34
117
196
41
63
66
82
82
8
47
61
6
9
142
74
83
51
1,241
1,344
128
242
23
4
US CPI Urban Consumers SA
STCA Canada CPI NSA 2002=100
IMF Mexico CPI
IMF Brazil CPI
IMF Argentina CPI
UK RPI All Items NSA
IMF France CPI
IMF Germany CPI
West Germany CPI 1995=100
Switzerland CPI 2010 = 100
IMF Spain CPI
IMF Italy CPI
IMF Denmark CPI
IMF Sweden CPI
IMF Russia CPI
IMF Turkey CPI
IMF Egypt CPI
IMF South Africa CPI
IMF India CPI
IMF China Inflation End of Per
IMF Japan CPI
IMF Indonesia CPI
Australia CPI All Groups Goods
IMF New Zealand CPI
US DOLLAR SPOT
Canadian Dollar Spot
Mexican Peso Spot
Brazilian Real Spot
Argentine Peso Spot
British Pound Spot
French Franc Spot
German Mark Spot
German Mark Spot
Swiss Franc Spot
Spanish Peseta Spot
Italian Lira Spot
Danish Krone Spot
Swedish Krona Spot
Russian Ruble Spot
Old Turkish Lira Spot
Egyptian Pound Spot
S. African Rand Spot
Indian Rupee Spot
China Renminbi Spot
Japanese Yen Spot
Indonesian Rupiah Spot
Australian Dollar Spot
New Zealand Dollar Spot
Data source: Bloomberg
Exhibits 1-46 present the results for the 23 countries. There are two exhibits for each of
the countries. For instance, Exhibit 1 shows the real price of gold from the standpoint of a U.S.
investor. Starting in January 1975, when gold futures contracts commenced trading on the
COMEX, the “spot” price of gold is divided by the level of the U.S. Consumer Price Index (base
year 1982-84=100). Using the U.S. Consumer Price Index is not an endorsement of the accuracy
of the CPI. Nor is the use of any widely available inflation index for any country an endorsement
of the accuracy of that inflation index. Exhibit 1 is simply an illustration of a process using
widely available data.
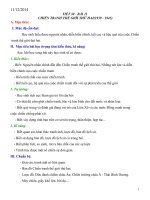
As noted by Erb and Harvey (2012), the real price of gold has fluctuated significantly. The
real price of gold in the U.S. today is almost as high as its level in 1980. This is simply an
observation. Exhibit 1 is a simple at-a-glance way to assess if real gold prices are historically
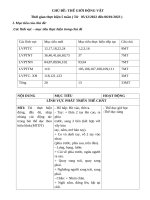
high or low within a country. Exhibit 2 shows the actual, nominal, price of gold in U.S. dollars
over time as well as the inflation-adjusted price of gold. The inflation adjusted price of gold
simply multiplies today’s nominal gold price by the magnitude of inflation between today and
some point in the past. As a result, the inflation adjusted price of gold and the nominal price of
gold converge at the end of the sample. Note that the nominal price of gold has risen
substantially over time. The inflation-adjusted price of gold does not have a trend, though it is
volatile.
3
Electronic copy available at: />
Exhibits 3-46 provide a tour of the real price of gold in the other 22 countries, starting
with the Americas, moving to Europe and then on to Asia.
Given the number of local currency units per ounce of gold varies across countries and
“base dates” vary across countries (the date when an inflation index is set to a value of 100),
these real price ratios are not directly comparable across countries. It is, of course, possible to
compare the real price of gold at different points of time within a country. Though the level of
the real price of gold across countries is not comparable, it is possible to examine all 23
countries to ascertain if the real price is historically high, relative to each country’s own history,
across countries or if the real price of gold is historically high in some countries and historically
low in others.
Our analysis shows that the real price of gold is historically high in all 23 countries.3 It is
possible that the high real prices of gold are more apparent than real.
One of the reasons suggested for investing in gold is a belief that the interests of those
who govern and those who are governed are not aligned. For instance, it has been asserted
that actual inflation in Argentina is much higher than reported inflation4. In a world in which
informed investors and consumers could detect the difference between real and reported
inflation, underreporting the “official” level of inflation could result in what seems to be a high
real price of gold relative to under reported inflation (but not relative to “real” inflation). The
challenge is in the interpretation. It is possible that the real price of gold is high across all 23
countries and that inflation is broadly correctly reported across all 23 countries. Or it is possible
that the high real price of gold across the 23 countries is a sign that informed investors have
seen through the efforts of 23 sovereign states to under-report inflation.
The nominal gold price and inflation adjusted gold price charts for the various countries
seem to echo the experience of the US. Nominal prices have risen over time and inflation
adjusted prices seem to be trendless, though volatile.
It is important to recognize that even though the estimated value of all the gold that is
thought to exist in the world is about $10 trillion, very little of that gold trades in any year 5. The
fact that gold is a large market with relatively little liquidity was alluded to by investor Ray Dalio
(2012) who recently remarked that “…the capacity of moving money into gold in a large
number is extremely limited….the players in the world…that move that money….really don’t
view gold as an effective alternative…..but it could be a barometer…and it is an alternative for
smaller amounts of money”. Gold may be a barometer, but a barometer of what? Is the high
real price of gold a barometer of the ability of investors to “see though” inaccurate official
inflation reports? Or is the high real price of gold a barometer of irrational pessimism?
3
One concern is that our sample is relatively short only beginning with the advent of gold futures trading in 1975.
In unpublished work, we use a time series of the real price of gold from Measuringworth.com that spans 12572012. We find a significant negative relation between current real gold prices and both future 10-year and 100year real gold returns.
4
For instance see David Schweimler (2011), “Argentina’s inflation rate: High, but just how high?”
5
In “Clash of the Cultures”, investor John Bogle observes that U.S. stock market turnover is greater than 200% a
year. The effective “free float” of the gold market is small compared to most equity and fixed income markets.
4
Electronic copy available at: />
Take a look at Table 1. Using one’s own assessment of how the future might unfold,
classify each of the countries as “troubled” or “safe”. Many will classify the U.S. as a “troubled”
country and Switzerland as a “safe” country. Exhibit 1 shows that the real price of gold is
historically high in the U.S. From a U.S. perspective, it is possible to assert that the real price of
gold is high because the US is a “troubled” country with many perceived financial problems.
And as a result, even if the real price of gold is high, gold may seem to offer investors in the U.S.
a way to possibly deal with a “troubled” and possibly inflationary future. Exhibit 17 shows that
the real price of gold is historically high in Switzerland. In fact, the progression over time of the
real price of gold in Switzerland looks much like the progression over time of the real price of
gold in the U.S. If a high real gold price in the U.S. makes sense to some because of the
problems the U.S. faces, is it really possible that the real price of gold is high in Switzerland
because of the many troubling financial problems facing Switzerland? Switzerland is supposed
to be free of many of the financial ills that plague the U.S. In fact it is possible to ask which is
preferable: a cache of gold or a cache of Swiss francs in a Swiss account.6 Hopefully Exhibits 146 will assist investors in individually solving what Erb and Harvey (2012) referred to as the
“Golden Dilemma”.
The real price of gold is high in the United States. The real price of gold is high in at least
22 other countries. If the real price of gold is a useful long-run valuation metric, then it is most
likely useful in thinking about long-horizon rather than short-term real gold returns. A casual,
visual inspection of Exhibits 1-46 suggests that, in the past, the real price of gold mean
reverted7 over a roughly decade long time span. A high real price of gold suggests the possibility
of a long-term real return headwind, not a portent of an imminent crash. There is no shortage
of examples of expensive asset markets becoming even more expensive. For instance, on
December 6, 1996 former Federal Reserve Board chairman Alan Greenspan referred to an
“irrational exuberance” which “unduly escalated” the value of the U.S. stock market. Yet the
US stock market continued to rally through early 2000. Could the nominal and real prices of
gold continue to rise to levels not seen before? Of course.
The American philosopher and essayist George Santayana once suggested that historical
curiosity might have some value:
“Those who cannot remember the past are condemned to repeat it”.
The American journalist H.L. Mencken once supposedly8 commented:
“For every complex problem there is an answer that is clear, simple and wrong”.
Valuation is a complex problem. If valuation matters for gold, then remembering the past is a
way to attempt to avoid future missteps.
6
There is disagreement. For example, in a recent interview, Zug Switzerland-based investor Felix Zulauf opined
that the “…fiat currency, paper currency standard, is in the final stage of a super cycle”. Seeing the very real
possibility of a systemic failure of the global banking system, Zulauf advocates owning physical gold.
7
Mean reversion in a historical sample is easy to estimate precisely, after the fact. How mean reversion will play
out in the future is a guess.
8
The original quote (slightly different from the above) is in Mencken (1917).
5
Electronic copy available at: />
References
Bogle, John. 2011. “The Clash of Cultures”, Journal of Portfolio Management, vol. 37, no. 3
(Spring): 14-28.
Dalio, Ray. 2012. Conversation with Maria Bartiromo at the Council on Foreign Relations,
September 12.
Erb, Claude B. and Campbell R. Harvey. 2012. “The Golden Dilemma”, working paper, SSRN.
Greenspan, Alan. 1996. “The Challenge of Central Banking in a Democratic Society”, lecture,
America Enterprise Institute, December 6.
Mencken, Henry Louis. 1917. “The Divine Afflatus,” New York Evening Mail, November 16.
Santayana, George. 1905. The Life of Reason, Vol. 1, Reason in Common Sense. New York:
Charles Scribner’s Sons.
Zulauf, Felix. 2012. King World News interview, September 15.
6
Electronic copy available at: />
Exhibit 1: USA, The Real Price of Gold
Local Currency Gold Price/Local Inflation Index
10
9
8
7
6
5
4
3
2
1
0
Data source: Bloomberg, IMF. U.S. CPI Urban Consumers, SA. Index=100 in August 1983. Local currency is the U.S. dollar.
Exhibit 2: USA, Actual and Inflation Adjusted Gold Price
Local Currency Actual and Inflation Adjusted Gold Price
Actual Price
Inflation Adjusted Price
2,500
2,000
1,500
1,000
No Trend in Inflation Adjusted Price
y = 0.0028x + 658.17
R² = 0.0011
500
0
Strong Trend in Nominal Price
y = 0.0524x - 1320.3; R² = 0.3975
Data source: Bloomberg, IMF. U.S. CPI Urban Consumers, SA. Index rescaled=1.0 in August 2012. Local currency is the U.S. dollar.
7
Electronic copy available at: />
Exhibit 3: Canada, The Real Price of Gold
Local Currency Gold Price/Local Inflation Index
20
18
16
14
12
10
8
6
4
2
0
Data source: Bloomberg, IMF. Statistics Canada, CPI NSA. Index=100 in July 2002. Local currency is the Canadian dollar.
Exhibit 4: Canada, Actual and Inflation Adjusted Gold Price
Local Currency Actual and Inflation Adjusted Gold Price
Actual Price
Inflation Adjusted Price
2,500
2,000
1,500
1,000
500
0
Data source: Bloomberg, IMF. Statistics Canada, CPI NSA. Index rescaled=1.0 in August 2012. Local currency is the Canadian dollar.
8
Electronic copy available at: />
Exhibit 5: Mexico, The Real Price of Gold
Local Currency Gold Price/Local Inflation Index
300
250
200
150
100
50
0
Data source: Bloomberg, IMF. IMF Mexico CPI. Index=100 in September 2005. Local currency is the Mexican Peso.
Exhibit 6: Mexico, Actual and Inflation Adjusted Gold Price
Local Currency Actual and Inflation Adjusted Gold Price
Actual Price
Inflation Adjusted Price
40,000
35,000
30,000
25,000
20,000
15,000
10,000
5,000
0
Data source: Bloomberg, IMF. IMF Mexico CPI. Index rescaled=1.0 in August 2012. Local currency is the Mexican Peso.
9
Electronic copy available at: />
Exhibit 7: Brazil, The Real Price of Gold
Local Currency Gold Price/Local Inflation Index
30
25
20
15
10
5
0
Data source: Bloomberg, IMF. IMF Brazil CPI. Index=100 in July 2005. Local currency is the Brazilian Real.
Exhibit 8: Brazil, Actual and Inflation Adjusted Gold Price
Local Currency Actual and Inflation Adjusted Gold Price
Actual Price
Inflation Adjusted Price
4,000
3,500
3,000
2,500
2,000
1,500
1,000
500
0
Data source: Bloomberg, IMF. IMF Brazil CPI. Index rescaled=1.0 in August 2012. Local currency is the Brazilian Real.
10
Electronic copy available at: />
Exhibit 9: Argentina, The Real Price of Gold
Local Currency Gold Price/Local Inflation Index
50
45
40
35
30
25
20
15
10
5
0
Data source: Bloomberg, IMF. IMF Argentina CPI. Index=100 in July 2005. Local currency is the Argentinian Peso.
Exhibit 10: Argentina, Actual and Inflation Adjusted Gold Price
Local Currency Actual and Inflation Adjusted Gold Price
Actual Price
Inflation Adjusted Price
9,000
8,000
7,000
6,000
5,000
4,000
3,000
2,000
1,000
0
Data source: Bloomberg, IMF. IMF Argentina CPI. Index rescaled=1.0 in August 2012. Local currency is the Argentinian Peso.
11
Electronic copy available at: />
Exhibit 11: United Kingdom, The Real Price of Gold
Local Currency Gold Price/Local Inflation Index
6
5
4
3
2
1
0
Data source: Bloomberg, IMF. UK RPI All Items, NSA. Index=100 in January 1987. Local currency is the British Pound.
Exhibit 12: United Kingdom, Actual and Inflation Adjusted Gold Price
Local Currency Actual and Inflation Adjusted Gold Price
Actual Price
Inflation Adjusted Price
1,400
1,200
1,000
800
600
400
200
0
Data source: Bloomberg, IMF. UK RPI All Items, NSA. Index rescaled=1.0 in August 2012. Local currency is the British Pound.
12
Electronic copy available at: />
Exhibit 13: France, The Real Price of Gold
Local Currency Gold Price/Local Inflation Index
90
80
70
60
50
40
30
20
10
0
Data source: Bloomberg, IMF. IMF France CPI. Index=100 in August 2005. Local currency is the French Franc, 6.55958 for 1 Euro.
Exhibit 14: France, Actual and Inflation Adjusted Gold Price
Local Currency Actual and Inflation Adjusted Gold Price
Actual Price
Inflation Adjusted Price
10,000
9,000
8,000
7,000
6,000
5,000
4,000
3,000
2,000
1,000
0
Data source: Bloomberg, IMF. IMF France CPI. Index rescaled=1.0 in August 2012. Local currency is the French Franc, 6.55958 for 1 Euro.
13
Electronic copy available at: />
Exhibit 15: Germany, The Real Price of Gold
Local Currency Gold Price/Local Inflation Index
25
20
15
10
5
0
Data source: Bloomberg, IMF. West Germany CPI Index rescaled to splice with IMF Germany CPI. CPI Index=100 in July 2005. Local currency is the German Mark,
1.95583 for 1 Euro.
Exhibit 16: Germany, Actual and Inflation Adjusted Gold Price
Local Currency Actual and Inflation Adjusted Gold Price
Actual Price
Inflation Adjusted Price
3,000
2,500
2,000
1,500
1,000
500
0
Data source: Bloomberg, IMF. West Germany CPI Index rescaled to splice with IMF Germany CPI. Index rescaled=1.0 in August 2012. Local currency is the
German Mark, 1.95583 for 1 Euro.
14
Electronic copy available at: />
Exhibit 17: Switzerland, The Real Price of Gold
Local Currency Gold Price/Local Inflation Index
25
20
15
10
5
0
Data source: Bloomberg, IMF. Swiss CPI. Index=100 in December 2010. Local currency is the Swiss Franc.
Exhibit 18: Switzerland, Actual and Inflation Adjusted Gold Price
Local Currency Actual and Inflation Adjusted Gold Price
Actual Price
Inflation Adjusted Price
2,500
2,000
1,500
1,000
500
0
Data source: Bloomberg, IMF. Swiss CPI. Index rescaled=1.0 in August 2012. Local currency is the Swiss Franc.
15
Electronic copy available at: />
Exhibit 19: Spain, The Real Price of Gold
Local Currency Gold Price/Local Inflation Index
2,500
2,000
1,500
1,000
500
0
Data source: Bloomberg, IMF. IMF Spain CPI. Index=100 in May 2005. Local currency is the Spanish Peseta, 166.386 for 1 Euro.
Exhibit 20: Spain, Actual and Inflation Adjusted Gold Price
Local Currency Actual and Inflation Adjusted Gold Price
Actual Price
Inflation Adjusted Price
250,000
200,000
150,000
100,000
50,000
0
Data source: Bloomberg, IMF. IMF Spain CPI. Index rescaled=1.0 in August 2012. Local currency is the Spanish Peseta, 166.386 for 1 Euro.
16
Electronic copy available at: />
Exhibit 21: Italy, The Real Price of Gold
Local Currency Gold Price/Local Inflation Index
25,000
20,000
15,000
10,000
5,000
0
Data source: Bloomberg, IMF. IMF Italy CPI. Index=100 in July 2005. Local currency is the Italian Lira 1936.27 for 1 Euro.
Exhibit 22: Italy, Actual and Inflation Adjusted Gold Price
Local Currency Actual and Inflation Adjusted Gold Price
Actual Price
Inflation Adjusted Price
3,000,000
2,500,000
2,000,000
1,500,000
1,000,000
500,000
0
Data source: Bloomberg, IMF. IMF Italy CPI . Index rescaled=1.0 in August 2012. Local currency is the Italian Lira 1936.27 for 1 Euro.
17
Electronic copy available at: />
Exhibit 23: Denmark, The Real Price of Gold
Local Currency Gold Price/Local Inflation Index
100
90
80
70
60
50
40
30
20
10
0
Data source: Bloomberg, IMF. IMF Denmark CPI. Index=100 in April 2005. Local currency is the Danish Krone.
Exhibit 24: Denmark, Actual and Inflation Adjusted Gold Price
Local Currency Actual and Inflation Adjusted Gold Price
Actual Price
Inflation Adjusted Price
12,000
10,000
8,000
6,000
4,000
2,000
0
Data source: Bloomberg, IMF. IMF Denmark CPI. Index rescaled=1.0 in August 2012. Local currency is the Danish Krone.
18
Electronic copy available at: />
Exhibit 25: Sweden, The Real Price of Gold
Local Currency Gold Price/Local Inflation Index
120
100
80
60
40
20
0
Data source: Bloomberg, IMF. IMF Sweden CPI. Index=100 in June 2005. Local currency is the Swedish Krona.
Exhibit 26: Sweden, Actual and Inflation Adjusted Gold Price
Local Currency Actual and Inflation Adjusted Gold Price
Actual Price
Inflation Adjusted Price
14,000
12,000
10,000
8,000
6,000
4,000
2,000
0
Data source: Bloomberg, IMF. IMF Sweden CPI . Index rescaled=1.0 in August 2012. Local currency is the Swedish Krona.
19
Electronic copy available at: />
Exhibit 27: Russia, The Real Price of Gold
Local Currency Gold Price/Local Inflation Index
700
600
500
400
300
200
100
0
Data source: Bloomberg, IMF. IMF Russia CPI. Index=100 in June 2005. Local currency is the Russian Ruble.
Exhibit 28: Russia, Actual and Inflation Adjusted Gold Price
Local Currency Actual and Inflation Adjusted Gold Price
Actual Price
Inflation Adjusted Price
140,000
120,000
100,000
80,000
60,000
40,000
20,000
0
Data source: Bloomberg, IMF. IMF Russia CPI. Index rescaled=1.0 in August 2012. Local currency is the Russian Ruble.
20
Electronic copy available at: />
Exhibit 29: Turkey, The Real Price of Gold
Local Currency Gold Price/Local Inflation Index
25,000,000
20,000,000
15,000,000
10,000,000
5,000,000
0
Data source: Bloomberg, IMF. IMF Turkey CPI. Index=100 in August 2005. Local currency is the old Turkish Lira.
Exhibit 30: Turkey, Actual and Inflation Adjusted Gold Price
Local Currency Actual and Inflation Adjusted Gold Price
Actual Price
Inflation Adjusted Price
4,500,000,000
4,000,000,000
3,500,000,000
3,000,000,000
2,500,000,000
2,000,000,000
1,500,000,000
1,000,000,000
500,000,000
0
Data source: Bloomberg, IMF. IMF Turkey CPI . Index rescaled=1.0 in August 2012. Local currency is the old Turkish Lira.
21
Electronic copy available at: />
Exhibit 31: Egypt, The Real Price of Gold
Local Currency Gold Price/Local Inflation Index
60
50
40
30
20
10
0
Data source: Bloomberg, IMF. IMF Egypt CPI. Index=100 in July 2005. Local currency is the Egyptian Pound.
Exhibit 32: Egypt, Actual and Inflation Adjusted Gold Price
Local Currency Actual and Inflation Adjusted Gold Price
Actual Price
Inflation Adjusted Price
14,000
12,000
10,000
8,000
6,000
4,000
2,000
0
Data source: Bloomberg, IMF. IMF Egypt CPI. Index rescaled=1.0 in August 2012. Local currency is the Egyptian Pound.
22
Electronic copy available at: />
Exhibit 33: South Africa, The Real Price of Gold
Local Currency Gold Price/Local Inflation Index
100
90
80
70
60
50
40
30
20
10
0
Data source: Bloomberg, IMF. IMF South Africa CPI. Index=100 in July 2005. Local currency is the South African Rand.
Exhibit 34: South Africa, Actual and Inflation Adjusted Gold Price
Local Currency Actual and Inflation Adjusted Gold Price
Actual Price
Inflation Adjusted Price
16,000
14,000
12,000
10,000
8,000
6,000
4,000
2,000
0
Data source: Bloomberg, IMF. IMF South Africa CPI. Index rescaled=1.0 in August 2012. Local currency is the South African Rand.
23
Electronic copy available at: />
Exhibit 35: India, The Real Price of Gold
Local Currency Gold Price/Local Inflation Index
600
500
400
300
200
100
0
Data source: Bloomberg, IMF. IMF India CPI. Index=100 in July 2005. Local currency is the Indian Rupee.
Exhibit 36: India, Actual and Inflation Adjusted Gold Price
Local Currency Actual and Inflation Adjusted Gold Price
Actual Price
Inflation Adjusted Price
120,000
100,000
80,000
60,000
40,000
20,000
0
Data source: Bloomberg, IMF. IMF India CPI. Index rescaled=1.0 in August 2012. Local currency is the Indian Rupee.
24
Electronic copy available at: />
Exhibit 37: China, The Real Price of Gold
Local Currency Gold Price/Local Inflation Index
100
90
80
70
60
50
40
30
20
10
0
Data source: Bloomberg, IMF. IMF China CPI. Index=100 in December 1995. Local currency is the Chinese Renminbi.
Exhibit 38: China, Actual and Inflation Adjusted Gold Price
Local Currency Actual and Inflation Adjusted Gold Price
Actual Price
Inflation Adjusted Price
14,000
12,000
10,000
8,000
6,000
4,000
2,000
0
Data source: Bloomberg, IMF. IMF China CPI. Index rescaled=1.0 in August 2012. Local currency is the Chinese Renminbi.
25
Electronic copy available at: />