Writing task 1 - Cambridge
Bạn đang xem bản rút gọn của tài liệu. Xem và tải ngay bản đầy đủ của tài liệu tại đây (56.97 KB, 10 trang )
CAM 10- TEST 1- IELTS WRITING TASK 1
The first chart below shows how energy is used in an average Australian
household. The second chart shows the greenhouse gas emissions which result
from this energy use.
The first pie chart shows the energy is consumed in an average household in
Australia. The second pie chart shows the emissions of greenhouse gases which are
caused by this energy consumption.
Overall, heating, water heating, and the operation of other appliances account for
the highest proportion in the consumption of domestic energy and in emissions of
greenhouse gases.
It could be clearly observed from the first chart that heating accounts for roughly
42% of total energy consumption in a typical Australian family, and 30% of the
energy is used for water — heating. In contrast, the remainder of the energy is
primarily used for other appliances makes up merely 15%, and refrigeration at 7%,
whereas the figures for cooling and lighting are significantly lower, at only 2% and
4%, respectively.
Turning to the greenhouse gases released, we can see that water heating and other
appliances are responsible for a relatively high proportion of the amount of
greenhouse gas emitted, with about 32% and 28% respectively. In comparison,
heating is 15%, refrigeration is 14%. While the figures for lighting and cooling are
considerably lower, at only 8% and 3%, respectively.
CAM 10- TASK 1 IN TEST 2
The two tables show key data on sales of Fairtrade coffee and bananas sold in 1999
and 2004 in the UK, Switzerland, Denmark, Belgium, and Sweden.
Overall, sales for coffee tended to grow in all five European countries from 1999 to
2004, but sales of Fairtrade bananas only went up in three out of the five countries.
As can be seen from the first table, the amount of UK's coffee was sold 1.5 million
euros in 1999, The figure then rose tremendously to 20 million Euros in 2004.
Being the second-largest coffee provider, Switzerland also experienced significant
growth, from 3 million in 1999 to 6 million in 2004. However, Denmark, Belgium,
and Sweden sold only 2, 1.7, and 1 million(s) of Euro respectively in the same
year.
According to the second table, revenue from Fairtrade bananas was highest in
Switzerland in both given years (15 million in 1999 and 47 million in 2004).
Dramatic increases in sales of bananas from both the UK and Belgium can be seen,
increased from 1 million and 0.6 million in 1999 to 5.5 million and 4 million in
2004 respectively. By contrast, sales for bananas in the other two countries,
Sweden and Denmark, saw declined slightly from 1.8 million (1999) to 1 million
(2004) and from 2 million (1999) to 0.9 million (2004) respectively.
CAM 10- TEST 3- Task1
The charts below show what UK graduate and postgraduate students
The two bar charts compare the number of British graduates and postgraduates in
four categories (part-time work, voluntary work, further study, unemployment) in
2008, excluding full-time work.
Overall, most of the graduate and postgraduate students in the U.K were the
highest number in further study and the lowest number in voluntary work.
Besides, the number of graduates participating in each activity was higher than that
of postgraduates.
For UK graduates, close to 30,000 graduates in the UK went on for a higher degree
in 2008, which was the highest figure shown on the chart. By contrast, the number
of students who decided to do voluntary work was the lowest, at only 3,500. At the
same time, the second popular choice was placed to a part-time job with the figure
at around 17735 and 16,235 graduate students were still unemployed.
With regard to postgraduate students, those who did further study and voluntary
work were also the biggest and smallest groups with 2,725 and 345 respectively.
Lastly, 2,535 UK postgraduates tended to look for part-time work albeit 1,625 UK
postgraduate pupils were still jobless.
IELTS WRITING CAM 10 – TEST 4-TASK 1
The diagram illustrates different stages in the life of big fish, which is called
salmon.
Overall, there are three main stages in the development of the salmon, from fry to
adult salmon.
In the first stage of the life cycle, the salmon eggs are spawned in the upper river
which has slow-moving, they are located in the reeds, and more specifically –
hidden under small stones in case of potential predators. Between five and six
months later, each fish egg hatches into a fry of 3-8cms in body length. They were
called the “smolt” after four years of growth and the length of their body also
increased to twelve to fifteen center meters and are referred to as smolt.
In the next stage of the life cycle, it begins with the migration to the open sea to
enjoy a more abundant food source where they spend about 5 years to grow to
maturity as adult salmon, their length increases to 70-76 cm, and the life cycle
starts again.
CAM 11- TEST 1- WRITING TASK 1
The pie charts below show the percentage of water used for different purposes in
six areas of the world.
Summarise the information by selecting and reporting the main features, and make
comparisons where relevant.
The six pie charts show the percentage of the amount of water consumed for
three different sectors ( the industrial sector, agriculture and domestic) in North
America, South America, Europe, Africa, Central Asia, and South East Asia.
Overall, in North America and Europe, water used for industrial accounts for the
highest proportion. By contrast, agriculture consumes the vast majority of water
used in South America, Africa, Central Asia, and South East Asia.
In Europe and North America, water usage for industrial takes up around 53%
and 48% respectively. The amount of water used for this sector in South America is
only 12%. Whereas, no more than 12% of water used for this sector in the rest four
regions. The opposite trend can be seen when we look at water consumption in
agriculture. This sector consumes more than 70% of the water in Africa, Central
Asia, South East Asia, and South American, while the figures for North America
and Europe are significantly lower, at only 39% and 32%.
Turning to the remaining sector, we can see that water usage for the domestic
sector in Central Asia and South East Asia is the same (7%), while the figure for
Africa is slightly higher, at 9%. In addition, water consumption for the household
function is higher in America and Europe around 15% than that of Asian and
African regions.
CAM 11 – TEST 2 –WRITING TASK 1
The charts below show the proportions of British students at one university in
England who were able to speak other languages in addition to English, in 2000
and 2010.
Summarise the information by selecting and reporting the main features, and make
comparisons where relevant.
The pie charts compare the percentage of British pupils at one university who
could speak additional languages other than their native language in two different
years.
Overall, Spanish made up the largest proportion of languages spoken by British
students in both years (2000 and 2010). By contrast, German language accounted
for the smallest percentage.
In both the years, Spanish was the most commonly spoken second language by
British students increased from 30% in 2000 to 35% in 2010. Meanwhile, there
was also a 5% increase in the number of students who spoke two foreign languages
other than English rose from 10% in 2000 to 15% in 2010. The rate of students
who spoke another language accounted for 15% in 2000 and 20% in 2010.
The number of students speaking German remained unchanged, with only 10% of
students speaking it, exactly the same number as in 2000. The percentage of pupils
at university, who spoke no other languages plummets from 20% (2000) to 10%
(2010). Simultaneously, the students that were speaking France accounted for 15%
in 2000 reduced to 10% in 2010.
CAM 11- TEST 3- WRITING TASK 1
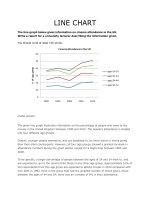
The Graph below shows average carbon dioxide (CO2) emissions per person in
the United Kingdom, Sweden, Italy, and Portugal between 1967 and 2007.
The line graph compares the amount of average carbon dioxide emitted by
each person in four different countries over a period of 40 years (1967-2007).
Overall, per-capita carbon emissions in Italy and Portugal showed an upward
trend from 1967 to 2007. Whereas Sweden and the United Kingdom
predominantly saw a decline for the same period.
According to the given line graph, the average carbon dioxide in the UK reached
a peak of around 11metric tonnes in 1967. However, the next years followed a
steady decline, reaching at around 8 metric tonnes of emissions in 2007. Similarly,
the emission of carbon dioxide in Sweden dropped the figures dramatically in 2007
by almost half of its number in 1977 (from around 9 to 5 metric tonnes ), despite
an insignificant growth in the first 10 years.
On the other hand, Italy and Portugal failed in the effort of controlling CO2
emissions to the environment. From 1967 to 2007, Italy’s emissions per individual
increased gradually from approximately 4.5 to almost 8 metric tonnes. In Portugal,
each person only produced around 1.5 metric tonnes of emissions in 1967. This
country’s emissions then grew steadily and reached a similar level to Sweden’s by
2007, at about 5.5 metric tonnes.
CAM 11- TEST 4- WRITING TASK 1
The table below shows the numbers of visitors to Ashdown Museum during the
year before and the year after it was refurbished. The charts show the result of
surveys asking visitors how satisfied they were with their visit, during the same two
periods.
The table illustrated the yearly amount of people to Ashdown Museum before
and after the renovation of this museum, while the pie charts indicated the
responses to surveys of visitor satisfaction during the same two years.
Overall, after rebuilding, the total number of visitors in Ashdown museum
increased considerably. It is also notice that the percentage of negative response
provided during the year after refurbished become fewer.
As is presented in the table data, in the last year before the renovation of this
museum, total number of visitors there was 74 thousands, and it dramatically
increased to 92,000 in the year after the refurbishment.
Moving on to visitor satisfaction, after renovating, the number of visitors
surveyed who reported that they were very satisfied with their visit rocketed to
35%, a more than double increase. The proportions of those who responded
satisfied increased from 30 to 40%. Notably, 40% of visitor was not satisfied when
the building was not be rebuilt, but this data plummeted by 25% after the
renovating; the single largest change in the visitor survey results. The proportion of
visitors who felt very dissatisfied with their visit also decreased by 50%, from 10
to 5. Across two periods, The rate of respondents who made no response remained
unchanged, at 5%.
CAM 12 - IELTS WRITING TASK 1
The bar chart below shows the percentage of Australian men and women in
different age groups who did regular physical activity in 2010.
Summarise the information by selecting and reporting the main features, and make
comparisons where relevant.
The bar chart illustrates the proportion people in Australia who had regular
workout in the year 2010, according to age and gender.
Overall, the percentages of women exercised more than men in almost each age
group. It is also noticeable that the proportion of males in the age group of 15-24
and women aged 45 to 54 accounted for the highest percentage of the total people
who engaged in physical activities.
As we can see, the percentage of men aged between 15 and 24 was the only
group in which the proportion of males did regular physical activity was higher
than that of females, 52% and 47.7% respectively. However, 48.9% women at the
age between 25 and 34 exercised on a regular basis, whereas the figure for the
opposite sex in the same age group was only 42.2%.
In 2010, more than 52% of women aged 35 to 64 participated in exercise,
while the figures for men in the same age groups were much lower, ranging from
39.5% to 45.1%. Lastly, the figures of both males and females who were physically
active in the age 65 and over were nearly the same, with 46.7 and 47.1
respectively.
CAM 12 – TEST 6- IELTS WRITING TASK 1
The maps below show the centre of a small town called Islip as it is now, and
plans for its development.
The maps illustrate some changes to the Islip town Centre in the current time
and projection for improvement in the future.
Overall, the town will experience considerable changes during the period shown.
The most noticeable differences between the two maps is that the town center will
be upgraded, with the construction of some modern facilities and more housing.
As can be seen from the map, the main road goes through the town central from
east to west at the moment . However, the planned map shows the main road is to
be pedestrianized. Traffic will be diverted on to a dual carriageway that will form a
ring around the town centre. Outside the circle, the school will be slightly extanded
and housing will be relocated to the east of the town.
The town, at present has a row of shops lined together along either side of the
main road. However, we can see that in the new design the shops along the north
side of the centre will be knocked down and replacing by new housing, bus station,
shopping centre and car park. The shops along the south side of the street will still
exist, but it seems that the town's park will be significantly narrowed so that a new
housing can be built next to it.
CAM 12- TEST 7- WRITING TASK 1
Essay topics:The chart below shows how frequently people in the USA ate in fast
food restaurants between 2003 and 2013.
The bar chart compares the proportion of US residents who had meals at fastfood restaurants over a period of 10 years (2003-2013).
Overall, the majority of Americans ate in fast food once a week restaurants,
between 2003 and 2006, and once or twice a month in 2013. It is worth noticing
that people who ate fast food daily was below 5%.
In 2003 and 2006, the ratio of people who ate fast food once a week was over
31%, but it declined to about 27% by 2013. The proportion of Americans
consuming fast food once or twice a month fell by 5% between 2003 and 2006.
However, it increased over the next 7 years and in 2013, as much as 33% of the
people visited fast food corners.
From 2003 to 2013, those who ate fast food several times a week remained
fluctuated between around 16% and 20%, and these figures were minimally higher
than the proportion for those eating this food a few times a year. The percentage of
US citizens who never ate at restaurants as well as those who eat every day make
up a very small proportion, ranging from just 3% to 5%.
CAM 12 - TEST 8- WRITING TASK 1
The diagram illustrates various steps in which electricity is generated using
geothermal energy.
The diagram illustrates the process of generating electricity from geothermal
energy.
Overall, there are five main steps in this process, beginning with the pumping
down of cold water into the geothermal zone and ending with the production of
electricity by the generator.
In the first stage of the process, cold water which is accumulated in a storage
tank is pumped down 4.5 km long pipe into an injection well. After that, the water
is injected into the Geothermal zone, which contains a lot of hot rocks used to
increase the temperature of the water. Next, the hot water enters the production
well where it is pumped up to a condenser.
In the next stage of the process, the water transforms into steam in the
condenser. Following this, the steam passes into the turbine which moves it in a
circle movements, the steam is transferred to the generator to produce electricity.
Finally, the resulting electricity is distributed for different purposes via various
electricity grids.
.