Tài liệu ALASKA ECONOMIC TRENDS 2010: EMPLOYMENT IN ALASKA''''S SEAFOOD INDUSTRY doc
Bạn đang xem bản rút gọn của tài liệu. Xem và tải ngay bản đầy đủ của tài liệu tại đây (1.14 MB, 19 trang )
2
ALASKA ECONOMIC TRENDS NOVEMBER 2010
Governor Sean Parnell
Commissioner Click Bishop
November 2010
Volume 30
Number 11
ISSN 0160-3345
To contact us for more
information, a free subscription,
mailing list changes, or back
copies, e-mail trends@alaska.
gov or call (907) 465-4500.
Alaska Economic Trends is a
monthly publication dealing
with a wide variety of economic-
related issues in the state. Its
purpose is to inform the public
about those issues.
Alaska Economic Trends is
funded by the Employment
Security Division within the
Alaska Department of Labor and
Workforce Development. It’s
published by the Department of
Labor.
Alaska Economic Trends is
printed and distributed by Assets,
Inc., a vocational training and
employment program, at a cost
of $1.16 per copy.
Material in this publication is
public information, and with
appropriate credit may be
reproduced without permission.
Cover:
Salmon seiners fi sh outside
Aleutkina Bay, on the southern
portion of Sitka Sound.
Photo courtesy of
sitkaphotos.com
Brynn Keith, Chief
Research and Analysis
Sara Whitney, Editor
Sam Dapcevich, Graphic Artist
To contact Trends authors or request a free subscription,
email or call (907) 465-4500. Trends is on the
Web at laborstats.alaska.gov.
Employment in the Seafood Industry 4
Alaska regions saw a mix of losses and gains in 2009
Alaska’s “Other” Manufacturing 12
The 29 percent outside of seafood processing
Employment Scene 17
Unemployment rate at 7.8 percent
Trends Authors
Neal Fried, a De-
partment of Labor
economist in Anchor-
age, specializes in the
Anchorage/Mat-Su
region’s employment,
wages, and the cost
of living. To reach
him, call (907) 269-
4861 or e-mail him at
Neal.Fried@alaska.
gov.
Josh Warren, an
Alaska Department of
Labor and Workforce
Development econo-
mist in Juneau, special-
izes in Alaska resident
and new hire studies,
wage record analysis,
and seafood industry
research. To reach him,
call (907) 465-6032 or
e-mail him at Joshua.
Correction
The Kennecott Mine is
located near McCarthy.
On page 11 in October’s
issue of Trends, we incor-
rectly stated that it’s near
McGrath.
3
NOVEMBER 2010 ALASKA ECONOMIC TRENDS
Fishing Industry Vital to Alaska
By Commissioner Click Bishop
Fish are among Alaska’s most important natural resources, with a 2009 harvest
valued at more than $1.2 billion. The industry employs almost 54,000 workers at
some time during the year in harvesting or processing. June, July, and August
are the peak months for Alaska’s fi shing industry, which leads the nation in the
amount and value of fi sh harvested. More than 50 percent of all fi sh harvested in
the U.S. comes from Alaska.
Alaska’s fi sheries are the most sustainable and best-managed in the world.
Commercial fi shing is one of the largest private-sector industries in the state, including
all seafood harvesting and processing. It accounts for more than 50 percent of basic private-sector employment in many
of our coastal communities.
Thousands of visitors come to Alaska each year to enjoy our world-class sport fi shing, and they contribute to the
economy by supporting local businesses.
Both Alaska Natives and non-Natives rely on our fi sheries for subsistence, which has been elemental to Alaskan culture
for thousands of years. Fish comprise 60 percent of subsistence foods taken each year, and this tradition allows a love of
fi shing to be passed from one generation to the next.
4
ALASKA ECONOMIC TRENDS NOVEMBER 2010
A
laska’s fi shing industry is a major eco-
nomic engine, leading the nation in fi sh
harvesting value and poundage. Harvest-
ing and processing also help drive our state econ-
omy. In 2009, the industry directly employed at
least 53,500 workers at some point during the year.
(See Exhibit 1.)
This article is an overview of total workers and
average monthly employment
1
in the Alaska fi sh-
ing industry. It also provides a focused look at
species and regions, and reviews how we create
annual size estimates using fi sh harvest records,
wage records, and other data sources.
1
This article refers to both jobs and workers when discussing
employment numbers. Unless otherwise specifi ed, “jobs” refers
to annual average monthly jobs. “Workers” refers to the number
of distinct workers in that sector. These two statistics can trend in
different directions because multiple individuals can work the same
job, and because jobs are averaged over the entire year.
Estimating harvester employment
Although seafood processing workers and jobs
are included in Alaska wage and salary employ-
ment numbers, fi sh harvesting workers
2
fall out-
side the normal labor force reporting process —
just like self-employed workers and the military,
two other major sources of state employment.
Because fi sh harvesters are exempt from report-
ing employment and workers’ earnings, not all
harvesters and crew are counted in the Alaska
Department of Labor and Workforce Develop-
ment’s regular employment data series.
Given the economic importance of the industry
and the lack of precise employment estimates, the
Department of Labor created a special data series
to fi ll this gap. (For detailed information on how
we developed this data series, refer to the crew
factor discussion in the methodology sidebar near
the end of this article.) We update these estimates
of the number of workers and
average monthly employment
annually in cooperation with the
Alaska Department of Fish and
Game.
3
2
The term “fi sh harvesting” is used instead
of the more generic “fi shing” reference
to clarify that only jobs created for permit
holders and crew who are directly involved
in harvesting the fi sh are included. It does
not include the many jobs in processing,
tendering, and other related activities.
This article addresses processing jobs
separately.
3
Fish and Game primarily manages the in-
shore fi shery within three miles from shore,
the Western Alaska crab fi sheries, and
some groundfi sh fi sheries. The National
Oceanic and Atmospheric Administration’s
National Marine Fisheries Service super-
vises the fi sheries between three miles and
200 miles off shore (the international border
line). The International Pacifi c Halibut Com-
mission oversees halibut harvests.
By JOSH WARREN, Economist
Employment in the Fishing Industry
Alaska, 2001 to 2009
52,327
47,058
49,361
49,649
50,244
51,055
53,033
52,140
53,552
2001 2002 2003 2004 2005 2006 2007 2008 2009
0
10,000
20,000
30,000
40,000
50,000
60,000
Total Workers
Residents
Nonresidents
Residency determined by self-reporting and PFD matching where possible.
Sources: Alaska Department of Labor and Workforce Development, Research and Analysis Section;
National Marine Fisheries Service; and Commercial Fisheries Entry Commission
1
Employment in the Seafood Industry
Alaska regions saw mix of losses and gains in 2009
5
NOVEMBER 2010 ALASKA ECONOMIC TRENDS
Total industry
numbers in 2009
Throughout 2009, there
were almost 30,000 people
harvesting fi sh in Alaska
waters. Roughly 20,000
were licensed crew while
the remaining 10,000 held
permits. Seafood process-
ing is the other large in-
dustry sector, with around
24,000 people employed at
some point during 2009.
While harvesting and
processing employed a
total of 53,522 people last
year, most in the fi shing
industry are not working
year-round. Because of the
industry’s dramatic sea-
sonal pattern, its average
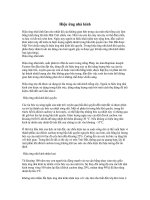
monthly employment is much smaller. The overall
mean is approximately 16,234 people: about 7,100
in harvesting and 9,100 in seafood processing
in 2009. (See Exhibit 2.) However, the average
monthly fi sh harvesting job count
4
hit 20,075 at its
summer peak, and seafood processing reached a
high of 19,387 summer workers from its monthly
average of 9,147.
Alaska’s total fi sh harvesting workforce grew
from 2008 to 2009, adding 1,412 workers for a 2.7
percent gain. However, the average monthly job
count went down from 7,370 to 7,087.
Dependence varies by region
The fi shing industry benefi ts all areas of the state
differently. The regions that rely on it most are the
Aleutians and Bristol Bay. The other coastal areas
5
also have strong harvesting and processing em-
ployment, but the interior and larger city centers
such as Anchorage and Fairbanks have less
direct industry involvement.
4
For data on average monthly jobs, go to: te.
ak.us/research/seafood/statewide/AKAvgMonthlySpec.pdf.
5
“Coastal” is all of the state boroughs excluding the Municipality
of Anchorage; the Matanuska-Susitna, Fairbanks North Star, and
Denali boroughs; and the Southeast Fairbanks Census Area.
Activity Peaks in Summer
Alaska, 2009
2
Sources: Alaska Department of Labor and Workforce Development, Research and Analysis Section; Commercial
Fisheries Entry Commission
Regional Importance of Fisheries
Annual percentage of workers, 2009
3
Sources: Alaska Department of Labor and Workforce Development, Research and Analysis
Section; Commercial Fisheries Entry Commission
The Aleutians depend most on the fi shing industry,
with 78.6 percent of the workforce involved in
processing or harvesting at peak in the fi rst quar-
ter of the year. (See Exhibits 3 and 4.) The fourth
Aleutians
Bristol Bay
Kodiak
Southcentral
Southeast
Western AK
Anchorage
Northern
0%
20%
40%
60%
80%
100%
Fishing-related
Other private
Jan. Feb. March April May June July Aug. Sept. Oct. Nov. Dec.
0
7,500
15,000
22,500
30,000
37,500
45,000
Monthly Employment in 2009
Seafood Processing
Seafood Harvesting
Combined Monthly Average
6
ALASKA ECONOMIC TRENDS NOVEMBER 2010
quarter shows the lowest percentage of fi shing
industry workers — but even during that quarter,
over 64 percent of the labor force worked in fi sh-
ing. When each worker is counted only once over
the entire year, 63 percent of all workers in the
Aleutians are part of the fi shing industry.
Region
and
Year
Individuals
Who Fished
Permits
1
Percent
Nonresident
Permit Holders
Estimated
Number
of Crew
Members
Total
Estimated
Workforce
2
Total Gross
Earnings of
Permit
Holders
3
Percentage
of Total Gross
Earnings by
Nonresident
Permit Holders
Aleutian and Pribilof Islands
2006 952 43.0% 3,908 4,860 $617,999,680 89.5%
2007 1,040 42.8% 4,114 5,154 $444,955,461 73.6%
2008 1,084 43.3% 4,336 5,420 $812,394,704 81.9%
2009 1,070 43.7% 4,239 5,309 $657,505,626 84.1%
Bristol Bay
2006 2,317 44.3% 6,995 9,312 $96,094,632 54.7%
2007 2,257 45.9% 6,800 9,057 $110,826,728 55.7%
2008 2,356 45.4% 7,112 9,468 $113,625,188 56.0%
2009 2,335 47.4% 7,050 9,385 $133,326,958 58.8%
Kodiak
2006 744 26.7% 2,528 3,272 $89,178,455 36.7%
2007 742 26.3% 2,526 3,268 $122,303,929 26.7%
2008 835 26.8% 2,835 3,670 $140,034,618 29.9%
2009 820 27.2% 2,844 3,664 $111,163,060 34.3%
Northern
2006 151 0.7% 345 496 $1,823,734 ND
2007 145 0.7% 324 469 $2,045,962 ND
2008 199 0.0% 431 630 $3,214,020 0.0%
2009 199 0.0% 428 627 $2,780,621 0.0%
Southcentral
2006 1,860 22.6% 4,571 6,431 $75,839,102 30.0%
2007 2,127 25.2% 5,386 7,513 $193,246,998 31.7%
2008 2,310 24.8% 5,854 8,164 $195,525,629 29.2%
2009 2,283 25.5% 5,788 8,071 $131,353,891 29.2%
Southeast
2006 2,520 21.2% 6,545 9,065 $135,937,555 27.8%
2007 2,638 22.6% 6,897 9,535 $191,835,207 26.8%
2008 2,815 22.5% 7,170 9,985 $201,478,290 26.2%
2009 2,835 23.8% 7,315 10,150 $173,481,400 30.4%
Yukon Delta
2006 903 0.1% 1,813 2,716 $12,444,777 ND
2007 1,006 0.1% 2,039 3,045 $4,786,208 ND
2008 1,104 0.3% 2,226 3,330 $7,555,700 ND
2009 987 0.3% 1,999 2,986 $5,941,948 ND
ND: Not disclosable.
1
Commercial Fisheries Entry Commission
2
'Workforce' refers to the number of individual fi shing permits plus the crew members needed for the
permit they fi sh. Statewide crew member counts are estimates derived from crew license sales.
3
Gross earnings, or revenue, are currently the most reliable data available, but are not directly com-
parable to wages as expenses have not been deducted.
Sources: Commercial Fisheries Entry Commission; National Marine Fisheries Service; and Alaska
Department of Labor and Workforce Development, Research and Analysis Section
Harvesting Workforce and Gross Earnings
By Area, 2006 to 2009
4
The region with the second highest
percentage of the workforce in fi sh-
ing is the Bristol Bay region, with
57 percent of its workers involved in
harvesting and processing at some
time in 2009. However, the indus-
try’s relative importance in Bristol
Bay is much more seasonal than in
the Aleutians, because Bristol Bay’s
high-value fi sheries only open for a
few weeks at most. In the second and
third quarters, about 65 percent of its
workers were employed in fi shing,
compared to only about 3 percent in
the fi rst and fourth quarters of that
year.
Kodiak’s fi sheries are also highly
seasonal. During the summer, fi sh-
ing employment makes up around 50
percent of the total, dropping to the
mid-30
th
percentile during the winter
months. On an annual basis, 42 per-
cent of the workforce in Kodiak is
involved in fi shing.
Southeast, Southcentral, and Western
Alaska also have strong seasonal
patterns in their fi shing employment.
Each has a peak quarter with around
25 percent of the labor force working
in the fi shing industry.
The Anchorage and Northern regions
(including Fairbanks) are large popu-
lation centers with little direct eco-
nomic dependence on fi shing. They
do, however, provide some seasonal
fi sh harvesting and processing work-
ers to the coastal areas. They also
give direct and indirect support to
processing and transportation of fi sh,
and therefore benefi t signifi cantly
from the industry.
Regional results mixed
In terms of total estimated workers, numbers
dropped everywhere between 2008 and 2009
except Southeast, which gained 165 estimated
workers, or 1.7 percent. (See Exhibit 4.) State-
7
NOVEMBER 2010 ALASKA ECONOMIC TRENDS
wide, there was an overall gain
of 799 active permit holders and
purchased crew licenses last year
— an addition of 958 total crew
members offset by a loss of 159
permitted fi shermen.
Harvests by fi shery
Salmon
The Alaska salmon fi shery is
composed of fi ve species: king,
sockeye, pink, chum, and coho.
Sockeye comprise the majority of
the harvest in Bristol Bay, Alaska
Peninsula, Chignik, Cook Inlet,
and the Copper River area; pinks
dominate in Southeast Alaska,
Prince William Sound, and Ko-
diak; chum are the main harvest
for the Kuskokwim and Yukon
Delta regions; and king salmon
are predominant in the Northern
region on the Yukon.
6
Despite a slight decrease in salmon
prices from 2008 to 2009, Alaska’s
salmon fi shery had the largest
number of harvesting jobs in 2009,
with an average of 3,830: a slight
increase from the 2008 fi gure of
3,739.
On average, the salmon fi shery
employs about 54 percent of har-
vesting workers. However, due
to the extreme seasonality of this
fi shery, it claims about 83 percent
of all fi sh harvesting workers at its
yearly peak.
Average monthly employment for
the salmon fi shery remained stable
in 2009, gaining just 91 jobs.
However, due to large summer
6
For more information about Alaska’s seafood industry employ-
ment, go to the Research and Analysis Web site at:
laborstats.alaska.gov, click on “Industry Information” in the left-
hand column, then “Seafood Industry.” You can also access the
Web site by visiting labor.alaska.gov and clicking on “Research-
ers” in the gold bar at the top.
Fishery
and
Year
Individuals
Who Fished
Permits
1
Percent
Nonresident
Permit Holders
Estimated
Number
of Crew
Members
Total
Estimated
Workforce
2
Total Gross
Earnings of
Permit
Holders
3
Percentage
of Total Gross
Earnings by
Nonresident
Permit Holders
Crab
2006 486 25.7% 1,765 2,251 $110,660,029 70.4%
2007 456 23.2% 1,563 2,019 $168,591,117 70.5%
2008 468 26.5% 1,658 2,126 $241,015,434 76.4%
2009 465 26.9% 1,612 2,077 $180,540,771 76.6%
Groundfi sh/Other
2006 583 38.9% 2,482 3,065 $259,106,352 78.6%
2007 612 39.4% 2,602 3,214 $536,482,510 36.4%
2008 664 35.7% 2,741 3,405 $547,453,862 85.7%
2009 668 30.2% 2,645 3,313 $444,888,943 89.5%
Halibut
2006 2,209 18.9% 4,504 6,713 $197,454,034 32.0%
2007 2,249 18.9% 4,522 6,771 $215,631,109 32.7%
2008 2,123 19.2% 4,283 6,406 $206,488,880 32.7%
2009 2,135 18.8% 4,251 6,386 $135,817,842 33.7%
Sablefi sh
2006 660 31.5% 1,567 2,227 $76,450,614 48.8%
2007 647 31.7% 2,162 2,809 $74,970,755 50.2%
2008 639 31.6% 2,138 2,777 $77,925,245 45.5%
2009 661 30.9% 2,187 2,848 $72,507,648 47.5%
Herring
2006 330 16.7% 778 1,108 $9,847,180 22.1%
2007 257 17.1% 913 1,170 $14,822,700 21.4%
2008 336 17.6% 1,122 1,458 $23,004,150 17.9%
2009 393 20.4% 1,298 1,691 $23,416,301 28.1%
Miscellaneous Shellfi sh
2006 373 21.2% 297 670 $13,666,507 48.0%
2007 315 21.6% 542 857 $11,908,409 47.9%
2008 319 24.1% 534 853 $10,287,505 45.6%
2009 343 23.0% 593 936 $14,721,032 48.0%
Salmon
2006 6,884 26.0% 9,859 16,743 $313,164,123 35.2%
2007 6,857 27.0% 9,911 16,768 $346,622,891 36.0%
2008 6,797 26.9% 9,874 16,671 $367,167,052 34.2%
2009 7,323 27.5% 10,609 17,932 $344,752,605 38.9%
1
Commercial Fisheries Entry Commission
2
‘Workforce’ refers to the number of individual fi shing permits plus the crew members needed for the
permit they fi sh. See the methodology for more detail.
3
Gross earnings, or revenue, are currently the most reliable data available, but are not directly com-
parable to wages as expenses have not been deducted.
Sources: Commercial Fisheries Entry Commission; National Marine Fisheries Service; and Alaska
Department of Labor and Workforce Development, Research and Analysis Section
Fish Harvesting Workers
All Alaska Fisheries, 2006 to 2009
5
peaks, the total worker pool was 17,932 people —
an increase of 1,261 over 2008. (See Exhibit 5.)
Halibut
The trend in harvesting employment for the
halibut fishery has continued its slow but
steady decline. From 2008 to 2009, 132 average
8
ALASKA ECONOMIC TRENDS NOVEMBER 2010
monthly jobs were lost. This brought the average
number of jobs to 1,047 for each month. The total
workforce for the fi shery was 6,386 — 20 fewer
workers than in 2008.
Sablefi sh
Average monthly employment in the sablefi sh fi sh-
ery has also continued to fall over the years. During
2009 there were 394 jobs per average month, a de-
Age Shares of the Fishing Industry
Alaska, 2009
6
Includes only those who reported valid birth years.
Sources: Alaska Department of Labor and Workforce Development, Research and Analysis
Section; Commercial Fisheries Entry Commission
crease of 17 from 2008.
Despite the decline in average employment, the
total number of people involved in sablefi sh in-
creased by 71. This brought the estimated number
of sablefi sh harvesting workers to 2,848 in 2009.
Herring
Herring fi shery employment grew last year, but
it failed to completely recover the signifi cant job
losses it suffered in 2001 and 2006. During the
2006 fi shing season, the herring fi shery lost 103
jobs — nearly half the average monthly workforce.
In 2008, there was a small recovery movement that
resulted in a modest increase of an estimated six
jobs. In the most recent season, the herring fi shery
rebounded with strength, gaining 67 jobs. Herring
also showed strong growth in the total number of
workers in the fi shery, with an estimated
increase of 233 in harvesting.
Miscellaneous shellfi sh
The miscellaneous shellfi sh fi shery
continued its slow growth in 2009,
gaining only fi ve jobs. Although the em-
ployment of 126 people in 2009 is low
historically, employment is recovering
and re-approaching its 2002 high of 173
workers.
Despite the low average monthly em-
ployment in the miscellaneous shell-
fi sh fi shery — which is dominated by
shrimp, clams, and sea cucumbers —
this sector has a large number of total
workers. There are 936 people who
harvested during 2009 — an increase of
83 over 2008.
Groundfi sh
The relatively stable year-round ground-
fi sh fi shery supports the third-largest group of
harvesting employees. The fi shery has a secure and
modestly growing employment base, representing
about one-sixth of the annual average jobs in har-
vesting.
Average monthly groundfi sh employment declined
from 2008 to 2009 after several years of modest
16 and 17
3.2%
18 to 21
10.6%
22 to 29
18.7%
30+
67.5%
Age Profile for Fishing Sectors
Alaska, 2009
7
Includes only those who reported valid birth years.
Sources: Alaska Department of Labor and Workforce Development, Research and Analysis Section;
Commercial Fisheries Entry Commission
16 20 25 30 35 40 45 50 55 60 65 70 75 80 85 90
0
200
400
600
800
1000
Crew
Permit holders
Processor workers
Workers
9
NOVEMBER 2010 ALASKA ECONOMIC TRENDS
growth. There were 3,313 groundfi sh harvesting
workers during 2009, which was a drop from the
3,404 reported in 2008.
Crab
Crab fi sheries in the state suffered a loss in monthly
employment from 2008 to 2009. In 2009, 24 jobs
were lost — a decrease of 5 percent from the previ-
ous year. The crab fi shery also lost 49 harvesting
workers last year.
Many younger workers
The Department of Labor and Workforce and De-
velopment has access to more information about
crew license holders than it has in the past. These
additional data on Alaska vessels’ crews provide a
more complete picture of the type of person who
enters these challenging occupations.
This detailed information shows the number of
workers employed in fi sh harvesting by age group.
Because fi sheries data come from a variety of sources with
varying lag times, harvesting estimates are not available as
quickly as other data series the department publishes. For ex-
ample, information on fi sh landings is reported annually, several
months after the end of the calendar year. This can lead to a
signifi cant delay between the fi sh harvest and data publication.
Landings and crew factors
As a substitute for detailed payroll records
1
, state and federal
fi sh management agencies provide the Department of Labor
with information on the specifi c “landings” made under each
commercial permit over the year. A landing is the initial sale of
harvested fi sh to a buyer. To create employment and workforce
estimates from landings, the Department of Labor uses “crew
factors” developed from surveys and industry research to quan-
tify the labor needed to fi sh specifi c permits.
For example, the crew factor for an S04Y permit — a permit to
fi sh for salmon in the Lower Yukon with gillnets — is two. So,
if a landing is recorded under an S04Y permit, we attribute two
workers to that permit. Each permit holder has a unique iden-
tifying number that allows the Department of Labor to assign
only one set of workers to a specifi c permit holder, per permit,
in any given calendar month even if there are numerous land-
ings during the month.
2
We also assign the jobs by place of work rather than the resi-
dence of the workers. Most permits have a geographic desig-
nation where specifi c species can be harvested. In the above
example of an S04Y permit, the “Y” stands for the Lower Yukon
Region, regardless of what species is fi shed. All landings under
that type of permit create employment in the ports of Western
Alaska. Permits that allow fi shing anywhere in the state receive
a special harvest area code.
1
Another factor limiting employment data for fi sheries is that the U.S.
Bureau of Labor Statistics, which governs how employment is counted in
the federal-state cooperative program called Current Employment Statistics,
defi nes fi shing as an agricultural activity. Agricultural employment has tradi-
tionally been excluded from employment statistics under this program.
2
The same approach to counting the number of monthly jobs is used for
other industries in that a person who works 60 hours in a week for a single
employer is counted the same as a person who works 20 hours in a week.
Each is said to hold one job in that month.
The permit is the employer
We deem the permit itself the employer, which means that a
permit holder who makes landings under two different permits
in the same month will generate two sets of jobs. Considering
the permit the employer rather than the permit holder is a slight-
ly better approximation of how jobs and workers are counted in
wage and salary numbers. If permit holders were the employ-
ers, it would incorrectly appear that they maintain identical crew
for every permit.
Residency for harvesting is based on what permit holders
claim when they purchase fi shing permit applications. Permit
holders are required to sign a statement saying that except for
brief intervals, military service, or attendance at an educational
or training institution, they have been in Alaska for the last 12
months and intend to stay within the state indefi nitely. The ap-
plicants also may not receive any benefi ts as residents of an-
other state, territory, or country. Permit holders who signed this
statement are considered residents for this report.
Prep time doesn’t count
The harvesting employment estimates are conservative be-
cause they don’t refl ect any time spent by permit holders or
their crew preparing to fi sh or winding up operations at the
end of the season. This is because the Department of Labor
determines the months of work only by months with registered
landings. So if the permit holder works for two weeks in May
getting the boat ready and begins making landings in June, we
don’t count the effort in May as employment despite its obvious
importance to the enterprise.
A recent proposal by the Department of Fish and Game would
collect actual crew counts associated with each landing, elimi-
nating the need for crew factors and harvesting estimates.
However, that proposal is undergoing further study.
In the coming year, the Department of Labor also plans to con-
duct a special survey of permit holders to obtain updated crew
factors. The survey will collect additional information about the
time spent preparing a vessel for fi shing or working at the end
of the season.
Methodology
10
ALASKA ECONOMIC TRENDS NOVEMBER 2010
About 47 percent of crew license holders are 29 or
younger, supporting the observation that the fi shing
industry is a major employer of young workers in
the state. (See Exhibit 7.) Only about 31 percent of
all workers in wage and salary employment in 2009
were 29 or younger.
The summer peak in harvesting and processing
employment coincides with summer break from
school, making the fi shing industry an attractive
option for students. Permit holders, the other seg-
ment of harvesting workers, are much older than
their crew, with an average age of 50 in 2009. (See
Exhibit 7.)
Seafood processing workers also tend to be older
than crew. In 2009, processing workers with age
information (derived from historical Permanent
Fund Dividend applicant data) reported an average
age of 39 in 2008, close to the average age of 40 for
all wage and salary workers.
Even though the mean age for all fi shing workers
is comparable to the statewide average, some indi-
vidual fi shing sectors are much more “youthful” —
especially fi sh harvesting, which has a large peak of
workers in their mid-20s.
2010 looks promising
Given the lag in available indicator data, these de-
tailed employment and earnings estimates are for
2009 only. Once data collection for the current year
draws to a close, we will be able to compare all of
Alaska’s fi sheries including its largest — groundfi sh
and salmon — to see how the harvesting season
played out in 2010.
However, preliminary data show a very large
salmon harvest, outperforming last year’s and the
fi ve-year average. Most of the spike came from pink
salmon harvesting in Prince William Sound. On a
statewide basis, this should lead to higher estimated
harvesting employment and an increase in the num-
ber of seafood processing workers compared to
2009 in the salmon fi shery.
Groundfi sh catch reports also show similar
jumps over the 2009 values. Because ground-
fi sh represents a majority of the fi shing indus-
try earnings in Alaska, the increase of 40,000
metric tons so far this year is further evidence
of greater employment in fi sheries in 2010.
Summary
Harvesting and seafood processing are an integral
part of Alaska’s economy, employing tens of thou-
sands of Alaskans. These employment estimates
attempt to quantify the importance of this industry,
which like other employment sectors has its own
ebb and fl ow. Nevertheless, even with this less-
than-record year, Alaska has higher earnings, higher
employment, a larger workforce, and greater catch
poundage than a decade ago.
11
NOVEMBER 2010 ALASKA ECONOMIC TRENDS
A tough search
There are many tales about people who
easily landed a job as a crew member in
Alaska’s fi shing industry on a highliner
fi shing boat and made tons of money.
There are also published materials
for sale that boast of lucrative jobs in
canneries and on fi shing boats.
The reality is that for every success, there
are many failures. A prospective crew
member’s chance for a profi table season
hinges on careful assessment of job
openings and close attention to details on
any offer.
A crew member position can be hard to
get. During harvest seasons, prospective
crew members must walk the fi shing
docks to follow up on each word-of-
mouth lead and to speak with the skipper
personally. The travel and waiting for
such an opportunity can be costly, both
physically and monetarily. Crew members
rarely leave good jobs, so only a small
percentage of hopefuls fi nd their berth
this way.
Employers seek crew who:
• Are available to work the full season
or contract period
• Are physically able to stand and work
long hours and move heavy objects
• Get along well with others in remote
and often wet and cold conditions
• Are ready for hard work, are not
chronic complainers, and have a
positive attitude
• Follow directions and obey safety
rules
Warnings
Commercial fi shing is one of the most
hazardous occupations in America.
Reputable boat operators rarely
have serious mishaps, nor do they
lose good crew members through
misunderstandings. Be wary of accepting
a job on a vessel that has numerous crew
vacancies during the harvest season. It’s
a good idea to fi nd out why the departed
crew member(s) left.
Earnings
Minimum wage laws do not apply to crew
member jobs in the industry. However,
certain federal and state laws about hiring
people under age 18 do apply.
Wages are often based on a share
or percentage of harvest earnings.
Newcomer deckhand earnings range from
1.5 percent to 10 percent of the adjusted
gross catch depending on location, type
of fi shery, and the worker’s skills. Some
vessels offer a daily rate from $50 to $100
instead of a percentage of the catch.
Recent market conditions have caused
some share rates to decline.
In addition to fi shing, crew members are
expected to work on their vessel and its
associated gear without additional pay.
The daily rate or a share or percentage
of the catch is considered pay for all
work performed. New crew members
should obtain a signed work agreement or
contract beforehand that clearly explains
the pay and other entitlements.
Additional costs
Many boats charge crew members for a
share of operating expenses. These may
include food, fuel, bait, and ice. A crew
member can also expect to purchase
specialized apparel such as:
• Wet weather gear: $100 per set
• Rubber boots: $40 to $70 per pair
• Gloves: $2 to $12 per pair
• Wrist covers or sleeves: $5 per set
• Sleeping bag: $70 to $200
The fi shing vessel owner/operator should
provide other gear required by the Coast
Guard, such as a survival suit. Make sure
the vessel has a good safety reputation.
Crew members supply their own
commercial fi shing licenses. In 2010,
commercial fi shing license fees are $60
for a resident and $200 for a nonresident.
The Alaska Department of Fish and Game
offers license information and purchasing
at: www.admin.adfg.state.ak.us/license.
Accommodations
On smaller vessels, the crew will eat,
relax, and sleep with very little privacy.
Toilet facilities on some vessels can be
nonexistent or somewhat exposed, while
on others there is a shower and toilet for
individual use. Ask about these facilities if
privacy is important.
Safety
Injury is possible in every aspect of a
crew member’s work, and getting to
the nearest clinic or hospital is totally
dependent on the weather and availability
of special transportation. The wait can be
hours, or even days. Before accepting a
job, ask about the safety equipment and
procedures aboard the intended vessel.
Fishing vessels
Fishing vessels range from small skiffs of
20 feet to large factory trawlers of 300 feet
or longer. The vessels may fi sh anywhere
from near shore to 200 miles at sea. The
larger river systems of the state also
support skiff fi sheries.
The size of the vessel has little bearing
on the number of fi shermen or deck crew
required. For example, a 160-foot trawler
can operate effi ciently with fi ve crew,
which is about the same needed for a 58-
foot purse seiner in the near-shore fi shery.
\Most of these vessels are based out of
California, Oregon, and Washington, with
a small number based in Alaska. These
vessels are normally fully staffed before
they depart.
Please use the ALEXsys site to search for
jobs in the seafood industry:
/>Source: Department of Labor and Workforce
Development, Employment Security Division
Tips for seeking work as a crew member on Alaska fi shing vessels
12
ALASKA ECONOMIC TRENDS NOVEMBER 2010
By NEAL FRIED, Economist
Alaska’s “Other” Manufacturing
The 29 percent outside seafood processing
W
hen taking the temperature of the na-
tional economy, we use the health of
the manufacturing industry as an im-
portant bellwether. However, its effects on Alas-
ka’s economic climate are rarely examined, and
for good reason. Manufacturing is a major player
nationwide, but plays a smaller role in our state.
Despite 30 years of nonstop blows and the recent
recession’s near-knockout punch to the country’s
manufacturing sector, the industry still generates
12 percent of the nation’s wealth (gross domestic
product), and employs 9 percent of the country’s
wage and salary workforce.
Manufacturing makes up only 4 percent of Alas-
ka’s wage and salary employment and represents
just 2 percent of our gross state product. And
according to the most current economic census,
Alaska is home to the fewest manufacturing
companies in the United States.
Seafood processing gets all of the attention
when discussing manufacturing in Alaska, be-
cause it represents nearly three-quarters of the
industry. (See Exhibit 1.) All the manufactur-
ing companies that made the list of Alaska’s
100 largest private-sector employers in 2009
were seafood processors. The remaining 29
percent of the industry, or “other manufactur-
ing,” deserves a detailed examination despite its
diminutive size.
Sector small but diverse
In 2009, there were 3,721 jobs in “other manu-
facturing” in Alaska, or a little over 1 percent
of all the state’s wage and salary employment.
None of the narrowly defi ned subcategories
generate more than 430 jobs, or 12 percent
within “other manufacturing.” (See Exhibit 2.)
Only transportation equipment, fabricated metal
products, and refi neries each create more than
400 jobs — and the remaining groupings quick-
ly get smaller. (See Exhibit 3.) Even among
the larger categories, employment is dispersed
among an enormous number of employer units.
For example, employment in the two largest
categories — transportation equipment and fab-
ricated metal products — is spread among 40
and 51 different employers, respectively.
In other words, Alaska’s “other manufactur-
ing” is small, the categories within it are small,
and fi rm size is also small. This all adds up to a
pocketsize sector that is amazingly diverse.
The other heavyweights in the rest of manu-
facturing include printers, wood product
manufacturers, bakers, and brewers — but no
“Other” Manufacturing Employs Few
Alaska, 2009
Source: Alaska Department of Labor and Workforce Development, Research
and Analysis Section
1
Seafood processing 71%
Other manufacturing 29%
13
NOVEMBER 2010 ALASKA ECONOMIC TRENDS
candlestick makers. Actually, a
few of those might be hidden in
the miscellaneous category. In ad-
dition, there are smaller producers
of furniture, tents, clothing, chemi-
cals, curios, plastics, electronics,
knives, ulus, coffee, boats, signs,
insulation, and a long list of other
goods.
Who and where are they?
Because a majority of these com-
panies are small, few of them have
a substantial statewide presence. In
2009, no individual company gen-
erated more than 200 jobs on an
annual basis.
Exhibit 4 is a list of the 50 largest
companies in this industry. There
are a few high-profi le players: one
is Alaskan Brewing Company,
whose beer has quenched the thirst
of many for nearly 25 years. There
are also the state’s two largest re-
fi neries—Tesoro and Flint Hills —
recognized around the state as the
major producers of gasoline, die-
sel, heating oil, and jet fuel. Most
of these products are consumed
locally or they help fuel the giant
fl eet of international cargo jets that
visit the state each day.
These companies are widely
dispersed across Alaska. For ex-
ample, the list shows four ship
and boat builders, all prominent in
their own coastal communities but
less known statewide. The largest
of these is Alaska Ship and Dry
Dock of Ketchikan, and the small-
est is Magone Marine Services in
Dutch Harbor. All of these ship
builders service the state’s giant
fi shing fl eet, but they also provide
services to the ferry system, the
oil patch, the visitor industry, and
other industries.
Manufacturing Minus Seafood
Alaska, 2009
Source: Alaska Department of Labor and Workforce Development, Research and Analysis Section
2
Source: Alaska Department of Labor and Workforce Development, Research and Analysis Section
Employment Payroll
Average
Earnings Units
All other manufacturing (minus seafood
processing)
3,721 $182,990,918 $49,181 403
Wood products 285 $11,551,993 $40,557 27
Nonmetallic mineral products 328 $17,478,304 $53,328 29
Cement and concrete products 315 $17,154,440 $54,473 24
Primary metals 23 $1,169,707 $50,857 7
Fabricated metal products 428 $22,158,248 $51,802 51
Machinery 82 $4,705,897 $57,447 11
Computer and electronics 112 $8,143,383 $72,980 10
Electrical equipment and appliances 26 $1,388,269 $54,265 4
Transportation equipment 430 $20,493,388 $47,715 40
Ship and boat building 345 $17,494,971 $50,784 23
Furniture and related products 116 $4,144,464 $35,883 27
Miscellaneous 207 $7,177,356 $34,757 43
Bakeries and tortillas 225 $6,900,218 $30,702 15
Beverages and tobacco 182 $5,723,552 $31,448 18
Bottled water 16 $452,105 $27,539 3
Breweries 148 $5,034,789 $34,115 10
Textile product mills 74 $2,310,855 $31,123 10
Leather and allied products 5 $60,401 $13,178 3
Printing and related support 356 $11,886,673 $33,413 42
Petroleum and coal 410 $43,402,116 $105,967 10
Petroleum refi neries 395 $42,298,295 $106,971 8
Chemicals 51 $2,888,660 $56,456 12
Plastics and rubber 140 $6,128,783 $43,803 11
Total manufacturing 12,868 $474,776,697 $36,896 561
Percent of total manufacturing 29% 39% 133% 72%
Percent of total employment 1.2% 1.2% 105.5% 1.8%
Total, all industries: 2009 320,265 $14,933,881,341 $46,630 21,986
Employment in the Rest of Manufacturing
Alaska, 2009
3
Wood products
8%
Cement and concrete
9%
Fabricated metal
12%
Transportation equipment
12%
Ship building
9%
Bakeries
6%
Breweries
4%
Printing
10%
Refineries
11%
Computers
and electronics
3%
Plastics and rubber
4%
Balance of "other"
14%
14
ALASKA ECONOMIC TRENDS NOVEMBER 2010
In a related vein, there is a
long list of metal fabrica-
tors and machine shops.
Two of these companies,
STEELFAB in Anchorage
and Greer Tank of Fair-
banks, fabricate products
for construction contrac-
tors as well as the fi shing,
oil, and mining industries.
Much of their work is cus-
tom, but some also mass-
produce products like fuel
storage tanks.
And then there’s food,
a product that doesn’t
automatically invoke the
subject of manufacturing
but plays a prominent role.
When we include seafood
processing, food produc-
tion represents three-quar-
ters of the state’s manu-
facturing industry, versus
12 percent for the nation.
At the top of the “foodies”
list is Sunshine Bakery of
Anchorage, a company
well known for national
brands like Wonder Bread.
L’Aroma and Great Har-
vest Bread Company also
made the top 50, but there
are another 12 bakeries
beyond this roll call that
show up as employers in
Alaska.
Three other major play-
ers in the food business
are Alaska Wildberry
Products of Anchorage
and Homer, Silver Gulch
Brewing of Fairbanks,
and Alaska Sausage of
Anchorage. They cater to
locals as well as visitors,
and they ship their prod-
ucts around the world.
Many of these manufac-
Rank Firm Name Employment Business Activity
Headquartersor
largest work site
1 Tesoro Company Alaska 100 to 249 Petroleum refi nery Nikiski
2 Flint Hill Resources 100 to 249 Petroleum refi nery Fairbanks
3 Alaska Ship and Dry Dock 100 to 249 Ship and boat building Ketchikan
4 Builders Choice 100 to 249 Wood products Anchorage
5 Anchorage Sand and Gravel 100 to 249 Construction sand
and gravel mining
Anchorage
6 Interstate Brands (Sunshine
Bakery)
100 to 249 Bakery Anchorage
7 Siemens 50-99 Computer and electronics Anchorage
8 Alaskan Brewing Company 50-99 Brewery Juneau
9 Alaska Wildberry Products 50-99 Sugar and confectionary Anchorage
10 STEELFAB 50-99 Metal fabrication Anchorage
11 Petro Star 1-49 Petroleum refi nery Valdez
12 Unique Machine 1-49 Machine shop Anchorage
13 Allen Marine 1-49 Ship and boat building Sitka
14 Silver Gulch Brewing and Bottling 1-49 Brewery Fairbanks
15 Seward Ships Dry Docks 1-49 Ship and boat building Seward
16 Alaska Sausage 1-49 Meat processing Anchorage
17 GLM 1-49 Machine shop Kenai
18 Capitol Glass/Northern Windows 1-49 Glass, windows, and door
products
Anchorage
19 Greer Tank and Welding 1-49 Metal fabrication Fairbanks
20 A T Publishing 1-49 Printing Anchorage
21 Magone Marine Services 1-49 Ship and boat building Dutch Harbor
22 Kinko’s 1-49 Printing Anchorage
23 Alaska Tent and Tarp 1-49 Textiles Fairbanks
24 L’Aroma 1-49 Bakery Anchorage
25 Alkan Shelter 1-49 Plastics Fairbanks
26 Alaska Roteq 1-49 Metal fabrication Wasilla
27 Equipment Source 1-49 Heating equipment Fairbanks
28 Pip Printing 1-49 Printing Anchorage
29 Alaska Serigraphics 1-49 Printing Anchorage
30 Viking Lumber Company 1-49 Wood products Craig
31 Klondike Concrete 1-49 Cement and concrete products Anchorage
32 Harris Sand And Gravel 1-49 Cement and concrete products Valdez
33 Great Harvest Bread Company 1-49 Bakery Anchorage
34 Northland Wood Products 1-49 Wood products Fairbanks
35 Dowland Bach 1-49 Mining and oil and gas fi eld
machinery
Anchorage
36 The Welding Shop 1-49 Metal fabrication Fairbanks
37 Ketchikan Ready Mix and Quarry 1-49 Cement and concrete products Ketchikan
38 Arctic Insulation 1-49 Insulation and foam products Wasilla
39 Anchorage Printing 1-49 Printing Anchorage
40 Warning Lites of Alaska 1-49 Signs Anchorage
41 Sampson Steel Company 1-49 Metal fabrication Anchorage
42 A T & S 1-49 Urethane and other foam
products
Fairbanks
43 Delta Concrete Products 1-49 Cement and concrete products Delta
44 Valley Block and Concrete 1-49 Cement and concrete products Wasilla
45 Davis Block and Concrete 1-49 Cement and concrete products Soldotna
46 Insulfoam 1-49 Insulation and foam products Anchorage
47 Engineered Fire And Safety 1-49 Communications equipment Anchorage
48 J R Heritage Construction 1-49 Commercial cabinet casework Anchorage
49 AK Litho 1-49 Printing Juneau
50 Glacier Sign and Lighting 1-49 Signs Anchorage
Source: Alaska Department of Labor and Workforce Development, Research and Analysis Section
The Top 50 “Other” Manufacturers
Alaska, 2009
4
15
NOVEMBER 2010 ALASKA ECONOMIC TRENDS
Industry
Resident
workers
Nonresident
workers
Percent
nonresident
Resident
wages
Nonresident
wages
Percent
nonresident
Resident
earnings
per qtr.
Nonresident
earnings
per qtr.
Manufacturing
Food 5,897 15,691 72.7% $117,913,911 $188,013,010 61.5% $6,274 $5,808
Beverages and tobacco 194 55 22.1% $4,950,867 $542,745 9.9% $7,724 $4,342
Textiles 7 ND ND $114,521 ND ND $4,772 ND
Textile products 88 11 11.1% $2,309,501 $188,836 7.6% $7,263 $7,868
Apparel 10 ND ND $157,151 ND ND $5,069 ND
Leather and allied products ND ND ND ND ND ND ND ND
Wood products 497 97 16.3% $13,770,728 $1,587,752 10.3% $8,407 $6,785
Paper 7 ND ND $243,855 ND ND $9,032 ND
Printing and related support 401 57 12.4% $12,156,101 $811,090 6.3% $8,537 $6,008
Petroleum and coal 691 30 4.2% $53,857,421 $619,109 1.1% $20,714 $9,525
Chemicals 144 10 6.5% $7,613,558 $315,873 4.0% $17,583 $15,794
Plastics and rubber 156 21 11.9% $5,303,882 $367,807 6.5% $9,877 $7,826
Nonmetallic minerals 286 60 17.3% $10,226,749 $1,034,613 9.2% $10,414 $7,086
Primary metals 39 7 15.2% $1,446,563 $73,285 4.8% $11,042 $4,580
Fabricated metal products 509 82 13.9% $22,647,234 $1,354,070 5.6% $12,745 $7,965
Machinery 74 8 9.8% $4,001,262 $240,933 5.7% $14,603 $10,475
Computer and electronics 107 8 7.0% $7,055,229 $313,782 4.3% $17,124 $15,689
Electrical equipment,
appliances, and components 30 ND ND $1,578,286 ND ND $14,092 ND
Transportation equipment 401 188 31.9% $12,591,460 $3,563,805 22.1% $9,425 $8,526
Furniture and related products 145 25 14.7% $4,507,290 $343,073 7.1% $9,015 $6,353
Miscellaneous 245 32 11.6% $7,329,143 $438,555 5.6% $8,674 $6,265
Total private sector 255,129 74,435 22.6% $9,007,138,038 $1,696,847,263 15.7% $10,438 $10,162
Local government 46,548 3,282 6.6% $1,465,682,598 $49,459,058 3.3% $9,217 $7,302
State government 25,856 1,902 6.9% $1,106,999,850 $35,470,154 3.1% $11,705 $8,303
Total private and government 327,533 79,619 19.6% $11,579,820,486 $1,781,776,475 13.3% $10,372 $10,010
Resident and Nonresident Workers and Earnings
“Other Manufacturing,” Alaska, 2008
5
ND: Not disclosable
Source: Alaska Department of Labor and Workforce Development, Research and Analysis Section
turers are major participants in the state’s visitor
industry, providing local fl avor that tourists often
hunger for.
The demise of wood products
Exhibit 4 shows just three wood product manufac-
turers. The largest is Builders Choice of Anchor-
age: a manufacturer of modular homes, trusses,
and wall panels. The weak showing of wood is
historically signifi cant, because wood was once a
powerhouse in Alaska’s economy. In 1990, there
were four wood product manufacturers that made
the list of 100 largest private-sector employers in
the state — and they were all in Southeast Alaska.
That year, the Ketchikan Pulp Company was the
largest manufacturing employer in the state with
903 employees, and it was also the ninth-largest
overall private sector employer. The Ketchikan
pulp mill closed in 1997. And in 2009, no wood
manufacturer even made the list. For more on the
decline of the timber industry, see the October
2010 issue of Alaska Economic Trends.
Wages are decent
The average annual earnings for the “other manu-
facturers” in 2009 were $49,181, or more than
$12,000 higher than overall manufacturing wages
and 5 percent above earnings across all industries.
(See Exhibit 3.) The reason is the exclusion of
seafood processing’s lower average annual earn-
ings of $31,898.
The earnings for the rest of manufacturing vary
widely, from a high of $106,971 for refi neries to a
16
ALASKA ECONOMIC TRENDS NOVEMBER 2010
“Other” Manufacturing Employs Few
Alaska, 2009
Source: Alaska Department of Labor and Workforce Development, Research and Analysis Section
6
low of $27,539 for water bot-
tlers.
Employs residents
Alaska’s manufacturing indus-
try employs more nonresidents
as a percentage of the work-
force than any other industry.
In 2008, over 64 percent of
Alaska’s manufacturing work-
ers were from out-of-state,
mostly because three-quarters
of seafood workers were
nonresidents. This is because
seafood processing is highly
seasonal, but the “rest” of
manufacturing is not. When we
exclude seafood workers, the
residency picture changes dra-
matically. (See Exhibits 5 and
6.) In that case, the category
with the highest percentage of
nonresidents was transportation
equipment at 32 percent, and
lowest was refi neries at just 4
percent. All other manufactur-
ing categories fell somewhere
in between.
Over the past decade, em-
ployment in Alaska’s “other”
manufacturing hasn’t changed
much — a different story from
the huge losses in the national
industry. (See Exhibit 7.) In
part, the recent U.S. recession
had a muted effect on Alaska.
Also, a big piece of Alaska’s
manufacturing industry ex-
ists to serve locals and their
industries, and both have been
relatively stable over the last
decade. This has kept Alaska’s
manufacturers on a more even
keel than their national coun-
terparts.
Employment Steady the Past Decade
Alaska, 2000 to 2009
Source: Alaska Department of Labor and Workforce Development, Research and Analysis Section
7
3,652
3,734
3,746
3,683
3,775
3,877
3,839
4,004
3,963
3,723
3,700
2000 2001 2002 2003 2004 2005 2006 2007 2008 2009 2010*
0
1,000
2,000
3,000
4,000
Rest of manufacturing employment
*Estimated
Dec
to Jan*
Jan
to Feb
Feb
to Mar
Mar
to Apr
Apr
to May
May
to Jun
Jun
to Jul
Jul
to Aug
Aug
to Sept
Sept
to Oct
Oct
to Nov
Nov
to Dec
0%
10%
20%
30%
40%
50%
60%
70%
Monthly employment swings by percentage, 2009
*Represents December 2008 to January 2009. The rest are 2009 monthly changes.
Seafood processing
Alaska total employment
“Other” manufacturing
17
NOVEMBER 2010 ALASKA ECONOMIC TRENDS
Unemployment Rates, Alaska and U.S.
January 2001 to September 2010
A
laska’s seasonally adjusted unemployment
rate for September inched up slightly, to
7.8 percent. August’s revised rate did not
change, staying at 7.7 percent.
The comparable national jobless rate for
September was 9.6 percent, unchanged from
August. The unemployment rate in Alaska has
recovered a bit faster than it has nationwide.
Exactly a year ago, the U.S. rate was 9.8 percent,
compared to 8.3 percent for Alaska. September
was also the 23rd consecutive month that Alaska’s
rate was lower.
Unemployment rises in most areas
Regional unemployment rates not seasonally
adjusted increased slightly in September.
This is typical as fi shing and tourism drop off
considerably and construction work tapers down.
These unemployment numbers will continue to
rise for the next fi ve to six months as winter sets
in.
In nearly all of the regions, unemployment
rates came in slightly below year-ago levels.
For example, Southeast’s unemployment rate in
September was 6.2 percent, versus 6.7 percent last
year. The Northern region was the only area where
the jobless rate came in three-tenths of a percent
higher than a year ago, possibly because the oil
industry has slowed.
Lowest rates will soon change
In September, like August, the areas with both
the highest and lowest unemployment rates
were unchanged. The Bristol Bay Borough and
Skagway had the lowest unemployment rates, and
the numbers were highest in the Wade Hampton
and Bethel census areas. However, some of these
rankings will change with the onset of winter, and
areas with higher rates will have more company.
1
Source: Alaska Department of Labor and Workforce Development, Research and Analysis
Section
By NEAL FRIED, Economist
Employment Scene
Unemployment rate at 7.8 percentr
c
c
c
e
e
e
e
e
n
n
n
n
n
t
t
t
t
t
Seasonally Adjusted
Alaska
U.S.
2001 2002 2003 2004 2005 2006 2007 2008 2009
4%
6%
8%
10%
12%
2010
A few more labor force facts
When you fi lled out your forms for the 2010
decennial census, you may have noticed they
were short and there were no questions about
the labor force, housing, income, and other
past subjects. This is because the long form
was eliminated and replaced by the American
Community Survey (ACS), which is collecting
this information in an ongoing survey. ACS
recently released 2009 data, and here are a few
facts about Alaska’s labor force and how we
ranked nationwide.
Alaska’s workforce participation typically
ranks above average. For example, Alaska
came in 20th for the percentage of people aged
16 to 64 who are working, with 76.5 percent
of this group tied to the labor force versus 75.2
percent for the nation. Among women, 66.7
percent in Alaska were active, compared to
59.8 percent in the rest of the nation. Female
earnings in Alaska were $39,017, ranked
ninth-highest in the country but equaling only
66 percent of their male counterparts (ranked
sixth in the U.S.).
For more details on ACS, visit www.census.
gov.
18
ALASKA ECONOMIC TRENDS NOVEMBER 2010
Prelim.
Revised
SEASONALLY ADJUSTED
09/10 08/10 09/09
United States 9.6 9.6 9.8
Alaska Statewide 7.8 7.7 8.3
NOT SEASONALLY ADJUSTED
United States 9.2 9.5 9.5
Alaska Statewide 7.3 7.0 7.7
Anchorage/Mat-Su Region
7.0 6.7 7.3
Municipality of Anchorage 6.8 6.5 7.0
Matanuska-Susitna Borough 8.0 7.7 8.7
Gulf Coast Region 8.1 7.3 8.3
Kenai Peninsula Borough 9.0 8.1 9.3
Kodiak Island Borough 5.7 5.7 6.0
Valdez-Cordova Census Area 6.5 5.4 6.4
Interior Region 6.8 6.7 7.2
Denali Borough 4.0 3.4 4.1
Fairbanks North Star Borough 6.5 6.3 6.8
Southeast Fairbanks Census Area 7.3 8.5 8.3
Yukon-Koyukuk Census Area 13.0 13.2 13.7
Northern Region 10.0 10.2 9.7
Nome Census Area 12.7 14.0 12.6
North Slope Borough 5.6 5.4 5.5
Northwest Arctic Borough 13.7 13.1 12.9
Southeast Region 6.2 5.9 6.7
Haines Borough 4.9 4.2 5.5
Hoonah-Angoon Census Area
1
9.7 9.0 8.7
Juneau, City and Borough of 5.4 5.3 5.9
Ketchikan Gateway Borough
1
6.0 5.3 5.9
Prince of Wales-Outer Ketchikan CA
1
12.9 12.8 14.1
Sitka, City and Borough of 5.5 5.1 5.9
Skagway, Municipality of
1
3.8 2.5 5.6
Wrangell-Petersburg Census Area
1
7.8 6.6 8.8
Yakutat, City and Borough of 6.7 7.3 8.9
Southwest Region 11.7 10.6 12.2
Aleutians East Borough 7.8 6.0 9.1
Aleutians West Census Area 7.6 4.8 9.8
Bethel Census Area 14.8 14.9 14.2
Bristol Bay Borough 2.9 1.8 3.0
Dillingham Census Area 8.5 7.0 9.3
Lake and Peninsula Borough 5.5 5.7 6.2
Wade Hampton Census Area 18.9 20.4 19.4
1
Because of the creation of new boroughs, this borough or
census area has been changed or no longer exists. Data for the
Skagway Municipality and Hoonah-Angoon Census Area (previ-
ously Skagway-Hoonah-Angoon Census Area) became available
in 2010. Data for the Wrangell Borough, and Petersburg and
Prince of Wales-Hyder census areas will be available in 2011.
Until then, data will continue to be published for the old areas.
4
Regional Employment
Nonfarm wage and salary
Preliminary Revised Changes from Percent Change
9/10 8/10 9/09 8/10 9/09 8/10 9/09
Anch/Mat-Su 175,900 174,100 174,700 1,800 1,200 1.0% 0.7%
Anchorage 154,150 153,200 153,550 950 600 0.6% 0.4%
Gulf Coast 31,800 34,400 32,000 -2,600 -200 -7.6% -0.6%
Interior 48,550 48,200 48,050 350 500 0.7% 1.0%
Fairbanks
8
39,100 39,100 39,800 0 -700 0.0% -1.8%
Northern 19,550 19,800 20,100 -250 -550 -1.3% -2.7%
Southeast
39,200 42,100 39,200 -2,900 0 -6.9% 0.0%
Southwest 20,250 23,250 20,150 -3,000 100 -12.9% 0.5%
3
Unemployment Rates
Borough and census area
2
Statewide Employment
Nonfarm wage and salary
Preliminary Revised
Year-Over-Year Change
Alaska
9/10 8/10 9/09 9/09
90% Confi dence
Interval
Total Nonfarm Wage and Salary
1
335,100 346,500 334,400 700 -6,683 8,083
Goods-Producing
2
50,700 60,700 48,100 2,600 -284 5,484
Service-Providing
3
284,400 285,800 286,300 -1,900
––
Mining and Logging 17,900 17,900 15,000 2,900 2,107 3,693
Mining 17,400 17,500 14,700 2,700
––
Oil and Gas 11,700 12,000 12,400 -700
––
Construction 18,800 20,100 18,700 100 -2,483 2,683
Manufacturing 14,000 22,700 14,400 -400 -1,394 594
Seafood Processing 10,300 18,300 10,600 -300
––
Trade, Transportation, Utilities 64,600 67,500 66,100 -1,500 -3,872 872
Wholesale Trade 6,700 6,900 6,400 300 -256 856
Retail Trade 36,300 37,800 36,700 -400 -2,428 1,628
Food and Beverage Stores 6,400 6,700 6,400 0
––
General Merchandise Stores 10,100 10,500 10,200 -100
––
Transportation, Warehousing, Utilities 21,600 22,800 23,000 -1,400 -2,438 -362
Air Transportation 5,300 5,600 6,200 -900
––
Truck Transportation 3,100 3,300 3,200 -100
––
Information 6,400 6,400 6,500 -100 -681 481
Telecommunications 4,100 4,200 4,300 -200
––
Financial Activities 13,800 14,000 14,900 -1,100 -3,043 843
Professional and Business Services 25,500 25,600 26,900 -1,400 -3,193 393
Educational
4
and Health Services
40,700 40,000 39,500 1,200 -68 2,468
Health Care 29,100 28,700 28,400 700
––
Leisure and Hospitality 35,500 39,800 35,200 300 -1,737 2,337
Accommodations 9,800 11,700 9,700 100
––
Food Services and Drinking Places 20,600 22,500 20,400 200
––
Other Services 11,300 11,100 11,500 -200 -3,376 2,976
Government 86,600 81,400 85,700 900
––
Federal Government
5
17,500 18,300 17,400 100
––
State Government 26,600 24,700 26,000 600
––
State Government Education
6
8,100 5,900 7,600 500
––
Local Government 42,500 38,400 42,300 200
––
Local Government Education
7
24,400 19,500 23,600 800
––
Tribal Government 3,800 3,900 3,700 100
––
A dash indicates that confi dence intervals aren’t available at this level.
1
Excludes the self-employed, fi shermen and other agricultural workers, and private household
workers. For estimates of fi sh harvesting employment, and other fi sheries data, go to
labor.alaska.gov/research/seafood/seafood.htm.
2
Goods-producing sectors include natural resources and mining, construction, and manufacturing.
3
Service-providing sectors include all others not listed as goods-producing sectors.
4
Private education only
5
Excludes uniformed military
6
Includes the University of Alaska
7
Includes public school systems
8
Fairbanks North Star Borough
Sources for Exhibits 1, 2, and 3: Alaska Department of Labor and Workforce Development, Research
and Analysis Section; U.S. Department of Labor, Bureau of Labor Statistics
Sources for Exhibit 4: Alaska Department of Labor and Workforce Development, Research and
Analysis Section; also the U.S. Department of Labor, Bureau of Labor Statistics, for
Anchorage/Mat-Su and Fairbanks
Changes in Producing the Estimates
The U.S. Department of Labor’s Bureau of Labor Statistics has
implemented a change to the method used to produce state-
wide wage and salary employment estimates. That change
has resulted in increased monthly volatility in the wage and
salary estimates for many states, including Alaska. Therefore,
one should be very cautious in interpreting any over-the-year
or month-to-month change for these monthly estimates. The
Quarterly Census of Employment and Wages series may be
a better source of information for trends analysis (http://labor.
alaska.gov/qcew.htm).
For more current state and regional employment and unemployment data, visit our Web site: laborstats.alaska.gov
19
NOVEMBER 2010 ALASKA ECONOMIC TRENDS
The seafood processing industry has well over 100
shore-based plants operating throughout Alaska.
Historically, these work sites have had high accident and
injury rates. To reduce these rates, a growing number of
industry employers are requesting free and non-punitive
assistance from the Alaska Occupational Safety and
Health (AKOSH), Consultation and Training section
of the Alaska Department of Labor and Workforce
Development.
In recent years, companies have entered into a
partnership with AKOSH to develop safety and health
programs and workplace strategies. These relationships
have benefi tted the seafood processing industry by
reducing the number of accidents, injuries, illnesses, and
“bottom line” costs, which furthers the goal of a safer
workplace.
The Department of Labor recognizes the achievements
of these proactive facilities through the Safety and
Health Achievement Recognition Program (SHARP) and
the Voluntary Protection Program (VPP) designations.
These on-site consultation programs provide incentives
and recognition for employers who operate exemplary
safety and health management systems. Trident
Seafoods, Unisea, and Island Seafoods have qualifi ed
at certain locations and achieved tremendous results
in reduced accidents, associated costs, and increased
productivity.
Employers are responsible for the safety and health
of the men and women working in their facilities. If
you are concerned about your employees’ well-being
and interested in improving productivity and reducing
operating costs, it’s in your company’s interest to
schedule a free on-site visit. For further assistance,
contact the AKOSH Consultation and Training section at
(907) 269-4955 or (800) 656-4972.
For many years, Alaska and the nation have honored vet-
erans during the month of November. Veterans Day, ob-
served on November 11, is the anniversary of the World
War I armistice that ended hostilities on the 11th hour of
the 11th day of the 11th month of 1918.
Alaska has also instituted “Hire a Veteran Month” in No-
vember, beginning with a proclamation by the governor
and led by the Alaska Department of Labor and Workforce
Development.
The department will host its annual Alaska Veterans’
Job Fair on November 10 from 10 a.m. to 3 p.m. at the
Muldoon Job Center, 1251 Muldoon Road in Anchorage.
More than 65 employers and education, training, and ap-
prenticeship providers are expected to participate with
close to 1,000 job seekers attending.
Alaska’s Jobs for Veterans Program emphasizes ser-
vice priority for veterans and others who are eligible
through our online services and at all job centers. The
program helps connect veterans with their represen-
tatives and potential employers. Veterans’ represen-
tatives are located in the Job Centers in Anchorage,
Eagle River, Fairbanks, Juneau, Kenai, and Mat-Su.
The latest information available from the Veterans
Administration and the Bureau of Labor Statistics
shows that Alaska is home to nearly 77,000 veterans
— more than 46,000 work in the state as of 2009 (not
seasonally adjusted). During state fi scal year 2010,
our job centers served more than 14,269 veterans, in-
cluding 960 transitioning service members and 1,643
who recently separated from service.
Employers who would like to hire veterans should
contact their nearest Alaska Job Center. For more in-
formation about the veteran employment and training
program, go to: />To fi nd the nearest job center, visit: s.
alaska.gov/ and click on “Alaska Job Centers” on the
left, or call (877) 724-2539.
Employer Resources
A Safety Minute
Hire a veteran in November
Reduce seafood processing injuries