Báo cáo Y học: Mycobacterium tuberculosis FprA, a novel bacterial NADPH-ferredoxin reductase docx
Bạn đang xem bản rút gọn của tài liệu. Xem và tải ngay bản đầy đủ của tài liệu tại đây (357.63 KB, 9 trang )
Mycobacterium tuberculosis
FprA, a novel bacterial
NADPH-ferredoxin reductase
Federico Fischer, Debora Raimondi, Alessandro Aliverti and Giuliana Zanetti
Dipartimento di Fisiologia e Biochimica Generali, Universita
`
degli Studi di Milano, Milano, Italy
The gene fprA of Mycobacterium tuberculosis, encoding a
putative protein with 40% identity to mammalian adreno-
doxin reductase, was expressed in Escherichia coli and the
protein purified to homogeneity. The 50-kDa protein
monomer contained one tightly bound FAD, whose fluor-
escence was fully quenched. FprA showed a low ferric
reductase activity, whereas it was very active as a NAD(P)H
diaphorase with dyes. Kinetic parameters were determined
and the specificity constant (k
cat
/K
m
)forNADPHwastwo
orders of magnitude larger than that of NADH. Enzyme full
reduction, under anaerobiosis, could be achieved with a
stoichiometric amount of either dithionite or NADH, but
not with even large excess of NADPH. In enzyme titration
with substoichiometric amounts of NADPH, only charge
transfer species (FAD-NADPH and FADH
2
-NADP
+
)
were formed. At NADPH/FAD ratios higher than one, the
neutral FAD semiquinone accumulated, implying that the
semiquinone was stabilized by NADPH binding. Stabiliza-
tion of the one-electron reduced form of the enzyme may be
instrumental for the physiological role of this mycobacterial
flavoprotein. By several approaches, FprA was shown to be
able to interact productively with [2Fe)2S] iron-sulfur pro-
teins, either adrenodoxin or plant ferredoxin. More inter-
estingly, kinetic parameters of the cytochrome c reductase
reaction catalyzed by FprA in the presence of a 7Fe ferre-
doxin purified from M. smegmatis were determined. A K
m
value of 30 n
M
and a specificity constant of 110 l
M
)1
Æs
)1
(10 times greater than that for the 2Fe ferredoxin) were
determined for this ferredoxin. The systematic name for
FprA is therefore NADPH-ferredoxin oxidoreductase.
Keywords: flavoprotein; ferredoxin reductase; ferredoxin;
Mycobacterium tuberculosis.
Information available from the complete genome sequence
of Mycobacterium tuberculosis [1] has promoted a wide
investigation of new targets for drugs against tuberculosis
[2]. The disease has regained ground in the developed world
due to the increased appearance of resistant strains of the
bacterium and the facile diffusion in the immunodepressed
people. M. tuberculosis is strongly dependent on iron
availability and on iron-containing cofactors for growth
and survival [3]. It is well-known that iron availability in the
host plays a very important role in promoting the infection
by mycobacteria. Interestingly, it has been reported that
Nramp1 (natural resistance-associated macrophage protein)
protein of mouse macrophages confers resistance to myco-
bacterial infection in mice [4]. Recently, a hyphothesis has
been proposed based on the homology of Nramp1 to
DCT1, a metal-ion transporter [5]. Thus, the action of
Nramp1 in the phagosomal membrane may be to deplete
Fe
2+
or other divalent cations from the phagosome, thus
hampering the pathogen growth. Among possible strategies
to effectively interfere with the pathogen metabolism, the
blockage or limitation of Fe
2+
availability inside the
mycobacterium seems a promising target to pursue. Redox
systems called ferric reductases use intracellular redox
cofactors to reduce the ferric Fe to the ferrous form for
biosynthesis of iron-proteins. A NAD(P)H:ferrimycobactin
oxidoreductase activity was measured in M. smegmatis cell
extract [6]. In Escherichia coli, enzymes of the ferredoxin-
NADP
+
reductase (FNR) protein family showing iron
reductase activity, such as the flavin reductase, sulfite
reductase and flavohemoglobin, have been implicated in
such metabolism [7]. Searches of the M. tuberculosis
genome for enzymes structurally related to the FNR family
was unsuccessful but led to the identification of two genes,
fprA and fprB, encoding putative adrenodoxin reductase-
like proteins, expected to be functionally related to members
of the FNR family [8], i.e. electron transferases that function
as a switch between two-electron and one-electron flow
systems. This class of enzymes is implicated in a variety of
functions such as iron reduction, activation of ribonucleo-
tide reductase, response to oxygen stress as well as reduction
of P450 cytochromes [8].
Here, we report on production and biochemical charac-
terization of the recombinant FprA. The homogeneous
protein is shown to be a novel bacterial ferredoxin reductase
Correspondence to G. Zanetti, Dipartimento di Fisiologia
e Biochimica Generali, Via Celoria 26, 20133 Milano, Italy.
Fax: + 39 02 50314895. Tel.: + 39 02 50314896,
E-mail:
Abbreviations: AdR, adrenodoxin reductase; Adx, adrenodoxin;
FNR, ferredoxin-NADP
+
reductase; Fd I, ferredoxin I; DPIP,
2,6-dichlorophenol-indophenol; SQ, semiquinone; CT,
charge-transfer complex.
Proteins: Bos taurus adrenodoxin, SWISS-PROT entry
ADX1_BOVIN; Spinacia oleracea ferredoxin I, SWISS-PROT entry
FER1_SPIOL; Mycobacterium smegmatis ferredoxin, SWISS-PROT
entry FER_MYCSM.
Enzymes: adrenodoxin reductase (EC 1.18.1.2), ferredoxin-NADP+
reductase (EC 1.18.1.2)
Note: a website is available at />Index_htm
(Received 1 February 2002, revised 11 April 2002,
accepted 2 May 2002)
Eur. J. Biochem. 269, 3005–3013 (2002) Ó FEBS 2002 doi:10.1046/j.1432-1033.2002.02989.x
and to possess some properties similar to those of the bovine
adrenodoxin reductase [9].
MATERIALS AND METHODS
Materials
All chemicals and pyridine nucleotides were purchased from
Sigma–Aldrich Chemical Co. Cytochrome c (Sigma C2506)
was further purified by ion-exchange chromatography on
SP-Sepharose (Pharmacia Biotech.). Restriction endonuc-
leases, DNA polymerase and DNA modifying enzymes
were supplied by Amersham Pharmacia Biotech. M. tuber-
culosis cosmid MTCY164 was kindly provided by S. T.
Cole, Institut Pasteur, France. pGEM-T and pET11a were
from Promega and Novagen, respectively. Bovine Adx
1
was
a generous gift from F. Bonomi, University of Milano,
Italy. Recombinant spinach ferredoxin I (Fd I) was purified
as described previously [10]. M. smegmatis ferredoxin has
been purified by a modification of the procedure described
by Imai et al. [11]. DEAE-cellulose and Sepharose 4B steps
were replaced by chromatoraphy on HiLoad Q-Sepharose
High-Performance and HiLoad phenyl-Sepharose High-
Performance columns (Pharmacia Biotech). Ferredoxin was
eluted at about 0.7
M
NaCl from the first column using a
0–1
M
NaCl gradient in 50 m
M
Tris/HCl, pH 7.4. The
pooled fractions were brought to 2
M
ammonium sulphate
and loaded on the second column. Elution was performed
with a 2–0
M
ammonium sulphate gradient in the same
buffer as above. Ferredoxin was desalted by dialysis against
50 m
M
Tris/HCl, pH 7.4.
PCR amplification and molecular cloning
The open reading frame of the M. tuberculosis gene Rv3106,
named fprA, was amplified from the cosmid MTCY164
(GenBank accession no. Z95150) by PCR using the
nucleotides 5¢-GC
CATATGATGCGTCCCTATTACA-3¢
and 5¢-GT
CATATGTCAGCCGAGCCCAAT-3¢,which
contained the NdeI restriction site (underlined). The result-
ing DNA fragment was cloned into pGEM-T vector and
sequenced. The NdeI DNA fragment from the recombinant
plasmid containing fprA was recloned in the NdeIsiteofthe
expression vector pET-11a, yielding pETfprA.
Overexpression of fprA
E.coliBL21(DE3) cells transformed with pETfprA were
grown in flasks under vigorous shaking at various temper-
atures in 2 · YT medium supplemented with 100 mgÆL
)1
ampicillin. For enzyme purification, E.colicells were grown
in a New Brunswick 12 L fermentor at 25 °C to midlog
phase (D
600
¼ 1.2–1.5). The culture, after cooling to 15 °C,
was induced with 0.1 m
M
isopropyl thio-b-
D
-galactoside.
Cells were harvested after 15–17 h.
Purification of FprA
All purification steps were performed at 4 °Cexceptfor
FPLC, which was carried out at room temperature. E.coli
cell paste were resuspended in 2 mLÆg
)1
of buffer A
(50 m
M
Na-phosphate, pH 7.0, containing 1 m
M
EDTA
and 1 m
M
2-mercaptoethanol) supplemented with 1 m
M
phenylmethanesulfonyl fluoride and disrupted by sonica-
tion. After removal of cell debris by centrifugation at
43 000 g for 1 h, the protein concentration of the crude
extract was adjusted to 25 mgÆmL
)1
. The solution was then
brought to 40% saturation of ammonium sulphate
(1.64
M
), the precipitate discarded and the soluble fraction
loaded on Sepharose 4B column (Pharmacia Biotech) pre-
equilibrated with 1.64
M
ammonium sulphate in buffer A.
FprA was eluted with the same solution as a single peak
well separated from the material eluting in the void
volume. To the pooled FprA-containing fractions glycerol
was added to 10% final concentration and the enzyme was
precipitated with 85% saturation ammonium sulphate. The
pellet was resuspended and dialysed against 25 m
M
imidazole-HCl, pH 7.0, containing 10% glycerol and
1m
M
2-mercaptoethanol. The enzyme was loaded on a
HiLoad Q-Sepharose High-Performance column (Pharma-
cia Biotech) and eluted with a linear gradient from 150 to
250 m
M
NaCl. The purified FprA was desalted by gel-
filtration on PD10 column (Pharmacia Biotech) using
50 m
M
Hepes/KOH, pH 7.0, containing 10% glycerol and
1m
M
DTT. The enzyme stored at )80 °Cretaineditsfull
activity for more than 1 year.
Molecular characterization methods
SDS/PAGE was carried out on 10% polyacrylamide gels.
Microsequencing was performed on an Applied Biosystems
477/A protein sequencer equipped with an on-line HPLC
system. Analytical gel-filtration analyses were performed on
a HPLC apparatus (Waters) equipped with either Superdex
75 or Superose 12 columns (Pharmacia Biotech) in 50 m
M
Hepes/KOH, pH 7.0, containing 0.15
M
ammonium acetate
and 2 m
M
2-mercaptoethanol. FprA and ferredoxin (10 and
40 l
M
, respectively) were cross-linked by treatment with
5m
M
N-ethyl-3-(3-dimethylaminopropyl)carbodiimide in
25 m
M
Na-phosphate, pH 7.0 [12].
Spectral analyses
Absorption spectra were recorded with a Hewlett-Packard
8453 diode-array spectrophotometer. The extinction coeffi-
cient of the protein-bound flavin was determined spectro-
photometrically quantitating the FAD released from the
apoprotein following SDS treatment [13]. Fluorescence
measurements were performed on a Jasco FP-777 spectro-
fluorometer at 15 °C. The identity of the enzyme bound
flavin was assessed fluorimetrically by treating with phos-
phodiesterase the flavin released after thermal denaturation
at 100 °C of the holoenzyme [13].
Activity assays
Enzyme catalyzed reactions were monitored continuously
on a Hewlett-Packard 8453 diode-array spectrophotometer.
Ferric reductase activity was assayed in both aerobic and
anaerobic conditions in 50 m
M
Tris/HCl, pH 7.5 at 25 °C
as described previously [14]. Diaphorase activity was
measured in 0.1
M
Tris/HCl, pH 8.2 at 25 °C with either
K
3
Fe(CN)
6
or DPIP as electron acceptor and NADPH or
NADH as reductants. Cytochrome c reductase activity was
assayed in the same buffer as above with either 5 l
M
spinach Fd I, bovine Adx or M. smegmatis ferredoxin,
3006 F. Fischer et al. (Eur. J. Biochem. 269) Ó FEBS 2002
using 50 l
M
cytochrome c as the terminal electron acceptor.
Unless otherwise stated, the NADPH concentration
was kept constant by regeneration with 2.5 m
M
glucose
6-phosphate and 2 lgÆmL
)1
glucose 6-phosphate dehydro-
genase. Steady-state kinetic parameters for the diaphorase
activities and for the cytochrome c reductase activity with
mycobacterial ferredoxin were determined by varying the
concentrations of the substrates. Double-reciprocal plots of
the data yielded parallel lines. Initial rate data (v)werefitted
by nonlinear regression using
GRAFIT
4.0 (Erythacus
Software Ltd, Staines, UK) to a ping-pong Bi-Bi mechan-
ism equation (Eqn 1):
v ¼ V Â A Â B=ðK
a
 B þ K
b
 A þ A  BÞð1Þ
where A and B,andK
a
and K
b
are the molar concentrations
and the Michaelis constants for the two substrates, respect-
ively.
Enzyme titrations and photoreductions
Titrations of oxidized FprA with NADP
+
,NAD
+
,or
spinach Fd I were performed spectrophotometrically at
15 °C. The enzyme was diluted to a final concentration of
12–15 l
M
in 10 m
M
Tris/HCl, pH 7.7. NADP
+
titrations
were carried out at different ionic strength by varying the
NaCl concentration between 0 and 150 m
M
.Difference
spectra were computed by subtracting from each spectrum
that obtained in the absence of ligand, after correction for
dilution. K
d
values were obtained by fitting data sets by
nonlinear regression to the theoretical Eqn (2) for a 1 : 1
binding, using the software
GRAFIT
4.0 (Erythacus Software
Ltd, Staines, UK).
DA
¼ De Â
L þ P þ K
d
À
ffiffiffiffiffiffiffiffiffiffiffiffiffiffiffiffiffiffiffiffiffiffiffiffiffiffiffiffiffiffiffiffiffiffiffiffiffiffiffiffiffiffiffiffiffiffiffiffiffiffiffiffiffiffiffiffi
L þ P þ K
d
ðÞ
2
À 4 Â L Â P
q
2
ð2Þ
DA is the value of the difference spectrum at a selected
wavelength; De is the difference extinction coefficient at that
wavelength of the protein-ligand complex; L is the total
molar concentration of added ligand; P is the total molar
concentration of FprA.
All reduction experiments were carried out in anaerobic
cuvettes at 15 °C. Solutions were made anaerobic by
successive cycles of equilibration with O
2
-free nitrogen
and evacuation. Reductive titrations with Na-dithionite,
NADPH, or NADH were carried out using 15–50 l
M
FprA
solutions in 10 m
M
Tris/HCl, at pH 7.4. Photoreductions of
FprA using EDTA/light [15] were performed in 10 m
M
Hepes/KOH, at pH 7.0, containing 15 m
M
EDTA and
1.8 l
M
5-deazariboflavin. NADP
+
titration of reduced
enzyme was carried out by additions of an anaerobic
solution of NADP
+
to FprA previously photoreduced as
described above. The amount of FAD SQ was calculated by
subtraction of the contribution of the CT species [16,17]
from the absorbance at 625 nm according to Eqn (3):
A
sq
¼ A
625
Àð2:79 Â A
750
Þð3Þ
The contribution of CT species to A
625
can be estimated
taking into account that SQ does not absorb at 750 nm [18]
and that a A
625
/A
750
value of 2.79 for CT species could be
determined from experiments in which no SQ was formed.
RESULTS
Identification of fprA and fprB
The search of M. tuberculosis genome [1] for enzymes
potentially involved in iron metabolism led to the identifi-
cation of two genes, fprA and fprB, whose predicted protein
products are related to each other. They share a domain
with significant similarity (% 40% identity) with mamma-
lian AdR (Table 1). FprB contains a C-terminal domain
homologous to FprA (42% identity) plus an N-terminal
moiety comprising an iron-sulfur binding region signature
typical of bacterial 7Fe ferredoxins. It is remarkable that
AdR homologs are present in very few bacteria, whereas
two such proteins are found in mycobacteria (Table 1). To
our knowledge, the fusion protein does not have a counter-
part in other organisms, except for other mycobacteria.
Production of FprA
We tried to heterologously express both cloned genes, yet we
were only successful in obtaining FprA in a soluble active
form. In a preliminary series of experiments, E.coli
BL21(DE3) strain harboring pETfprA was grown at
37 °C. Upon induction, a novel protein band of 50-kDa
was clearly visible in SDS/PAGE, but most of the protein
was present in insoluble form. Growth and induction
conditions were varied to optimize the production of the
recombinant protein in a soluble form (not shown). The
amount of the soluble recombinant protein increased greatly
by lowering the growth temperature. Concomitantly, the
NADPH-ferricyanide reductase specific activity of the
soluble cell extracts also increased, being highest in cells
grown at 15 °C and harvested about 16 h after induction.
The purification of FprA was achieved by a three-step
procedure as described in Materials and methods. An
ammonium sulphate fractionation coupled to a salt-pro-
moted adsorption chromatography on Sepharose 4B, and
followed by an anion-exchange chromatography on
Table 1. Sequence comparison matrix stating percentage of identical
residues of bacterial and selected eukaryotic adrenodoxin reductase-like
proteins. Proteins with sequence identity lower than 20% were omitted.
Individual proteins are: A, FprA (M. tuberculosis); B, FprA (M. lep-
rae); C, FprB C-terminal domain (M. tuberculosis); D, FprB C-term-
inal domain (M. leprae); E, probable ferredoxin reductase
(Deinococcus radiodurans); F, putative ferredoxin reductase (Strepto-
myces coelicolor); G, Arh1p (Saccharomyces cerevisiae); H, bovine
adrenodoxin reductase.
ABCDEFGH
A 100 82 42 41 48 41 30 41
B 100 42 41 46 38 30 40
C 100 76 41 36 28 40
D 100 42 36 28 36
E 100 44 30 42
F 100 28 34
G 100 33
H 100
Ó FEBS 2002 M. tuberculosis NADPH-ferredoxin reductase (Eur. J. Biochem. 269) 3007
Q-Sepharose, yielded about 2 mg of FprA per gram of cells,
with an overall yield of 25% and a purification factor of 18.
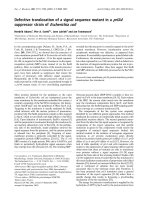
SDS/PAGE of the various fractions of the purification is
showninFig.1.
FprA is a flavoprotein
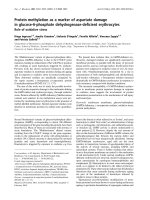
The visible absorption spectrum of the purified protein is
presented in Fig. 2. The absorbance in the visible region is
that typical of a flavoprotein with bands centered at 381 and
452 nm and shoulders at 422 and 473 nm. Maximal
absorbance in the ultraviolet region was at 272 nm. A value
of 7.0 for the A
272
/A
452
ratio was calculated from the
spectrum. Flavin fluorescence was almost completely
quenched. The non covalently bound flavin in FprA was
shown to be FAD. The flavin fluorescence of the released
cofactor increased about 10-fold after phosphodiesterase
treatment, as expected for the conversion from FAD to
FMN. The extinction coefficient of the enzyme at 452 nm
was calculated to be 10 600
M
)1
Æcm
)1
from the amount of
FAD released after protein denaturation by SDS. A
stoichiometry of 0.98 mol FAD per mol of 50 kDa
monomer was established. The flavin was reducible by
dithionite (Fig. 2) and an anaerobic titration of FprA with
this reductant showed that 0.92 molÆmol FAD
)1
or about
two electrons per flavin were required for full reduction (see
inset of Fig. 2). This excludes the presence of additional
redox cofactors in the enzyme. No changes in absorbance
beyond 550 nm were observed, indicating that the flavin
semiquinone (SQ) did not accumulate [18]. Thus, only two
forms of the FAD prosthetic group were present during
titration, the oxidized form and the fully reduced one, as can
be deduced from the presence of an isosbestic point at
340 nm. The same pattern of reduction was obtained by
photoreduction [15]. FprA was rapidly reduced by succes-
sive periods of irradiation in the presence of 5-deazaribo-
flavin and EDTA, yielding the hydroquinone spectrum after
8 min of light exposure (data not shown). Reoxidation of
fully reduced enzyme by molecular oxygen occurred without
any detectable SQ formation. Thus, the one-electron
reduced form of FAD is not stabilized in the enzyme.
Molecular properties
FprA showed a M
r
of about 50 000 in denaturing PAGE
(Fig. 1). This value is in good agreement with that of 49 341
calculated from the sequence. The identity of the overpro-
duced protein was assessed by N-terminal analysis. The first
21 amino-acid residues of the purified protein were identical
to those deduced from the gene sequence: MRPYYIAIVG
SGPSAFFAAAS. The M
r
of the recombinant FprA in
solution was determined in several conditions. Gel filtration
experiments in FPLC, either on Superose 12 or Superdex
75, allowed the determination of a value of 53 ± 5 kDa,
when the protein was maintained in 10% glycerol and 1 m
M
dithiothreitol, indicating that under these conditions the
protein is a monomer. The addition of glycerol and
2-mercaptoethanol were required to avoid formation of
aggregates.
Catalytic properties
The ferric reductase activity of the purified protein was
investigated by using Fe
3+
-EDTA in the presence of the
Fe
2+
-chelator ferrozine [14]. The activity was very low both
in the presence and absence of oxygen and/or FAD:
0.5–1 (mol NADPH)Æmin
)1
Æ(mol FAD)
)1
.Furthermore,
addition of 1 l
M
7Fe ferredoxin from M. smegmatis (see
Fig. 1. Purification of recombinant FprA as analysed by SDS/PAGE.
Lanes 1 and 5, molecular mass markers (values in kDa are indicated);
lane 2, crude extract; lane 3, after Sepharose 4B; lane 4, after
Q-Sepharose.
Fig. 2. Electronic absorption spectrum of purified FprA and dithionite
titration. Theenzymewas26l
M
in 10 m
M
Tris/HCl, pH 7.4, con-
taining 10% glycerol and 1 m
M
dithiothreitol. FprA was stepwise
reduced with dithionite under anaerobiosis. The spectra recorded at 0,
0.2, 0.4, 0.5, 0.7, 0.9, and 1 reductant/FAD molar ratios are reported.
The inset shows the plot of the fractional absorbance change at 452 nm
as a function of dithionite/FAD molar ratio. A
i
and A
f
are the initial
and final values of absorbance at 452 nm, respectively.
3008 F. Fischer et al. (Eur. J. Biochem. 269) Ó FEBS 2002
below) to the assay did not increase the iron reduction rate.
On the other hand, the protein was found able to catalyze
electron transfer from NADPH as well as NADH to
artificial electron acceptors like ferricyanide and DPIP. The
steady-state kinetic parameters for the ferricyanide and
DPIP activities were determined at pH 8.2 (Table 2). The
double-reciprocal plots of initial velocities obtained by
varying the reduced pyridine nucleotide at various fixed
levels of the artificial dye showed a pattern of parallel lines.
Data were fitted to Eqn (1). For the K
3
Fe(CN)
6
reductase
activity, the experiments revealed that ferricyanide concen-
trations above 1 m
M
were inhibitory. A 100- to 150-fold
lower K
m
values for NADPH with respect to NADH were
observed in the diaphorase reactions, whereas similar values
of k
cat
were obtained with both coenzymes, thus the
specificity constant ratio NADPH/NADH was 225 in the
ferricyanide reaction and 116 in the DPIP one. The catalytic
efficiencies of FprA with respect to the acceptors differed by
10-fold with preference for the one-electron reducible
substrate, i.e. ferricyanide. To study the interaction with
pyridine nucleotides in details, FprA was titrated with both
NADP
+
and NAD
+
. In both cases, the visible spectrum of
the enzyme was perturbed. The difference spectra elicited by
the ligand binding are shown in Fig. 3A. The features of the
difference spectra produced by NADP
+
or NAD
+
are very
similar, but the intensity of the 500 nm peak was fourfold
higher in the case of NADP
+
(Fig. 3A). Titrations with this
coenzyme were performed at increasing ionic strength to
obtain an accurate estimate of the K
d
by extrapolation of the
linear part in the graph of log K
d
vs. ÖI. Thus, K
d
values of
FprA for NADP
+
of 6 n
M
at I ¼ 0, and 0.4 l
M
at
I ¼ 50 m
M
were calculated (data not shown). In contrast,
the K
d
value for NAD
+
was in the millimolar range.
Identification of a physiological electron acceptor
The physiological activity of the mammalian homolog of
FprA is to reduce the [2Fe)2S] iron–sulfur protein Adx
[9,19,20]. Nevertheless, there are no genes coding for
[2Fe)2S] ferredoxins in the M. tuberculosis genome [1]. At
first, we studied the interaction of the recombinant enzyme
with the bovine Adx and with another [2Fe)2S]protein,the
spinach leaf Fd I. Cytochrome c was used as final electron
acceptor in these reactions. Its reduction was observed only
when either Adx or Fd I was added in the assay, indicating
that FprA was able to interact productively with both these
electron carrier proteins. FprA was 10-fold more active with
the plant type Fd I than with Adx under the same
conditions. In the mean time, we cloned M. tuberculosis
genes coding for 7Fe and 3Fe ferredoxins, but failed in
obtaining the overexpression in E.coli. Several years ago, a
7Fe ferredoxin was purified from M. smegmatis [11]. By
using a similar procedure, we obtained a reasonable amount
of the M. smegmatis 7Fe ferredoxin in homogeneous form
as judged by several criteria (native and denaturing PAGE,
protein determination/molarity determined by using the
reported extinction coefficient at 406 nm). N-Terminal
analysis of the purified protein confirmed its identity with
Fig. 3. Spectral perturbations elicited by ligand binding to FprA. All
measurements were performed in 10 m
M
Tris/HCl, pH 7.7 with 15 l
M
enzyme. Difference spectra were computed by subtracting from spectra
recorded at titration end-points those of unbound FprA and ligand.
(A) difference spectra of the complexes between FprA and NADP
+
(solid line) or NAD
+
(dashed line). (B) difference spectrum of the
complex between FprA and Fd I.
Table 2. Kinetic parameters for the ferricyanide and DPIP reductase reactions of FprA.
Electron
acceptor k
cat
(e
–
Æs
)1
)
K
NADðPÞH
m
(l
M
)
k
cat
/K
m
(e
–
Æs
)1
Æl
M
)1
)
K
acceptor
m
(lM)
k
cat
/K
m
(e
–
Æs
)1
Æl
M
)1
)
NADPH
K
3
Fe(CN)
6
63.0 ± 1.3 0.45 ± 0.02 140 ± 0.1 22 ± 2 2.9 ± 0.1
DPIP 25.6 ± 0.8 0.89 ± 0.08 29 ± 0.1 58 ± 3.8 0.44 ± 0.07
NADH
K
3
Fe(CN)
6
42 ± 0.9 68 ± 4 0.62 ± 0.06 14.6 ± 1 2.87 ± 0.07
DPIP 21 ± 0.6 83 ± 5 0.25 ± 0.07 56 ± 3 0.37 ± 0.06
Ó FEBS 2002 M. tuberculosis NADPH-ferredoxin reductase (Eur. J. Biochem. 269) 3009
the ferredoxin isolated by Imai et al. [11]. This ferredoxin
has 88% identity with FdxC of M. tuberculosis [1]. The
steady-state kinetic parameters for both the 2Fe and 7Fe
ferredoxin reductase activities are reported in Table 3. The
kinetic data obtained with the protein substrates yielded
parallel lines in double-reciprocal plots and were fitted to
Eqn (1). The k
cat
measured with the 7Fe ferredoxin was
30% of that with the spinach protein, whereas the K
m
for
the homologous protein substrate was about 30-fold lower,
suggesting a much higher affinity of FprA for the
mycobacterial ferredoxin. Due to the ability to reduce
iron-sulfur proteins using preferentially the pyridine nuc-
leotide phosphate, the systematic name for FprA is thus
NADPH-ferredoxin oxidoreductase or NFR. Although
Fd I is not the physiological substrate of the bacterial
reductase, a titration of FprA with Fd I was attempted to
demonstrate that an interaction between the two proteins
was indeed occurring thus supporting the activity data.
Figure 3B shows the difference spectrum obtained at
saturating concentration of Fd I. Two positive peaks
appeared centered around 450 and 380 nm, where FprA
has absorption maxima. An approximate K
d
value of 2 l
M
was obtained by titration. The interaction between the two
proteins was further investigated by using cross-linking
agents. Following incubation of the two proteins with
N-ethyl-3-(3-dimethylaminopropyl)carbodiimide, FprA was
fully converted to protein adducts of about 66 kDa as
determined by SDS/PAGE. This is the expected value
for a 1 : 1 cross-linked complex between the flavopro-
tein and Fd I [12]. The cross-linked species acquired the
capacity to reduce directly cytochrome c as judged by
measuring the cytochrome c reductase activity in the
absence of added Fd I. The same type of experiments were
repeated replacing the spinach protein with the 7Fe
ferredoxin. A cross-linked protein of about 66 kDa was
also obtained, although at a lower rate of formation with
respect to the plant ferredoxin.
Anaerobic reduction of FprA with NAD(P)H
Bovine AdR shows peculiar behavior when anaerobically
reduced by NADPH [21]. We therefore tried to verify
whether FprA presented the same reduction pattern when
treated with physiological reductants. Identification of
reduced intermediates could help in elucidating the mech-
anism of action of FprA. The titration of FprA with the less
efficient substrate NADH practically superimposed to that
with dithionite (Fig. 2). About 1 (mol NADH)Æ(mol
FAD)
)1
was sufficient to fully reduce the enzyme, again
without significant changes at wavelengths longer than
550 nm (data not shown). The full reduction of the enzyme
FAD by just an equimolar amount of NADH implies that
the enzyme redox potential is far more positive than that of
the pyridine nucleotide couple. A completely different
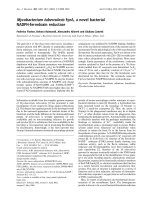
pattern was observed when FprA was titrated with
NADPH (Fig. 4A). Clearly, upon reduction with substoi-
chiometric amounts of the reduced coenzyme, absorption in
the 500–800 nm region built up with a broad peak at
550 nm. These spectral changes are usually ascribed to
formation of charge-transfer (CT) species (FAD-NADPH
and/or FADH
2
-NADP
+
) [16,17]. Only two species are
present during titration, as indicated by the presence of two
isosbestic points (373 and 490 nm, respectively). After
addition of more than 1 mol NADPH per mol FAD
(Fig. 4B), the spectra in the long wavelength region
changed. A peak at 580 nm with a shoulder at 625 nm
developed. This type of spectrum (peaks in the 600 nm
region with no absorption beyond 700 nm) can be attrib-
uted to the flavin neutral SQ [18]. In an attempt to further
characterize the various species formed during NADPH
titration of FprA, a titration with NADP
+
of the fully
Fig. 4. NADPH reduction of FprA. The titration was performed in
10 m
M
Tris/HCl, pH 7.4 under anaerobiosis. 47 l
M
FprA was titrated
with NADPH. The spectra recorded at 0, 0.3, 0.45, 0.6, 0.7, 0.9, 1 (A)
and at 1.3, 1.6, 1.9, 3, 6 (B) NADPH/FAD molar ratios are reported.
The inset shows the plot of the absorbance at 625 nm due to SQ,
obtained by subtracting the contribution of charge-transfer species as
detailed in Materials and methods, as a function of NADPH/FAD
molar ratio.
Table 3. Kinetic parameters for the 2Fe and 7Fe ferredoxin reductase reactions of FprA.
Electron acceptor
k
cat
(e
–
Æs
)1
)
K
NADPH
m
(l
M
)
k
cat
/K
m
(e
–
Æs
)1
Æl
M
)1
)
K
acceptor
m
(l
M
)
k
cat
/K
m
(e
–
Æs
)1
Æl
M
)1
)
S. oleracea Fd I 11 ± 0.20 2.6 ± 0.12 4.2 ± 0.27 0.86 ± 0.04 13 ± 0.63
M. smegmatis
ferredoxin
3.4 ± 0.27 3.5 ± 0.72 0.97 ± 0.21 0.03 ± 0.004 110 ± 17
3010 F. Fischer et al. (Eur. J. Biochem. 269) Ó FEBS 2002
reduced enzyme obtained by photoreduction was performed
(Fig. 5A). The spectra resemble those already observed
during the early steps of NADPH titration of oxidized
enzyme (Fig. 4A). It can be noted that both the absorbance
at 450 and 340 nm of the solution increased at each addition
of NADP
+
up to 1 NADP
+
per FAD (see inset) and no SQ
was formed. Thus, the spectrum of the CT formed in this
experiment, which is superimposable to that formed in the
titration of the oxidized enzyme with a molar amount of
NADPH, is mostly due to FAD-NADPH charge transfer,
as can be judged from the high absorbance at 340 and
450 nm, and low absorbance at 750 nm. The SQ amount
present during NADPH titration could then be calculated
by subtracting from the spectra the contribution of the CT
species as obtained from the experiment shown in Fig. 5A.
In the inset of Fig. 4B, the absorption changes due to SQ
accumulation are plotted against the NADPH/flavin molar
ratio. It can be observed that the SQ built up only after one
NADPH/flavin was added, reached its maximum after
addition of slightly more than two NADPH/flavin, and
then remained at this level notwithstanding the high amount
of NADPH added. Indeed, full reduction of the bound
flavin to FAD dihydroquinone was not achieved even by
prolonged incubation or by using NADPH in the presence of
a NADPH regenerating system. This suggests that the SQ is
stabilized by complexation with NADPH. This is further
confirmed by photoreduction experiments carried out in the
presence of 1.5 (mol NADP
+
)Æ(mol FAD)
)1
(Fig. 5B).
Whereas photoreduction of uncomplexed FprA did not
elicite accumulation of reduced intermediates, in the presence
of NADP
+
the formation of a long wavelength band with a
peak at 550 nm (ascribable to CT species) in the early steps of
reduction was observed. With further irradiation, the
spectral features typical of the SQ appeared. This indicates
that the SQ accumulated only after NADPH was formed,
thus suggesting that this intermediate is a complex between
flavin SQ and NADPH. These data can be rationalized
according to the scheme presented below:
E
ox
þ NADPH $ CT
CT þ NADPH $ E
red
-NADPH þ NADP
þ
CT þ E
red
-NADPH $ 2E
sq
-NADPH
where CT indicate an equilibrium mixture of the two
charge-transfer species FAD-NADPH and FADH
2
-
NADP
+
.
DISCUSSION
The functional annotation of proteins identified in genome
sequencing projects is based on protein sequence similarities
to homologs in the databases. However, due to the
possibility of divergent evolution, homologous enzymes
may not catalyze the same reaction. Thus, a biochemical
characterization of the gene product is required to establish
the protein’s real function in that organism. This was
particularly necessary in the case of the fprA gene product of
M. tuberculosis, because of the absence in the bacterial
genome of genes coding for [2Fe)2S] ferredoxins, the
expected protein substrate for an adrenodoxin reductase-
like enzyme. To our knowledge, this is the first adrenodoxin
reductase-like protein from a bacterium to be characterized.
The recombinant enzyme was shown to be a flavoprotein
containing noncovalently bound FAD, whose fluorescence
was nearly fully quenched. This is a remarkable difference
from the mammalian enzyme, the flavin of which is
fluorescent [22,23]. The fprA gene product did not show
significant activity as ferric reductase as was at first
hypothesized. Instead, it possesses the activities typical of
the mammalian AdR [9,24], including the capacity to reduce
the mammalian Adx. However, FprA was more efficient
with plant Fd I and more interestingly, with a 7Fe
ferredoxin of M. smegmatis. This ferredoxin is a homolog
of M. tuberculosis FdxC (88% identity between the
sequences). The higher affinity of the reductase for the 7Fe
ferredoxin is in keeping with the absence of 2Fe ferredoxins
in mycobacteria. The elucidation of the three-dimensional
structure of the enzyme will provide more information on
the structural basis for the specificity in protein–protein
recognition. The enzyme can use both NADPH and NADH
as a reductant; however, the specificity constant (k
cat
/K
m
)of
NADPH is two orders of magnitude larger than that of
NADH. Furthermore, binding of NADP
+
to FprA is
extremely tight with K
d
values in the nanomolar region. The
affinity of FprA for NADP
+
is at least 10 times higher than
Fig. 5. Effect of NADP
+
addition after or before FprA photoreduction.
Photoreduction of FprA was performed in 10 m
M
Hepes-KOH,
pH 7.0, in the presence of 15 m
M
EDTA and 1.8 l
M
5-deazaribofla-
vin. (A) NADP
+
titration of 26.5 l
M
photoreduced FprA. The spectra
recorded at 0, 0.1, 0.3, 0.4, 0.5, 0.7, 0.8, 1 NADP
+
/FAD molar ratios
are reported. The inset shows the absorbance changes at 452 (s), 550
(d)and750nm(h) as a function of NADP
+
/FAD molar ratio. The
absorbance change at 750 nm has been multiplied by four for clarity.
(B) photoreduction of 20 l
M
FprA in the presence of 30 l
M
NADP
+
.
The spectra recorded before and after 1.5, 2.5, 3.5 min irradiation
(dashed line) and after 6, 10, 13, 17 min irradiation (solid lines) are
shown. The inset shows an enlargement of the spectral data in the 500–
750 nm region.
Ó FEBS 2002 M. tuberculosis NADPH-ferredoxin reductase (Eur. J. Biochem. 269) 3011
that of bovine AdR [9]. The tight binding of NADP(H) may
have physiological implications. Anaerobic titrations with
NADPH of FprA revealed a completely different pattern
from that obtained with dithionite, NADH or photoreduc-
tion. In the latter cases, only two forms of the enzyme, the
oxidized and the fully reduced ones, were observed. With
NADPH or NADP
+
present during reduction of FprA,
two additional forms were identified: CT species (FAD-
NADPH and FADH
2
-NADP
+
) and FAD semiquinone.
Unlike bovine AdR, FprA highly favored the CT species
FAD-NADPH, as judged by comparison of the spectra [21].
By analysis of the conditions in which the SQ accumulated,
it can be inferred that this intermediate results from
NADPH binding to the flavin SQ, as observed in the case
of bovine AdR [21]. This complex is assumed to be a
compulsory intermediate in the catalytic cycle of these
enzymes, whose functional role is to mediate electron
transfer between two-electron donors (NADPH) and one-
electron acceptors (iron-sulfur protein substrates) [9].
This enzyme must be of relevance to mycobacteria
because a homolog is present in M. leprae, whose genome is
greatly downsized and degraded [25]. On the basis of the
high similarity of FprA with mammalian AdR (Table 1), its
enzymatic function may be inferred. In mitochondria, AdR,
with a [2Fe)2S] ferredoxin, is part of an electron chain
which delivers electrons from NADPH to cytochrome P450
enzymes, mainly involved in hydroxylation reactions
[9,19,20]. The M. tuberculosis genome is rich in genes
encoding P450 cytochromes (22 genes, see [1]), whereas it
lacks genes coding for Adx-type ferredoxins and it contains
only genes encoding 7Fe and 3Fe ferredoxins [1]. In
bacteria, different systems for P450 cytochrome reduction
are employed. Well known is the system comprising
putidaredoxin reductase, a NADH-dependent flavoprotein,
and putidaredoxin (2Fe ferredoxin), which transfers elec-
trons to P450
cam
[26]. This system is similar to the
mammalian AdR-Adx. A microsomal-type P450 reductase
instead is present in Bacillus megaterium [27]. Apparently,
purification of the reductase from other bacteria was
unsuccessful due to protein instability and low expression
level. A microbial cytochrome P450 reduction system was
purified from Streptomyces griseus grown in a soybean
flour-enriched medium [28]. The ferredoxin reductase was
a NADH-dependent flavoprotein of 60 kDa with a
N-terminal sequence comprising a FAD binding consensus
sequence (GXGXXG), which is typical of the glutathione
reductase large family [29], to which AdR also belongs.
They showed that this enzyme can couple electron transfer
from NADH to cytochrome P450
soy
in the presence of
S. griseus 7Fe ferredoxin. The activity value measured in the
cytochrome c assay is in agreement to that obtained with
FprA and M. smegmatis ferredoxin. The low K
m
value of
FprA for this iron-sulfur protein strengthens the hypothesis
that a 7Fe ferredoxin could be the physiological partner of
the enzyme. Nevertheless, in herbicide-induced S. griseolus
cells [30], two small 3Fe ferredoxins were found highly
expressed, which could reconstitute an in vitro electron chain
to P450 cytochromes using spinach FNR. Recently, a
cytochrome P450 and a 3Fe ferredoxin were purified from
Mycobacterium sp. strain HE5, grown on morpholine [31].
In both these cases, it was hypothesized that the reductase is
constitutively formed and it has a broad specificity with
respect to the ferredoxin substrate.
Further roles for AdR have been discovered. The
AdR-Adx system of the lower eukaryote Saccharomyces
cerevisiae was shown to be essential for yeast viability by
gene knockout [32–34] and to be involved in the biosynthe-
sis of the cell iron-sulfur clusters [35–37]. Furthermore,
mammalian AdR has been recently identified to play a role
in the p53-dependent apoptosis, due to its potential to
produce reactive oxygen species (ROS) [38]. Accordingly, it
can be assumed that the mycobacterial FprA may have
similar functions in iron-sulfur cluster synthesis or oxidative
stress response. It is likely that FprA is primarily involved in
the reduction of P450 enzymes as is the case of the other
bacerial reductases cited above. Recently, the P450
14a-demethylase of M. tuberculosis has been characterized
and suggested to be involved in the cholesterol biosynthetic
pathway [39]. Cholesterol has been shown to be essential to
M. tuberculosis infection [40]. Furthermore, some of the
cytochrome P450 enzymes could be involved in the synthesis
of the complex cell wall components. Thus, if FprA
provides electrons to several pathways through the inter-
action with several ferredoxins, it represents a potential
target for antimycobacterial drugs. Crystals of FprA have
been obtained and the three-dimensional structure is being
currently determined.
ACKNOWLEDGEMENTS
This work was carried out with funds from the Ministero dell’Univer-
sita
`
e della Ricerca Scientifica e Tecnologica (Prin 1999) and European
Union (EU Cluster QLK2-2000–01761). We thank Dr G. Riccardi
(University of Genova), Dr R. Cantoni and Dr M. Branzoni
(University of Pavia) for help in cloning and DNA sequencing,
Dr A. Negri and Dr G. Tedeschi for protein microsequencing, and
Dr M. A. Vanoni and Dr B. Curti for helpful discussions.
REFERENCES
1. Cole, S.T., Brosch, R., Parkhill, J., Garnier, T., Churcher, C.,
Harris, D., Gordon, S.V., Eiglmeier, K., Gas, S., Barry III, C.E.
et al. (1998) Deciphering the biology of Mycobacterium tuber-
culosis from the complete genome sequence. Nature 393, 537–544.
2. McKinney, J.D. (2000) In vivo veritas: the search for TB drug
targets goes live. Nat. Med. 6, 1330–1333.
3. De Voss, J.J., Rutter, K., Schroeder, B.G. & Barry, C.E. III (1999)
Iron acquisition and metabolism by mycobacteria. J. Bacteriol.
181, 4443–4451.
4. Vidal, S.M., Malo, D., Vogan, K., Skamene, E. & Gros, P. (1993)
Natural resistance to infection with intracellular parasites: isola-
tion of a candidate for Bcg. Cell 73, 469–485.
5. Gunshin, H., Mackenzie, B., Berger, U.V., Gunshin, Y., Romero,
M.F., Boron, W.F., Nussberger, S., Gollan, J.L. & Hediger, M.A.
(1997) Cloning and characterization of a mammalian proton-
coupled metal-ion transporter. Nature 388, 482–488.
6. Brown, K.A. & Ratledge. C. (1975) Iron transport in Myco-
bacterium smegmatis:ferrimycobactin reductase (NAD(P)H:ferri-
mycobactin oxidoreductase), the enzyme releasing iron from its
carrier. FEBS Lett. 53, 262–266.
7. Fontecave, M., Coves, J. & Pierre, J.L. (1994) Ferric reductases or
flavin reductases? Biometals 7, 3–8.
8. Karplus, P.A. & Bruns, C.M. (1994) Structure–function relations
for ferredoxin reductase. J. Bioenerg. Biomembr. 26, 89–99.
9. Nonaka, Y., Miura, R. & Yamano, T. (1991) NADPH-adreno-
doxin oxidoreductase. In Chemistry and Biochemistry of Flavo-
enzymes,Vol.2(Mu
¨
ller, F., ed.), pp. 329–341. CRC Press, Boca
Raton, FL.
3012 F. Fischer et al. (Eur. J. Biochem. 269) Ó FEBS 2002
10. Piubelli, L., Aliverti, A., Bellintani, F. & Zanetti, G. (1995) Spi-
nach ferredoxin I: overproduction in Escherichia coli and puri-
fication. Prot.Exp.Purif.6, 298–304.
11.Imai,T.,Matsumoto,T.,Ohta,S.,Ohmori,D.,Suzuki,K.,
Tanaka, J., Tsukioka, M. & Tobari, J. (1983) Isolation and
characterization of a ferredoxin from Mycobacterium smegmatis
Takeo. Biochim. Biophys. Acta 743, 91–97.
12. Zanetti, G., Curti, B. & Aliverti, A. (1984) A cross-linked complex
between ferredoxin and ferredoxin-NADP
+
reductase. J. Biol.
Chem. 259, 6153–6157.
13. Aliverti, A., Curti, B. & Vanoni, M.A. (1999) Identifying and
quantitating FAD and FMN in simple and iron-sulfur-containing
flavoproteins. In Methods in Molecular Biology, Vol. 131 Flavo-
protein Protocols (Chapman, S.K. & Reid, G.A., eds), pp. 9–23.
Humana Press Inc., Totowa, NJ.
14. Coves, J. & Fontecave, M. (1993) Reduction and mobilization of
iron by a NAD(P)H: flavin oxidoreductase from Escherichia coli.
Eur.J.Biochem.211, 635–641.
15. Massey, V. & Hemmerich, P. (1977) A photochemical procedure
for reduction of oxidation-reduction proteins employing deazari-
boflavin as catalyst. J. Biol. Chem. 252, 5612–5614.
16. Massey, V. & Palmer, G. (1962) Charge-transfer complexes
of lipoyl dehydrogenase and free flavins. J. Biol. Chem. 237,
2347–2358.
17. Sakuray, T. & Hosoya, H. (1966) Charge-transfer complexes of
nicotinamide-adenine dinucleotide analogues and flavin mono-
nucleotide. Biochim. Biophys. Acta 112, 459–468.
18. Massey, V. & Hemmerich, P. (1980) Active-site probes of flavo-
proteins. Biochem. Soc. Trans. 8, 246–257.
19. Hanukoglu, I. (1992) Steroidogenic enzymes: structure, function,
androleinregulationofsteroidhormonebiosynthesis.J. Steroid
Biochem. Mol. Biol. 43, 779–804.
20. Bernhardt, R. (1996) Cytochrome P450: structure, function, and
generation of reactive oxygen species. Rev. Physiol. Biochem.
Pharmacol. 127, 137–221.
21. Nonaka, Y., Fujii, S. & Yamano, T. (1986) The semiquinone state
of NADPH-adrenodoxin oxidoreductase in the course of anae-
robic reduction with NADPH. J. Biochem. 99, 803–814.
22. Chu, J. & Kimura, T. (1973) Studies on adrenal steroid hydro-
xylases. Complex formation of the hydroxylase components.
J. Biol. Chem. 248, 2089–2094.
23. Foster, R.P. & Wilson, L.D. (1975) Purification and character-
ization of adrenodoxin reductase from bovine adrenal cortex.
Biochemistry 14, 1477–1484.
24. Lambeth, J.D. & Kamin, H. (1976) Adrenodoxin reductase.
Properties of the complexes of reduced enzyme with NADP
+
and
NADPH. J. Biol. Chem. 251, 4299–4306.
25. Cole, S.T., Eiglmeier, K., Parkhill, J., James, K.D., Thomson,
N.R.,Wheeler,P.R.,Honore
´
, N., Garnier, T., Churcher, C.,
Harris, D. et al. (2001) Massive gene decay in the leprosy bacillus.
Nature 409, 1007–1011.
26. Peterson, J.A., Lorence, M.C. & Amarneh, B. (1990) Putidar-
edoxin reductase and putidaredoxin. Cloning, sequence determi-
nation, and heterologous expression of the proteins. J. Biol. Chem.
265, 6066–6073.
27. Narhi, L.O. & Fulco, A.J. (1986) Characterization of a catalyti-
cally self-sufficient 119,000-dalton cytochrome P-450 mono-
oxygenase induced by barbiturates in Bacillus megaterium. J. Biol.
Chem. 261, 7160–7169.
28. Ramachandra, M., Seetharam, R., Emptage, M.H. & Sariaslani,
F.S. (1991) Purification and characterization of a soybean flour-
inducible ferredoxin reductase of Streptomyces griseus. J. Bacteriol.
173, 7106–7112.
29. Dym, O. & Eisenberg, D. (2001) Sequence-structure analysis of
FAD-containing proteins. Protein Sci. 10, 1712–1728.
30. O’Keefe, D.P., Gibson, K.J., Emptage, M.H., Lenstra, R.,
Romesser,J.A.,Litle,P.J.&Omer,C.A.(1991)Ferredoxinsfrom
two sulfonylurea herbicide monooxygenase systems in Strepto-
myces griseolus. Biochemistry 30, 447–455.
31. Sielaff,B.,Andreesen,J.R.&Schra
¨
der, T. (2001) A cytochrome
P450 and a ferredoxin isolated from Mycobacterium sp. strain
HE5 after growth on morpholine. Appl. Microbiol. Biotechnol. 56,
458–564.
32. Manzella, L., Barros, M.H. & Nobrega, F.G. (1998) ARH1 of
Saccharomyces cerevisiae: a new essential gene that codes for a
protein homologous to the human adrenodoxin reductase. Yeast
14, 839–846.
33. Barros, M.H. & Nobrega, F.G. (1999) YAH1 of Saccharomyces
cerevisiae: a new essential gene that codes for a protein homo-
logous to human adrenodoxin. Gene 233, 197–203.
34. Lacour, T., Achstetter, T. & Dumas, B. (1998) Characterization of
recombinant adrenodoxin reductase homologue (Arh1p) from
yeast. Implications in in vitro cytochrome P45011b monooxyge-
nase system. J. Biol. Chem. 273, 23984–23992.
35. Lange, H., Kaut, A., Kispal, G. & and Lill, R. (2000) A
mitochondrial ferredoxin is essential for biogenesis of cellular iron-
sulfur proteins. Proc. Natl Acad. Sci. USA 97, 1050–1055.
36. Lill, R. & Kispal, G. (2000) Maturation of cellular Fe-S proteins:
an essential function of mitochondria. Trends Biochem. Sci. 25,
352–356.
37. Mu
¨
hlenhoff, U. & Lill, R. (2000) Biogenesis of iron-sulfur proteins
in eukaryotes: a novel task of mitochondria that is inherited from
bacteria. Biochim. Biophys. Acta 1459, 370–382.
38. Hwang, P.M. & Bunz, F., YuJ., Rago, C., Chan, T.A., Murphy,
M.P., Kelso, G.F., Smith, R.A., Kinzler, K.W. & Vogelstein, B.
(2001) Ferredoxin reductase affects p53-dependent, 5-fluoro-
uracil-induced apoptosis in colorectal cancer cells. Nat. Med. 7,
1111–1117.
39. Bellamine, A., Mangla, A.T., Dennis, A.L., Nes, W.D. &
Waterman, M.R. (2001) Structural requirements for sub-
strate recognition of Mycobacterium tuberculosis 14a-demethy-
lase: implications for sterol biosynthesis. J. Lipid Res. 42,
128–136.
40. Gatfield, J. & Pieters, J. (2000) Essential role for cholesterol
in entry of mycobacteria into macrophages. Science 288,
1647–1650.
Ó FEBS 2002 M. tuberculosis NADPH-ferredoxin reductase (Eur. J. Biochem. 269) 3013