A finite difference scheme for the modeling of a direct methanol fuel cell
Bạn đang xem bản rút gọn của tài liệu. Xem và tải ngay bản đầy đủ của tài liệu tại đây (315.73 KB, 8 trang )
International Journal of Advanced Engineering
Research and Science (IJAERS)
Peer-Reviewed Journal
ISSN: 2349-6495(P) | 2456-1908(O)
Vol-9, Issue-8; Aug, 2022
Journal Home Page Available: />Article DOI: />
A Finite Difference Scheme for the Modeling of a Direct
Methanol Fuel Cell
Hoc-Tran Nguyen1,2, Tuan-Anh Nguyen1,2*, Van Thi Thanh Ho3
1Vietnam
2Faculty
National University – Ho Chi Minh City, VNU – HCM, Linh Trung Ward, Thu Duc, Ho Chi Minh City, Vietnam,
of Chemical Engineering, Ho Chi Minh City University of Technology, District 10, Ho Chi Minh City, Vietnam
3Department
of R&D and External Relations, Ho Chi Minh City University of Natural Resources and Environment-HCMUNRE, District
10, Ho Chi Minh City, Vietnam
email:
Received: 16 Jul 2022,
Abstract— A one dimensional (1-D), isothermal model for a direct methanol
Received in revised form: 05 Aug 2022,
fuel cell (DMFC) is introduced and solved numerically by a simple finite
Accepted: 10 Aug 2022,
difference scheme. By using numerical calculation, the model model can be
Available online: 19 Aug 2022
extended to more complicated situation which can not be solved analytically.
©2022 The Author(s). Published by AI
The model considers the kinetics of the multi-step methanol oxidation
Publication. This is an open access article under
reaction at the anode. Diffusion and crossover of methanol are taken into
the CC BY license
account and the reduced potential of the cell due to the crossover is then
( />
estimated. The calculated results are compared to the experimental data
Keywords—
direct
from literature. This finite difference scheme can be rapidly solved with high
methanol fuel cell, finite difference scheme,
accuracy and it is suitable for the extension of the model to more detail or to
methanol cross over.
higher dimension.
Numerical
I.
modeling,
INTRODUCTION
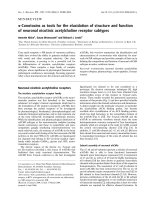
The crossover of methanol lessen the system
Direct Methanol Fuel Cells (DMFCs) are recently
efficiency and decreases cell potential due to corrosion at
being attracted as an alternative power source to batteries
the cathode. The electrochemistry and transport processes
for portable applications since they potentially provide
in DMFCs are shown in Fig.1. Methanol is oxidized
better energy densities. However, there are two key
electrochemically at both the anode and cathode, however
constraints limiting the effectiveness of DMFC systems:
the corrosion current at the cathode does not create any
crossover of methanol from anode to cathode and the
useful work. A number of experimental and computational
sluggish kinetics of the electrochemical oxidation of
investigations have reported methanol crossover in
methanol at the anode.
DMFCs [1-4].
www.ijaers.com
Page | 300
Nguyen et al.
International Journal of Advanced Engineering Research and Science, 9(8)-2022
methanol fuel cell
The model which was developed in [5] is used in this study.
The details are briefly discussed as follows.
Assumptions. The model considers the 1D variation of
methanol concentration across the fuel cell which includes
anode backing layer (ABL), anode catalyst layer (ACL),
and membrane. The schematic diagram of the layers
considered in the model and several assumption illustration
were presented in . The assumptions are detailed as
follows
1) Steady-state and isothermal operation.
2) Variables are lumped along the flow direction
3) Convection of methanol is neglected.
4) Isothermal conditions.
5) All physical properties, anodic and cathodic
overpotentials are considered constant.
6) Local equilibrium at interfaces between layers can
be described by a partition function.
7) All the reaction are considered as homogeneous
reactions.
.
Fig.1 Schematic illustration of a DMFC.
There are several models have developed to predict
the behaviour of direct methanol fuel cells, which is
important in the design, operation and control. Among
them, 1D model show the advantage of simple and fast
calculation, which is suitable for real time simulation.
García et al. [5] presented a one dimensional, isothermal
model of a DMFC to rapidly predict the polarization curve
and goes insight into mass transfer happening inside the
cell. The model was solved analytically. However,
analytical methods have some drawbacks such as the
limitation to some specific cases and difficulty to extend to
Fig.2 Schematic diagram and concentration distribution of
more complicated situation. Therefore, in this current study,
the DMFC layers
instead of using analytical method, the model is solved
numerically using a simple finite difference scheme.
One-dimension
www.ijaers.com
mathematical
modeling
of
The voltage of the cell is calculated as
direct
Page | 301
Nguyen et al.
International Journal of Advanced Engineering Research and Science, 9(8)-2022
Vcell = U O − U MeOH − C − A −
2
M I Cell
(1)
(5)
In which the molar rate of methanol consumption
rMeOH
M MeOH
in which,
U O2 and UMeOH are the thermodynamic
is calculated from the volumetric current density
j as:
equilibrium potential of oxygen reduction and methanol
rMeOH
−j
=
M MeOH 6 F
oxidation respectively
ηC and ηA are the cathode and anode
overpotentials, respectively
M I Cell
(6)
represents the ohmic drop across the
The current density is related to the concentration of
methanol as ([6])
membrane.
j = aI 0,MeOH
ref
Anode backing layer - ABL (domain B)
In this domain, the differential mass balance for methanol at
A
kcMeOH
e F / RT
F / RT
A
cMeOH + e
A
A
A
A
steady state is
(7)
B
dN MeOH
,z
dz
=0
In which a is the specific surface area of the anode,
is the exchange current density, and k and λ are constants
The methanol flux is the Fickian diffusion with an effective
(2)
The methanol flux is the Fickian diffusion with an effective
diffusivity DA
diffusivity DB
N
B
MeOH , z
= − DB
I 0,MeOH
ref
N
B
dcMeOH
,z
A
MeOH , z
= − DA
A
dcMeOH
,z
dz
(8)
(3)
Combining Eq. (5), Eq. (6) and Eq. (8), the distribution
Combining Eq. (2) and Eq. (3), the distribution equation for
equation for methanol in ACL is
methanol in ABL is
2 B
MeOH , z
2
d c
dz
dz
DA
=0
A
d 2cMeOH
,z
dz
2
=
j
6F
(9)
(4)
Anode Catalyst Layer - ACL (domain A)
Membrane (domain M)
In this domain, there is a methanol oxidation reaction.
The differential mass balance for methanol at steady state in
Therefore, the differential mass balance for methanol at
the membrane is
steady state is
A
dN MeOH
,z
dz
www.ijaers.com
M
dN MeOH
,z
=
rMeOH
M MeOH
dz
=0
Page | 302
Nguyen et al.
International Journal of Advanced Engineering Research and Science, 9(8)-2022
(10)
concentrations between two domains is given by a partition
The methanol flux in the membrane includes the diffusion
coefficient KII as
and electro-osmotic drag as follows:
M
N MeOH
, z = − DM
M
cMeOH
, z =
M
MeOH , z
dc
dz
+ MeOH
I Cell
F
(11)
B
A
= K II cMeOH
, z =
+ A
B
+ A
(16)
Second condition is the equality of fluxes between two
domains (ACL and membrane) as
In which DM and ξMeOH are the effective diffusion in
A
N MeOH
, z =
membrane and the electro-osmotic drag coefficients of
B
+ A
M
= N MeOH
, z =
methanol, respectively.
B
+ A
(17)
Combining Eq. (10) and Eq. (11), the distribution equation
At z= δB+ δA + δM : All the methanol crossing the membrane
for methanol in membrane is
is assumed to consume immediately at the cathode, result in
DM
M
d 2cMeOH
,z
dz 2
a zero concentration at the membrane/ cathode-layer
=0
interface. Thus,
M
cMeOH
, z =
(12)
B
Boundary condition:
+ A + M
=0
(18)
At z=0 (the interface between the flow-channel and anode
Finite difference scheme and overpotential calculation
backing layer), there is no mass resistance. Therefore, the
The spatial independent variable z in the three segments (0,
concentration is given by the bulk concentration of the flow
δB), (δB, δB + δA), (δB+ δA, δB+ δA + δM) can be discretized
as:
into nB, nA, nM subdivisions, respectively, as
0 = z1B z2B .. znBB = B
B
cMeOH
, z = 0 = cbulk
(13)
(19)
At z= δB (the interface between ABL and ACL), there are
B = z1A z2A .. znA = B + A
two conditions. First, the local equilirium of the
A
concentrations between two domains is given by a partition
coefficient KI as
(20)
B + A = z1M z2M .. znM = B + A + M
A
A
B
cMeOH
, z = B = K I cMeOH , z = B
(14)
(21)
In each segment, note that the length of subsegment is
Second condition is the equality of fluxes between two
equal to ΔzB, ΔzA, ΔzM, respectively.
domains (ABL and ACL)
Governing equations
B
A
N MeOH
, z = = N MeOH , z =
B
Inside the domains (ABL, ACL and membrane), the
B
(15)
second derivatives in the governing equations are
discretized using central difference formulae. The details
At z= δB + δA (the interface between ACL and membrane),
are as follows
there are two conditions. First, the local equilirium of the
In ABL region, equation (4) is discretized as:
www.ijaers.com
Page | 303
Nguyen et al.
DB
International Journal of Advanced Engineering Research and Science, 9(8)-2022
B
B
B
cMeOH
, z +z − 2cMeOH , z + cMeOH , z −z
( zB )
2
dcMeOH , z
=0
dz
dcMeOH , z
dz
B
B
B
cMeOH
,i +1 − 2cMeOH ,i + cMeOH ,i −1 = 0
In ACL region, equation (4) is discretized as:
=
=
2
kc
F / RT
F / RT e
+ e
A
A
A
A
(29)
concentration of methanol is obtained. The system is
solved using simple iteration method to find the
Anode overpotential
From the concentration profile, the cell current can be
estimated as:
6F
(24)
I cell =
Or
DA
aI 0,MeOH
ref
=
A
A
A
numerically calculated using trapezoidal rule. Because ηA
is also included in calculation of concentration profile, an
of ICell.
Cathode overpotential
In membrane region, equation (12) is discretized as :
M
M
M
cMeOH
, z +z − 2cMeOH , z + cMeOH , z −z
( zM )
2
Tafel kinetics with first-order oxygen concentration
=0
dependence is used to estimate the oxygen reduction at the
cathode.
(26)
I cell + I leak = I 0,O2ref
Or
M
MeOH ,i +1
c
− 2c
M
MeOH ,i
+c
M
MeOH ,i −1
=0
(27)
first
derivatives
cO2 ,ref
eCC F / RT
(31)
oxidation of methanol crossing the membrane. The leakage
in
boundary
conditions
are
approximated using forward difference formulae as
follows:
At the left interface, using the forward scheme:
www.ijaers.com
cO2
In which Ileak is the leakage current density due to the
Boundary conditions
The
A
A
iteration is required to find appropriate ηA for a given value
6F
(25)
DM
A
A
(30)
kc
F / RT
F / RT e
+ e
A
A
kcMeOH
e F / RT
F / RT
A
cMeOH + e
In which ηA is assumed to be constant. The integration is
A
MeOH ,i
c
aI 0,MeOH
ref
=
2
A
MeOH ,i
B + A
B
A
A
A
cMeOH
,i +1 − cMeOH ,i + cMeOH ,i +1
( z A )
z
concentration profile of methanol.
A
MeOH , z
A
MeOH , z
cMeOH , z − cMeOH , z −z
After discretization, a system of equations for the
A
A
A
cMeOH
, z +z − cMeOH , z + cMeOH , z +z
( z A )
=
Concentration profile
(23)
c
z
At the right interface, using the backward scheme:
Or
aI 0,MeOH
ref
cMeOH , z +z − cMeOH , z
(28)
(22)
DA
=
current density can be estimated as
M
I leak = 6 FN MeOH
,z
(32)
Page | 304
Nguyen et al.
International Journal of Advanced Engineering Research and Science, 9(8)-2022
M
N MeOH
, z is estimated from Eq. (11). Then, Eq.
In which
(32) is used to obtain ηC for a given value of ICell.
After the anode and cathode overpotentials are known, the
VCell for a given value of ICell is calculated using Eq. (1).
The parameters used in the model are summarized in
Table 1.
Table 1 Model parameters
Parameter
Value
a
1000 cm-1
DA
2.8 10-5exp(2436(1/353-1/T)) cm2/s
DB
8.7 10-6 cm2/s
DM
4.9 10-6exp(2436(1/333-1/T)) cm2/s
I 0,MeOH
ref
9.425 10-3exp(33570/R(1/333-1/T)) A/cm2
I 0,Oref
4.222 10-3exp(73200/R(1/333-1/T)) A/cm2
2
KI
0.8
KII
0.8
k
7.5 10-4
T
343.15 K
UMeOH
0.03 V
UO2
1.24 V
αa
0.52
αc
1.55
δA
0.0023 cm
δB
0.015 cm
δM
0.018 cm
κ
0.036 s/cm
λ
2.8 10-9 mol/cm3
2.5xMeOH
ξMeOH
II.
RESULTS AND DISCUSSIONS
the end of the curve is quite high. The disagreement could
The simulation results of the polarization curve for DMFC
be due to the assumption that the methanol electro-osmotic
at different concentrations of the bulk flow are shown in
drag coefficient is a constant value. It is better to calculate
Fig.3. The calculation results well agree with the
the electro-osmotic drag coefficient at each point, especially
experimental data report in [5]. However, the difference at
at the end of the curve.
www.ijaers.com
Page | 305
Nguyen et al.
International Journal of Advanced Engineering Research and Science, 9(8)-2022
1.2
1.0
Vcell
0.8
0.6
0.4
0.5M
0.2M
0.1M
0.2
0.05M
0.0
0.00
0.02
0.04
0.06
0.08
0.10
0.12
0.14
Icell
Fig.3 Model predictions for different methanol concentrations
Fig.4 shows concentration profiles across the anode and membrane obtained by the model for the four concentrations at
15 mA/cm2.
Methanol concentration (mol/L)
0.5
0.4
cb=0.5M
0.3
0.2
cb=0.2M
0.1
cb=0.1M
cb=0.05M
0.0
0.000
0.005
0.010
0.015
0.020
0.025
0.030
0.035
z (cm)
Fig.4 Concentrations profiles for different methanol bulk concentrations
III.
CONCLUSIONS
parameters from literature, the calculation results well
In this study, a finite difference scheme were sucessfully
agree with experimental polarization curve. The scheme
applied to solve the one-dimensional, isothermal model of
also is applicable in the estimation of concentration
a DMFC. Using reasonable transport and kinetic
profiles in the anode and membrane as well as predicting
www.ijaers.com
Page | 306
Nguyen et al.
International Journal of Advanced Engineering Research and Science, 9(8)-2022
the methanol crossover. The computation time is fast
enough for real time application.
ACKNOWLEDGMENTS
This
research
is
supported
by
Vietnam
National
Foundation for Science and Technology Development
(NAFOSTED) undergrant number 104.03-2018.367.
REFERENCES
[1] Cruickshank J . and Scott K., The degree and effect of
methanol crossover in the direct methanol fuel cell. Journal of
Power Sources, 1998. 70(1): p. 40-47.
[2] Dohle H., Divisek J., Mergel J., Oetjen H.F., Zingler C., and
Stolten D., Recent developments of the measurement of the
methanol permeation in a direct methanol fuel cell. Journal of
Power Sources, 2002. 105(2): p. 274-282.
[3] Ren X., Springer T.E., and Gottesfeld S., Water and Methanol
Uptakes in Nafion Membranes and Membrane Effects on
Direct Methanol Cell Performance. Journal of The
Electrochemical Society, 2000. 147(1): p. 92.
[4] Scott K., Taama W.M., Argyropoulos P., and Sundmacher K.,
The impact of mass transport and methanol crossover on the
direct methanol fuel cell. Journal of Power Sources, 1999.
83(1): p. 204-216.
[5] García B.L., Sethuraman V.A., Weidner J.W., White R.E.,
and Dougal R., Mathematical Model of a Direct Methanol
Fuel Cell. Journal of Fuel Cell Science and Technology, 2004.
1(1): p. 43-48.
[6] Meyers J.P. and Newman J., Simulation of the Direct
Methanol Fuel Cell. Journal of The Electrochemical Society,
2002. 149(6): p. A718.
www.ijaers.com
Page | 307