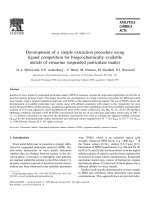
Development of a simple
Bạn đang xem bản rút gọn của tài liệu. Xem và tải ngay bản đầy đủ của tài liệu tại đây (330.9 KB, 15 trang )
Development of a simple extraction procedure using
ligand competition for biogeochemically available
metals of estuarine suspended particulate matter
D J. Whitworth, E.P. Achterberg
*
, V. Herzl, M. Nimmo, M. Gledhill, P.J. Worsfold
Department of Environmental Sciences, University of Plymouth, Plymouth, PL4 8AA, UK
Received 25 January 1999; received in revised form 8 March 1999; accepted 11 March 1999
Abstract
Sorption of trace metals by suspended particulate matter (SPM) in estuarine systems has important implications for the fate of
dissolved metals in these waters. This paper describes the development of a single extraction procedure for SPM-associated
trace metals, using a ligand competition approach with EDTA as the added complexing ligand. The use of EDTA allows the
determination of available particulate trace metals using well de®ned constraints with respect to the competition for trace
metals between EDTA and the particles. Incubation experiments showed that equilibrium times between EDTA and particulate
material of 72 h were required to reach equilibrium for most of the metals studied (Cu, Zn, Mn, Ni, Co, Al, Fe, Pb and Mg).
Optimum conditions included a 0.05 M EDTA concentration and the use of an extractant: particulate matter ratio of 200 : 1
(v : w). Kinetic calculations on data from the incubation experiments were used to calculate the apparent stability constants
(K
MeS
) for the metal-particulate matter interaction and indicated values ranging from 10
À2.1
for K
MgS
to 10
À13.5
for K
CuS
.
# 1999 Elsevier Science B.V. All rights reserved.
Keywords: Extraction; Metals; Suspended particulate matter; Kinetics; EDTA; Apparent stability constant; Estuary
1. Introduction
Trace metal behaviour in estuaries is strongly in¯u-
enced by suspended particulate material (SPM). Par-
ticle-water interactions of trace metals determine
whether they are ¯ushed from an estuary in the dis-
solved phase, or because of adsorption onto particles
are retained within the internal cycle of the estuary [1].
In many estuaries removal of dissolved metal concen-
trations has been observed in the turbidity maximum
zone (TMZ), which is an estuarine region with
strongly enhanced SPM levels (e.g. >600 mg l
À1
in
the Tamar estuary (U.K.), salinity 0.5±5 psu) [2,3].
Desorption of SPM bound metals (e.g. Mn and Zn [2]
and Cd, Cu and Zn [4]) has been observed in the higher
salinity regions of estuaries and has been explained by
an increase in major cation concentrations. Suspended
particulate matter may consist of biological, organic
and mineral phases [5] and each of these phases has a
different af®nity for trace metals.
Studies involving the determination of trace metals
in SPM and sediments often determine total metal
concentrations. This approach does not provide infor-
Analytica Chimica Acta 392 (1999) 3±17
*Corresponding author. Tel.: +44-1752-233-036; fax: +44-1752-
233-035; e-mail:
0003-2670/99/$ ± see front matter # 1999 Elsevier Science B.V. All rights reserved.
PII: S 0003-2670(99)00285-8
mation about the biogeochemical availability of the
particulate matter associated trace metals. For soils
and sediments, workers have employed sequential
chemical extraction schemes in order to investigate
trace metal association with organic and mineral
phases in their particles. Commonly employed
sequential extraction procedures for sediments include
the ®ve step scheme developed by Tessier et al. [6] and
the three step BCR scheme [7,8] and variations on
these schemes [9,10]. A large number of studies have
been published employing the multi-step sequential
extraction schemes on sediments [11±13] and soils
[14±16].
The sequential extraction procedures have a
number of disadvantages limiting their widespread
use for studies of SPM associated trace metals. Firstly,
the procedures often use 1 g of dry material, an
amount which is often dif®cult to obtain for SPM
by ®ltration of natural waters. Furthermore, parts of
sequential extraction schemes suffer from re-adsorp-
tion of the extracted metal onto the residual phases
remaining after each extraction step, and a limited
speci®city of the reagents for the targeted phases
of the soil or sediment [17,18]. In addition, the
procedures are labour-intensive and because of
the numerous steps involved have enhanced
associated errors and an enhanced risk of sample
contamination.
We, therefore, propose the use of a well de®ned
ligand competition procedure for the investigation of
non-lattice bound trace metals associated with SPM.
Our approach uses EDTA as the added competing
ligand. The use of EDTA for soil and sediment
extraction procedures has been reported by other
workers [16,19]. However, little or no work appears
to have been carried out using EDTA extraction
for SPM-associated metals. The analytical procedure
for SPM-associated trace metals reported in this
paper complements the ligand competition techni-
ques used in our laboratory for the determination
of trace metal complexation by dissolved organic
ligands in natural waters [20,21]. The proposed
extraction scheme allows the application of a well
de®ned binding strength, and provides an indication
of the biogeochemical availability of particle
associated metals. The approach is simple, requires
little sample handling, and has a small requirement
of SPM (minimum 15 mg). A total digestion using
HF complements the ligand competition extraction
scheme, and allows the assessment of the contribution
of biogeochemically available trace metals to the total
particulate metal concentration in SPM.
2. Materials and methods
2.1. Reagents and labware
All reagents and wash solutions were prepared in
water puri®ed by reverse osmosis (Milli-RO, Milli-
pore) followed by ion exchange (Milli-Q, Millipore).
Reagents were purchased from Merck and were of
AnalaR grade unless otherwise stated. Concentrated
acids were puri®ed by sub-boiling quartz distillation
and NH
3
was puri®ed through isopiestic distillation.
To ensure chemical consistency of the EDTA extrac-
tion solutions, a single 2.5 l stock solution of 0.5 M
EDTA was freshly prepared and used for all the
extraction studies. The pH of the EDTA stock solution
was set at pH 7.6 using an appropriate volume of
concentrated NH
3
(ca. 6.5 ml). Standard solutions
utilised for dissolved metal analysis by inductively
coupled plasma-mass spectrometry (ICP-MS) were
prepared from Spectrosol standard solutions
(1000 mg l
À1
Cu, Ni, Co, Fe, Mn, Pb, Al, Mg and
Zn), and acidi®ed to pH 2.2 using concentrated HNO
3
(1 ml per 1 ml of solution). When not in use, reagents
were stored in high density polyethylene (HDPE,
Nalgene) containers at 48 C in the dark.
Prior to use, all the sample bottles and reagent
containers were soaked in 2% (v/v) Decon 90 for
24 h, then washed in copious quantities of Milli-Q
water and transferred to a 50% (v/v) HCl bath and left
for one week. They were subsequently rinsed with
Milli-Q water and placed in a 20% (v/v) HNO
3
bath.
After a further week, the bottles were thoroughly
washed with Milli-Q water and stored inside re-seal-
able polythene bags.
2.2. Sample treatment
Suspended particulate material samples were col-
lected during a longitudinal transect in the Scheldt
Estuary (Belgium) during a survey with the research
vessel Belgica (December 1996). Water samples were
collected using 10 l Niskin sampling units deployed at
4 D J. Whitworth et al. / Analytica Chimica Acta 392 (1999) 3±17
3 m depth. After three rinses with Scheldt water, a
sample of 2.5 l was collected in an acid washed
HDPE container. In the ship's laboratory, the water
samples were ®ltered using a polysulfone vacuum
®ltration unit (Nalgene) ®tted with acid washed
(1% HCl), pre-weighed membrane ®lters (47 mm
diameter, 0.45 mm porosity, cellulose nitrate, What-
man). Seawater salts were rinsed from the ®lters
containing SPM by washing with 50 ml of Milli-Q
water. The ®lters were dried at 458C for 24 h and
frozen at À178C for transport to the laboratory in
Plymouth. In the laboratory, the ®lters were kept for a
further 24 h at 458C and subsequently re-weighed on a
precision balance (Sartorius). The weight of SPM on
the ®lters was calculated as the difference between the
weight of the ®lter containing SPM and the original
®lter.
In order to obtain a large quantity of material for
optimising a particulate metal extraction protocol
using EDTA, approximately 300 g of freshly depos-
ited particulate material was collected from the sedi-
ment-water interface at Halton Quay on the Tamar
Estuary (UK). It was postulated that a surface sedi-
ment sample from this locality would closely re¯ect
characteristics of estuarine SPM [3]. The sample was
collected from the sediment-water interface (<2 cm
depth) at a water depth of ca. 30 cm and transferred
into a re-sealable polythene bag using a HDPE scrap-
per. Air was expelled and the bag was resealed and
then stored at 48C for transport to the laboratory. In the
laboratory, the particulate material was immediately
air dried at 458C for 48 h. In order to achieve a
homogenous ®ne grained material, the dried sample
was crushed into a ®ne powder (<200 mm) using an
acid washed agate mortar and pestle, subsequently
placed in a polythene bag and left for 24 h on a
motorised end-to-end shaker (Baird and Tatlock,
UK) operating at 40 rpm.
The organic carbon (OC) content in the Halton
Quay particulate material was determined in triplicate
by the loss on ignition method [22]. For this purpose
acid was added to the material (10 ml of 1 M HCl to
1 g of particulate matter) to remove inorganic carbon
(mainly calcium carbonate), and subsequently the
material was dried at 1058C until constant weight
was achieved after cooling in a dessicator (weight
A). Subsequently, the material was ashed in a muf¯e
furnace at 6008C for 8 h, cooled in a dessicator and
weighed (weight B). The organic carbon content was
calculated as:
Percentage OC 100
A À B
A
(1)
2.3. Use of EDTA as extractant
The interaction between an added chelating ligand
and metals complexed by naturally occurring ligands
in the aquatic environment may be slow. Experiments
involving competition for dissolved Cu in seawater
between an added metal chelating ligand (salicylal-
doxime) and naturally occurring dissolved organic
ligands have indicated that the establishment of an
equilibrium may take more than 8 h [23]. In order to
investigate the rate of interaction between EDTA and
particle bound trace metals we performed incubation
experiments. The aim of these studies was to establish
the minimum time required for the EDTA-particulate
metal extraction procedure.
The incubation experiments were performed using
2 different ratios of extraction solution to particulate
matter (200 : 1 and 2000 : 1 (v : w)), in order to
investigate the in¯uence of particulate matter concen-
tration on the extraction ef®ciency. Furthermore, two
EDTA concentrations (0.005 M and 0.05 M) were
investigated. Table 1 includes the experiments that
were undertaken. The pH of the EDTA solution was
set at 7.6, which is close to the natural pH observed in
large parts of estuarine systems. The pH of the EDTA
extraction solutions was determined after the experi-
ments to ensure that dissolution of material from the
particles did not modify the pH of the experiments. No
change in pH was observed at the end of the EDTA
extraction experiments.
Fig. 1 gives a schematic representation of the par-
ticle extraction procedures applied during all extrac-
tion experiments. Samples were agitated during the
incubation period using an end-to-end shaker set at
40 rpm. A centrifuge (Sanyo, Centaur 2, 3000 rpm for
10 min) was utilised to separate the extraction solution
from the particulate material. The supernatant was
acidi®ed to pH ca. 2 using concentrated HNO
3
(1 ml
per 1 ml of solution) to avoid loss of metals onto the
wall of the bottles, and then stored at 48C prior to
metals analysis by ICP-MS. All experiments were
carried out in triplicate using separate fractions of
D J. Whitworth et al. / Analytica Chimica Acta 392 (1999) 3±17 5
freshly deposited particulate material collected from
Halton Quay or SPM from the Scheldt.
2.4. Other extraction protocols
Commonly employed single extraction protocols
for marine SPM and sediment particles were utilised
to allow comparison with the ef®ciency of the EDTA
protocol. The protocols applied included the extrac-
tion of metals from particulate material using 1 M HCl
for 6 h [24±26], 25% acetic acid at pH 4.5 for 16 h [1],
1 M ammonium acetate at pH 7 for 6 h [19] and
0.05 M EDTA at pH 7.6 for 72 h. The extraction
procedures are summarised in Table 1 and Fig. 1
and were applied to certi®ed reference materials
(CRMs), BCR 320 (riverine sediment) and BCR
Table 1
Procedures used for particle extraction experiments using particulate material from Halton Quay with EDTA, HCl, ammonium acetate and
acetic acid as extractants
Experiment Reagent Ratio extractant:
particle (v : w)
Dilution for metals
analysis by ICP-MS
Incubation
time (h)
Metals determined
1 0.05 M EDTA 200 : 1 10 1, 4.5,10, 24, 48 Cu, Co, Ni, Zn, Fe, Mg
2 0.005 M EDTA 200 : 1 0 1, 4.5,10, 24, 48 Cu, Co, Ni, Zn, Fe, Mg
3 0.05 M EDTA 200 : 1 10 18, 24, 36, 48, 60, 72 Cu, Co, Ni, Zn, Fe, Al, Pb, Mn, Mg
4 0.05 M EDTA 2000 : 1 10 18, 24, 36, 48, 60, 72 Cu, Co, Ni, Zn, Fe, Al, Pb, Mn, Mg
5 1 M HCl 200 : 1 10 6 Cu, Co, Ni, Zn, Fe, Al, Pb, Mn, Mg
6 25% (v:v) acetic acid 200 : 1 10 16 Cu, Co, Ni, Zn, Fe, Al, Pb, Mn, Mg
7 1 M ammonium acetate 200 : 1 10 6 Cu, Co, Ni, Zn, Fe, Al, Pb, Mn, Mg
Fig. 1. Schematic representation of the procedure adopted for particulate metal extraction experiments.
6 D J. Whitworth et al. / Analytica Chimica Acta 392 (1999) 3±17
277 (estuarine sediment) supplied by the Commission
of the European Communities, Community Bureau of
Reference. Furthermore, a total digestion of the CRMs
was performed using HNO
3
and HF, following a
method adapted from Rantala and Loring [27], to
verify the accuracy of the extraction and analytical
procedures. The total digestion was also applied to the
SPM from the Scheldt Estuary. For the total digestion,
150 mg of certi®ed reference material, or a pre-
weighed ®lter with a known amount of SPM (between
30 and 500 mg) was placed into a 30 ml PTFE decom-
position vessel, 10 ml of concentrated HNO
3
was
added and the vessel was put on a hotplate (1208C),
for a re¯ux period of 24 h. Subsequently, 2 ml of
concentrated HF was added and the re¯ux was con-
tinued for a further 48 h at 1208C. The vessel was then
uncovered and 4 ml of HNO
3
added and the content of
the vessel was evaporated to dryness on the hotplate
(1208C). 10 ml of concentrated HNO
3
was added and
the content of the vessel was evaporated to dryness at
708C; this step was repeated twice. Then 10 ml of
0.1 M HNO
3
was added to the vessel and the solution
was transferred into a 25 ml HDPE volumetric ¯ask
containing 0.93 g of H
3
BO
3
. The volumetric ¯asks
were made up to volume using 0.1 M HNO
3
and stored
in the refrigerator at 48C for subsequent metal analysis
by ICP-MS. The total digestion of the CRMs was
performed in triplicate. Procedural blanks were pro-
cessed and used for correction of particulate metal
data.
2.5. Trace metal analysis by ICP-MS
The concentration of metals (Cu, Ni, Co, Fe, Mn,
Pb, Al, Mg and Zn) in the supernatant after centrifu-
gation was determined by ICP-MS using a VG
Elemental PQ2 Turbo instrument (Winsford,
Cheshire). The spectrometer was ®tted with an
Ebdon high solids `V' groove nebuliser (Ar gas ¯ow
set at 0.9 l min
À1
) connected to a Scott double pass
spray chamber (Ar coolant, 15 l min
À1
) and the
plasma gas ¯ow was ®xed at 1 l min
À1
. Samples
were introduced into the manifold at 1 ml min
À1
.
Analytes were ionised at 1350 W and the detection
dwell time was 10.24 Â 10
À3
s. Fe measurements
were determined from the
57
Fe concentration, as
56
Fe could not be directly determined due to poly-
atomic interferences (ArO). Sample solutions contain-
ing EDTA were diluted with Milli-Q to EDTA con-
centrations of 0.005 M, in order to avoid interferences
associated with EDTA. For experiments involving
EDTA, metal standards were matrix matched to the
sample by preparing the standards in 0.005 M EDTA.
Calibration was undertaken immediately prior to sam-
ple analyses. In addition, the samples and standards
were spiked with
115
In (100 mgl
À1
) in order to correct
analytical drift during the operation of the spectro-
meter.
3. Results and discussion
3.1. EDTA extraction studies
Experiments 1 and 2 (see Table 1) were designed to
compare the effect of the EDTA concentration and the
incubation time on the extraction ef®ciency for
0.005 M and 0.05 M EDTA at a ratio of extraction
solution to particulate material of 200 : 1 (v : w; 30 ml
EDTA solution with 150 mg of particulate material).
Fig. 2 shows the concentrations of Fe, Cu, Zn, Co, Ni,
and Mg extracted using EDTA and normalised with
respect to the particulate matter concentration, plotted
against time for these experiments. The maximum
incubation periods used for the EDTA extractions
were 48 and 72 h, respectively. The results suggest
that after 48 h the extracted concentrations of Fe, Mg
and Cu were lower in the 0.005 M EDTA extraction
solution compared with the 0.05 M solution. The
difference was small and within the experimental error
for Zn, Co and Ni. Furthermore, metals were extracted
more rapidly and a plateau in metal concentration was
reached earlier using the 0.05 M ETDA compared
with the 0.005 M EDTA. Therefore, the equilibrium
between metals complexed by EDTA, and those asso-
ciated with particulate matter, was reached more
rapidly using the 0.05 M EDTA solution. The use
of a lower EDTA concentration (0.005 M) will, there-
fore, extract a lower amount of Fe, Mg and Cu from
particulate material, but will also require a longer
incubation time to attain equilibrium, compared to a
higher EDTA concentration (0.05 M).
The in¯uence of the concentration of particulate
material on the metal (Me) extraction ef®ciency was
investigated by employing 2 different ratios of extrac-
tion solution (0.05 M EDTA) to particulate material:
D J. Whitworth et al. / Analytica Chimica Acta 392 (1999) 3±17 7
200 : 1 and 2000 : 1 (v : w; 30 ml of EDTA solution
with 150 mg and 15 mg of particulate material,
respectively). In addition to the metals measured
during the previous experiment, Mn, Pb and Al were
also determined. The incubation period was 72 h in
order to allow more time for the attainment of equili-
brium (experiments 3 and 4, Table 1). The results of
this experiment are shown in Figs. 2 and 3, and
indicate that increasing the extractant to particle ratio
from 200 : 1 to 2000 : 1 (v : w) had no effect on the
particulate matter-normalised MeEDTA concentra-
tions, with the differences between MeEDTA concen-
trations within analytical errors (with the exception of
Al (Fig. 3(c)). This observation may be explained by
the use of an excess concentration of EDTA during the
experiments, of which a large fraction was not com-
plexed to metal ions. The different behaviour observed
for Al may be attributed to the fact that an equilibrium
Fig. 2. Concentration of particulate metal (Fe, Cu, Zn, Co, Ni, Mg) extracted using 0.05 M EDTA with an extraction solution to particulate
matter ratio of 200 : 1 and 2000 : 1 (v : w), and 0.005 M EDTA with a ratio of 200 : 1, plotted against time. Legend key presented on Fig. 2(a),
and number between brackets refers to experiment (see Table 1). Solid curve obtained from model calculations.
8 D J. Whitworth et al. / Analytica Chimica Acta 392 (1999) 3±17
for Al between EDTA and sorption sites on the
particles is attained only very slowly (see below).
3.2. Modelling of EDTA kinetic incubation
experiments
Experiments 1±4 indicated that the competition
between EDTA and particle bound metals was not
instantaneous (see Figs. 2 and 3). The data from
experiments 1 and 3 (0.05 M EDTA extraction solu-
tion to particle ratio of 200 : 1 (v : w)) were, therefore,
used to model the interaction between EDTA and
metals.
The competition between the EDTA and the surface
sites of the particles (S) for the trace metals can be
described using Eq. (2). The concentration of metal
associated with particles is denoted by [MeS] and the
EDTA complexed metal concentration by [MeEDTA].
The reaction can be characterised by two rate con-
stants: k
1
for the forward and k
2
for the reverse reaction
[28]. The time dependent linear differential equation
for reaction (2) is expressed by Eq. (3), asuming that
the EDTA concentration used is in excess of the metal
concentrations, and, therefore, is constant. We also use
the assumption that the concentration of S is much
greater than the concentration of MeS, and that an
increase in concentration of S with time is negligible.
MeS EDTA 6
k
1
k
2
S MeEDTA (2)
dMeEDTA
dt
k
1
MeSÀk
2
MeEDTA (3)
Using the assumption that at t 0 the amount of the
metal complexed with EDTA is zero, the solution to
Eq. (3) is
MeEDTA
k
1
k
1
k
2
MeS
t0
À
k
1
k
1
k
2
e
Àk
1
k
2
t
MeS
t0
(4)
Fig. 3. Concentration of particulate metal (Mn, Pb and Al) extracted using 0.05 M EDTA with an extraction solution to particulate matter ratio
of 200 : 1 and 2000 : 1 (v : w). Legend key presented on Fig. 3(a), and number between brackets refers to experiment (see Table 1). Solid
curve obtained from model calculations.
D J. Whitworth et al. / Analytica Chimica Acta 392 (1999) 3±17 9
With the use of curve ®tting software (CurveFitEx-
pert 1.3) and an exponential function of the form
y a(1Àe
bx
), the concentration of [MeS]
t 0
was
estimated as being the concentration of [MeEDTA]
at equilibrium. Subsequently, a computer programme
(written in Turbo-Pascal) was employed to calculate
the rate constants (k
1
and k
2
(h
À1
)) using Eq. (4) and
the data obtained from experiments 1 and 3. The
curves obtained from the model calculations are pre-
sented in Figs. 2 and 3. Table 2 shows the results of
calculations of the minimum time required for the
different elements to attain equilibrium with the
extraction solution. A commonly used approach to
assess the state of equilibrium is the characteristic
reaction response time (t
resp
), which is de®ned as the
time required to achieve 63% of the equilibrium
concentration (or the time to reduce the imbalance
to e
À1
(37%) of its initial imbalance) [29]. We also
calculated the minimum times required to achieve
95% (t
95%
) and 100% (t
100%
) of the equilibrium con-
centration. Furthermore, the estimated equilibrium
concentrations of [MeEDTA] for t
100%
determined
using this approach are presented in Table 2.
Figs. 2 and 3 show that the time required to obtain
95% (t
95%
) of the equilibrium concentration was 30 h
or less for all metals except Al (Table 2). For this
element we observed a slow desorption process that
can be attributed to (a) the release of Al from binding
sites due to the competitive action of EDTA, and (b)
the slow dissolution of Al from the lattices of clay
particles. The slow release of Al is most likely respon-
sible for its t
95%
value of 149 h. The calculated t
100%
for Al was greater than 3000 h, and for Cu and Mn
greater than 400 h. Extractions over this period of time
are practically impossible, and would most likely
result in analytical artefacts including re-adsorption
of metals on particles and walls of the sample con-
tainer and perhaps bacterial alteration of the metal
speciation. An extraction time of 72 h for the experi-
ments involving EDTA was, therefore, chosen as the
optimum condition, because most of the metal extrac-
tions reached a state of at least 95% of their equili-
brium within this time period.
The kinetic calculations allowed us to determine the
interaction between the metals and the sites on the
surface of the particles. For this purpose we separated
Eq. (2) into two reactions
MeS 6 Me SK
MeS
SMe
H
MeS
(5)
where K
MeS
is the apparent stability constant, and
EDTA Me 6 MeEDTA
K
H
Me
H
EDTA
H
MeEDTA
EDTA
H
Me
H
(6)
where K
H
Me
H
EDTA
H
is the conditional stability constant.
[EDTA
H
] is the concentration of EDTA not complexed
by Me, and can be taken as [EDTA], as [EDTA])
[Me]. The conditional stability constant for Eq. (2)
can be written as
K
2
SMeEDTA
MeSEDTA
H
(7)
and is the product of the apparent and conditional
stability constants of the separate reactions
K
2
K
MeS
K
H
Me
H
EDTA
H
(8)
Table 2
Treshold times and equilibrium concentrations calculated using the kinetic model. Conditional and apparent stability constants (defined in
Eqs. (5)±(7)) were obtained from the literature (log K
H
Me
H
EDTA
H
) [28] and model calculations (log K
2
and log K
MeS
)
Metal t
resp
(h)
t
95%
(h)
t
100%
(h)
eq. conc.
(mgg
À1
)
Log
K
H
Me
H
EDTA
H
Log
K
2
Log
K
MeS
Fe 3.5 10 210 768 12.9 7.8 À5.1
Mg 0.8 2.5 50 317 8.0 5.9 À2.1
Mn 7.3 22 442 44.4 13.0 4.5 À8.5
Cu 10 30 608 27.1 17.6 4.1 À13.5
Zn 1.4 4.3 87 23.3 15.7 4.8 À10.9
Pb 8.3 25 503 10.2 16.9 4.8 À12.1
Ni 1.1 3.3 66 1.59 17.8 4.46 À13.3
Co 1.7 5.2 105 0.89 15.5 3.97 À11.5
Al 50 149 3020 245 7.6 3.0 À4.6
10 D J. Whitworth et al. / Analytica Chimica Acta 392 (1999) 3±17
The conditional stability constants for the metal-
EDTA reactions (K
H
Me
H
EDTA
H
) were obtained from the
literature [28] and corrected for the side reactions of
EDTA and Me at pH 7.6 and ionic strength of 0.1 M
(Table 2). The desorption of metals (Me) from surface
sites (S) is simply described by our model as a
competition between MeS and the sum of the metal
EDTA complexes. In practice, only one, or at most
two, metal-EDTA complexes will be involved in the
equilibrium. The predominant species can be assessed
by comparing the -coef®cients that describe the
reactions between the metal ion and the EDTA species
[30] under the given conditions of pH, temperature
and ionic strength. Only the most important MeEDTA
complexes have been used for our calculations and
are included in Table 2. For most metals considered,
the important complex is MeEDTA, although for Al it
is Al(OH)EDTA. However, for Fe and Zn both
MeEDTA and Me(OH)EDTA are important. In order
to simplify the calculation, the predominant complex
was used in this study. At pH 7.6 FeEDTA and
ZnEDTA formed the predominant species (60 and
90% of the total metal-EDTA complexes, respec-
tively), and these were used for further calculations.
However, it must be noted that this simpli®cation will
result in less certainty for calculations of K
FeS
and
K
ZnS
.
K
2
can be calculated from the forward and reverse
reaction rate constants (k
1
and k
2
) [28,31]
K
2
k
1
k
2
(9)
and K
MeS
can then be derived using Eq. (8). The
results are presented in Table 2 and show that K
MeS
generally follows the Irving±Williams order. Accord-
ing to this rule, the stability of metal complexes
increases in the series [29] Mn
2
` Co
2
`
Ni
2
` Cu
2
b Zn
2
. The approach used with EDTA
as extractant releases metals into solution from sites
with a lower `binding strength' than that of the EDTA
ligand. The amount of MeEDTA extracted, therefore,
relates to the strength of the MeEDTA complex. In the
case of Fe and Al, not just the partition between solid
and dissolved phases is important, but also the dis-
solution of solid phases, as precipitation and coagula-
tion strongly in¯uence their solid speciation.
Potentially useful information on metal partitioning
between solid and dissolved phases may be gained by
comparing apparent stability constants obtained using
the method presented here and conditional stability
constants measured for naturally occuring dissolved
organic material (K
H
Me
H
L
H
; de®ned using Eq. (10)
MeL 6 Me LK
H
MeL
L
H
Me
H
Me
H
L
H
(10)
For example, the current study indicates that the
apparent stability constant for Cu (K
CuS
10
À13.5
)of
the particulate matter from the sediment-water inter-
face at Halton Quay, compares well with reported
constants for dissolved organic ligands and Cu:
10
À10
±10
À14
for lacustrine, seawater and estuarine
conditions [21,32,33]. This observation may imply
that organic ligands on particles are important for
the complexation of Cu; sequential extraction schemes
on sediments have reported similar ®ndings [18,34].
The Halton Quay particulate material contained an
important fraction of OC: 1.01 Æ 0.05%. In natural
waters competition may, therefore, occur for Cu
between particle surface sites and dissolved Cu com-
plexing natural ligands. In the case of Zn, reported
conditional stability constants for the dissolved
ligands and Zn (between 10
À7.4
and 10
À9.3
) are some-
what higher than for K
ZnS
(10
À10.9
). Conditional sta-
bility constants for the interaction between dissolved
organic ligands and Pb in seawater are of the order
10
À8
±10
À9
[35]. The lower value for K
PbS
(10
À12.1
)
would suggest that estuarine particulate matter may
actively remove dissolved Pb from solution. A particle
reactive behaviour has been observed for dissolved Pb
in estuarine systems [36]. Conditional stability con-
stants for dissolved ligands and Fe in coastal and
oceanic conditions are reported to be ca. 10
À18
±
10
À23
[31,37]. The apparent stability constant
(10
À5.1
) for FeS is subject to error (see above), how-
ever the large difference in stability constant between
the dissolved organic ligands and particulate matter
for Fe suggests that processes other than complexation
(i.e. precipitation, coagulation) determines the beha-
viour of Fe in estuarine systems.
Further work will need to be undertaken to relate the
apparent stability constants to different types of SPM
(e.g. riverine, marine, estuarine). This may allow us to
link changes in apparent stability constants to different
physico-chemical characteristics of SPM. Further-
more, the fraction of MeS released by the ligand
competition approach will give information about
D J. Whitworth et al. / Analytica Chimica Acta 392 (1999) 3±17 11
the geochemical availability of the metals. Inclusion in
water quality models of conditional stability constants
for the metal-dissolved ligand interactions and the
apparent stability constants for metal SPM interac-
tions may also result in important improvements in our
ability to model contaminant behaviour in natural
waters.
3.3. Certified reference materials: total digests and
comparison of EDTA extraction with other
single extractants
Certi®ed reference materials BCR 320 (riverine
sediment) and BCR 277 (estuarine sediment) were
analysed for total particulate Pb, Zn, Fe, Cu, Co, Ni,
Al, Mg and Mn, after digestion using HF and HNO
3
(see Section 2.4) The results of the analysis are pre-
sented in Table 3. The data show that the analysed and
certi®ed values were in close agreement.
Further experiments were performed using the BCR
320 and BCR 277 sediments in order to compare the
concentration of exchangeable metals extracted from
these sediments using 0.05 M EDTA with other com-
monly used single extraction procedures (1 M HCl,
25% (v : v) acetic acid and 1 M ammonium acetate;
experiments 5±8, Table 1). Figs. 4 and show the
results of these experiments with the extracted metal
concentration presented as a fraction of the total metal
concentration obtained after total digestion of the
sample.
Fig. 4 shows that for most metals (with the excep-
tion of Al and Zn), 1 M HCl extracted a higher fraction
of particulate metal in BCR 320 compared with the
other extractants (e.g. Co 44%, Ni 50% and
Fe 36%). This observation indicates that metals
were not easily removed from the riverine sediment
using mild extraction procedures at pH values between
4.5 and 7.6. The low pH of the HCl extraction solution,
may have resulted in the dissolution of carbonate
phases in the sediment particles, and hence released
matrix bound particulate metals. The fraction of par-
ticulate metals extracted from the BCR 320 sediment
using the 0.05 M EDTA (pH 7.6) and the 25% v : v
acetic acid (pH 4.5) extraction solutions were similar
(Fig. 4). For most metals, the lowest extraction yield
was obtained using 1 M ammonium acetate.
The fractions of metal extracted using 1 M HCl
were generally similar for BCR 277 compared with
BCR 320 (Fig. 5). However, the other extractants
showed higher yields for BCR 277. The particulate
metals in the BCR 277 estuarine sediment, therefore,
appeared to be present in a more available form
compared with BCR 320. As was the case for BCR
320, the ammonium acetate extractions with BCR 277
resulted in the lowest yield. Furthermore, the 0.05 M
EDTA and 25% acetic acid extractions resulted again
in comparable yields.
3.4. Application to SPM from the Scheldt Estuary
The 0.05 M EDTA extraction protocol was used to
investigate the extractable metal concentrations of
SPM in surface water samples from the Scheldt Estu-
ary. An incubation time of 72 h was employed and the
Table 3
Analysis of total particulate metal concentration in certified reference materials BCR 277 and BCR 320
BCR 277 BCR 320
Certified concentration
a
Observed concentration Certified concentration Observed concentration
a
Mn (mg g
À1
) 1.5
a
1.5 Æ 0.008 0.8
a
0.67 Æ 0.02
Mg (mg g
À1
)11
a
11 Æ 0.03 21
a
19 Æ 0.5
Al (mg g
À1
)51
a
49 Æ 0.8 87
a
80 Æ 0.8
Fe (mg g
À1
)46
a
41 Æ 0.4 49
a
37 Æ 0.7
Co (mgg
À1
)16Æ 0.8 14 Æ 0.45 19 Æ 0.9 16 Æ 1.9
Ni (mgg
À1
)41Æ 4.4 43 Æ 1.6 75 Æ 1.4 N/A
Zn (mgg
À1
) 547 Æ 12 536 Æ 31 142 Æ 3 123 Æ 10
Cu (mgg
À1
) 102 Æ 1.6 100 Æ 944Æ 1 36 2.9
Pb (mgg
À1
) 146 Æ 3 152 Æ 6.6 42 Æ 1.6 60 Æ 2.7
a
Indicative values (uncertified values provided by BCR); N/A analysis not undertaken; mean Æ SD (n 3).
12 D J. Whitworth et al. / Analytica Chimica Acta 392 (1999) 3±17
EDTA:SPM ratio was 200 : 1 (v : w). Furthermore, the
total particulate concentration of metals was deter-
mined following a digestion involving HF and HNO
3
.
Fig. 6 shows the total and EDTA extractable SPM
concentrations of Zn (a), Ni (b), Cu (c), Mn (d), Mg
(e), and SPM along with POC (f) plotted against
salinity. The metal concentrations have been normal-
ised with respect to the SPM concentrations. Distribu-
tions of other elements obtained during this study will
be published elsewhere. The total metal concentra-
tions in SPM obtained during our study compared well
with previous SPM metal studies carried out in the
Scheldt Estuary [36,38]. The total concentration of Zn,
Ni and Cu in SPM showed a maximum at low salinity
(3 psu). The maxima coincided with an increased POC
concentration, and may, therefore, have been caused
by industrial or urban waste water discharges [39].
The increase in POC also coincided with a minimum
in Mn, which can probably be explained by dissolution
of this redox-sensitive element from SPM in high
organic, low oxygen waters [39,40]. The trend in
EDTA-exchangeable metal concentrations with sali-
nity for Zn, Ni Cu and Mn generally mimicked the
total SPM metal concentrations for these metals. The
fraction of EDTA extractable metal with respect to the
total metal SPM concentration roughly ranged
between 40±70% for Zn, 30±60% for Ni, 60±85%
for Cu, 60±80% for Mn and 6±40% for Mg. The
Fig. 4. Fraction of particulate metals Mg, Mn, Fe, Co, Ni and Cu (a) and Al, Zn and Pb (b) extracted from BCR 320 using 1 M HCl, 25%
(v : v) acetic acid, 0.05 M EDTA and 1 M ammonium acetate. The digestion using HF and HNO
3
represents total particulate metal
concentration (100%). Legend presented in Fig. 4b.
D J. Whitworth et al. / Analytica Chimica Acta 392 (1999) 3±17 13
relative high proportions of EDTA extractable con-
centrations for Zn, Ni, Cu and Mn compared to the
total SPM metal concentrations, can most likely be
explained by the perturbed nature of the Scheldt
estuary, with high anthropogenic inputs of metals.
Metals originating from anthropogenic sources
become associated with the surfaces of the particulate
material and are, therefore, more loosely bound then
residual metals held in the lattices of particles [41].
This has important implications for the long term fate
of these particle associated trace metals, with possible
removal of weakly associated metals by cation
exchange upon SPM entering the coastal waters.
The lowest percentage of extractable metals was
observed at high salinities (>30 psu). Suspended par-
ticulate matter in this part of the estuary may have lost
easily exchangeable metal as a result of cation
exchange processes, and also may have been diluted
with cleaner marine SPM containing low metal con-
centrations. The fraction of Mg extracted using EDTA
was small compared with the other metals. Particulate
Mg is commonly present in clay minerals and, there-
fore, less accessible to EDTA for extraction.
4. Conclusions
This study presents the application of a ligand
competition procedure for the investigation of non-
Fig. 5. Fraction of particulate metals Mg, Mn, Fe, Co, Ni and Cu (a) and Al, Zn and Pb (b) extracted from BCR 277 using 1 M HCl, 25% v:v
acetic acid, 0.05 M EDTA and 1 M ammonium acetate. The digestion using HF and HNO
3
represents total particulate metal concentration
(100%). Legend presented in Fig. 5b.
14 D J. Whitworth et al. / Analytica Chimica Acta 392 (1999) 3±17
lattice bound trace metals associated with SPM. The
method uses EDTA (0.05 M) as the added competing
ligand and, therefore, has a well de®ned metal binding
strength and provides information about the nature of
the sorption sites for metals on particles. Our approach
is along similar lines to the ligand competition tech-
Fig. 6. Concentrations of particulate metals Zn (a), Ni (b), Cu (c), Mn (d), and Mg (e) obtained using 0.05 M EDTA (exchangeable), and HF
and HNO
3
(total) from SPM sampled at different salinities in the Scheldt Estuary (Belgium).
D J. Whitworth et al. / Analytica Chimica Acta 392 (1999) 3±17 15
niques used for determination of trace metal com-
plexation by dissolved organic ligands in natural
waters [20,21]. Assessment of the contribution of
biogeochemically available trace metals to the total
particulate metal concentration in SPM can be per-
formed when the extraction scheme is complemented
by a total digestion using HF and HNO
3
. The proposed
extraction scheme has a low requirement of SPM, and
is simple and requires a minimal amount of reagents
and sample handling and hence has an inherent low
risk of sample contamination. The occurrence of re-
adsorption of metals during extraction has been
reported, where metal initially released by the
reagent then re-precipitates or partitions back
onto the solid phase [42]. Rendell et al. (1980) [43]
reported that extractions using EDTA are not affected
by this problem. Our experiments also indicated that
none of the trace metals investigated showed post
extraction re-adsorption effects during the incubation
period.
Future work will involve further development of the
method for the investigation of apparent stability
constants of SPM metal interactions using the pre-
sented kinetic approach. Application of the method to
different estuarine environments will allow a better
understanding of the role of SPM in the behaviour of
metals in these systems.
Acknowledgements
DJW wishes to thank the University of Plymouth
for funding his Ph.D. studentship. EPA gratefully
acknowledges Analytica Chimica Acta for the
awarded bursary to present a paper at Euroanalysis
X (Basel, Switzerland). The authors thank the crew of
the R/V Belgica for their assistance during sampling,
and Prof. R. Wollast (University of Brussels) for the
provision of the POC data from the Scheldt.
References
[1] A.W. Morris, A.J. Bale, R.J.M. Howland, G.E. Millward,
D.R. Ackroyd, D.H. Loring, R.T.T. Rantala, Wat. Sci.
Technol. 18 (1986) 111.
[2] D.R. Ackroyd, A.J. Bale, R.J.M. Howland, S. Knox, G.E.
Millward, A.W. Morris, Estuarine Coastal Mar. Sci. 23 (1986)
621.
[3] I. Grabemann, R.J. Uncles, G. Krause, J.A. Stephens,
Estuarine Coastal Shelf Sci. 45 (1997) 235.
[4] J.J.G. Zwolsman, B.T.M. Van Eck, C.H. Van der Weijden,
Geochim. Cosmochim. Acta 61 (1997) 1635.
[5] J. Buffle, Complexation Reactions in Aquatic Systems; An
Analytical Approach, Ellis Horwood, Chicester, 1988.
[6] A. Tessier, T.G.C. Campbell, M. Bisson, Anal. Chem. 51
(1979) 851.
[7] P. Queauvauviller, G. Rauret, J F. Lopez-Sanchez, R. Rubio,
A. Ure, H. Muntau, Sci. Tot. Environ. 205 (1997) 223.
[8] J.F. Lopez-Sanchez, A. Sahuquillo, H.D. Fiedler, R. Rubio,
G. Rauret, H. Muntau, P. Quevauviller, Analyst 123 (1998)
1675.
[9] L. Campanella, D. D'Orazio, B.M. Petronio, E. Pietrantonio,
Anal. Chim. Acta 309 (1995) 387.
[10] M. Kersten, U. Forstner, Mar. Chem. 22 (1987) 299.
[11] P. Szefer, G.P. Glasby, J. Pempkowiak, R. Kaliszan, Chem.
Geol. 120 (1995) 111.
[12] M. Kersten, U. Forstner, Wat. Sci. Technol. 18 (1986) 121.
[13] Y. Weimin, G.E. Batley, M. Ahsanullah, Sci. Tot. Environ.
125 (1992) 67.
[14] M.J. Gibson, J.G. Farmer, Environ. Pollut. Ser. B. 11 (1986)
117.
[15] S. Xiao-Quan, C. Bin, Anal. Chem. 65 (1993) 802.
[16] D. McGrath, Sci. Tot. Environ. 178 (1996) 37.
[17] C. Whalley, A. Grant, Anal. Chim. Acta. 291 (1994) 287.
[18] J.R. Lead, J. Hamilton-Taylor, W. Davison, Sci. Tot. Environ.
209 (1998) 193.
[19] A.M. Ure, P. Quevauviller, H. Muntau, B. Griepink, Intern. J.
Anal. Chem. 51 (1993) 135.
[20] E.P. Achterberg, C.M.G. van den Berg, Deep-Sea Res. II. 44
(1997) 693.
[21] E.P. Achterberg, C.M.G. van den Berg, M. Boussemart, W.
Davison, Geochim. Cosmochim. Acta. 61 (1997) 5233.
[22] D.H. Mook, C.M. Hoskin, Estuarine Coastal Shelf Sci. 15
(1982) 697.
[23] M.L.A.M. Campos, C.M.G. van den Berg, Anal. Chim. Acta.
284 (1994) 481.
[24] G.W. Bryan, W.J. Langston, Environ. Pollut. 76 (1992) 89.
[25] J.D. Burton, M. Althaus, G.E. Millward, A.W. Morris, P.J.
Statham, A.D. Tappin, A. Turner, Phil. Trans. R. Soc.
London. 343 (1993) 557.
[26] G.E. Millward, G.A. Glegg, Estuarine Coastal Shelf Sci. 44
(1997) 97.
[27] R.T.T. Rantala, D.H. Loring, Intern. J. Anal. Chem. 19 (1985)
166.
[28] F.M.M. Morel, Principles of Aquatic Chemistry, Wiley New
York, 1983.
[29] W. Stumm, J.J. Morgan, Aquatic Chemistry-Chemical
Equilibria and Rates in Natural Waters, Wiley, New York,
1996.
[30] A. Ringbom, E. Still, Anal. Chim. Acta 59 (1972) 143.
[31] A.E. Witter, G.W. Luther III, Mar. Chem. 62 (1998) 241.
[32] E.P. Achterberg, Trace Metal Speciation in Natural Waters,
Ph.D. Thesis, University of Liverpool, 1993.
[33] L.J.A. Gerringa, T.C.W. Poortvliet, H. Hummel, Estuarine
Coastal Shelf Sci. 42 (1996) 629.
16 D J. Whitworth et al. / Analytica Chimica Acta 392 (1999) 3±17
[34] C.M. Davidson, R.P. Thomas, S.E. McVey, R. Perala, D.
Littlejohn, A.M. Ure, Anal. Chim. Acta 291 (1994) 277.
[35] J.M. Santana-Casiano, M. Gonzalez-Davila, J. Perez-Pena,
F.J. Millero, Mar. Chem. 48 (1995) 115.
[36] P. Valenta, E.K. Duursma, A.G.A. Merks, H. Rutzel, H.W.
Nurnberg, Sci. Tot. Environ. 53 (1986) 41.
[37] M. Gledhill, C.M.G. van den Berg, Mar. Chem. 47 (1994)
41.
[38] J.J.G. Zwolsman, G.T.M. Van Eck, Neth. J. Aquat. Ecol. 27
(1993) 287.
[39] H. Paucot, R. Wollast, Mar. Chem. 58 (1997) 229.
[40] J.C. Duinker, R. Wollast, G. Billen, Estuarine Coastal Mar.
Sci. 9 (1979) 727.
[41] R. Wollast, in W. Salomons, B. Bayne, E.K. Duursma, U.
Forstner (Eds.), Pollution of the North Sea: An Assessment.
Springer, Berlin, 1988, p. 183.
[42] E. Tipping, N.B. Hetherington, J. Hilton, D.W. Thompson, E.
Bowles, J. Hamilton-Taylor, Anal. Chem. 57 (1985) 1944.
[43] P.S. Rendell, G.E. Batley, A.J. Cameron, Envir. Sci. Technol.
14 (1980) 314.
D J. Whitworth et al. / Analytica Chimica Acta 392 (1999) 3±17 17