Báo cáo khoa học: Structural study of the catalytic domain of PKCf using infrared spectroscopy and two-dimensional infrared correlation spectroscopy pot
Bạn đang xem bản rút gọn của tài liệu. Xem và tải ngay bản đầy đủ của tài liệu tại đây (467.68 KB, 14 trang )
Structural study of the catalytic domain of PKCf using
infrared spectroscopy and two-dimensional infrared
correlation spectroscopy
Sonia Sa
´
nchez-Bautista, Andris Kazaks*, Melanie Beaulande, Alejandro Torrecillas,
Senena Corbala
´
n-Garcı
´
a and Juan C. Go
´
mez-Ferna
´
ndez
Departamento de Bioquı
´
mica y Biologı
´
a Molecular, Universidad de Murcia, Spain
Protein kinase C (PKC) is a family of related protein
kinases that plays an important role in regulating cell
growth. These protein kinases are involved in several
intracellular pathways that end in transcription and
are considered to be potential targets for anticancer
therapy [1,2]. PKCs include at least 10 different mam-
malian isoforms that can be classified into three groups
according to their structure and cofactor regulation.
The first group includes the classical PKC isoforms (a,
bI, b II and c), which are regulated by acidic phospho-
lipids, diacylglycerol, phorbol esters and also by cal-
cium. The second group corresponds to the novel PKC
isoforms (d, e, g and h), which are regulated by phos-
pholipids, diacylglycerols and phorbol esters but not
by calcium. The third group comprises the atypical
PKC isoforms (f, s ⁄ L and l), which are not regulated
Keywords
2D-correlation; catalytic domain; FTIR;
protein kinase C; protein structure
Correspondence
J. C. Go
´
mez-Ferna
´
ndez, Departamento de
Bioquı
´
mica y Biologı
´
a Molecular (A),
Facultad de Veterinaria, Universidad de
Murcia, Apartado de Correos 4021,
E-30080 Murcia, Spain
Fax: +34 968 36 4766
Tel: +34 968 36 4766
E-mail:
*Present address
Biomedical Research and Study Centre,
University of Latvia, Riga, Latvia
(Received 27 January 2006, revised 22 May
2006, accepted 23 May 2006)
doi:10.1111/j.1742-4658.2006.05338.x
The secondary structure of the catalytic domain from protein kinase C f
was studied using IR spectroscopy. In the presence of the substrate
MgATP, there was a significant change in the secondary structure. After
heating to 80 °C, a 14% decrease in the a-helix component was observed,
accompanied by a 6% decrease in the b-pleated sheet; no change was
observed in the large loops or in 3
10
-helix plus associated loops. The maxi-
mum increase with heating was observed in the aggregated b-sheet compo-
nent, with an increase of 14%. In the presence of MgATP, and compared
with the sample heated in its absence, there was a substantial decrease in
the 3
10
-helix plus associated loops and an increase in a-helix. Synchronous
2D-IR correlation showed that the main changes occurred at 1617 cm
)1
,
which was assigned to changes in the intermolecular aggregated b-sheet of
the denaturated protein. This increase was mainly correlated with the
change in a-helix. In the presence of MgATP, the main correlation was
between aggregated b-sheet and the large loops component. The asynchro-
nous 2D-correlation spectrum indicated that a number of components are
transformed in intermolecularly aggregated b-sheet, especially the a-helix
and b-sheet components. It is interesting that changes in 3
10
-helix plus
associated loops and in a-helix preceded changes in large loops, which sug-
gests that the open loops structure exists as an intermediate state during
denaturation. In summary, IR spectroscopy revealed an important effect of
MgATP on the secondary structure and on the thermal unfolding process
when this was induced, whereas 2D-IR correlation spectroscopy allowed us
to show the establishment of the denaturation pathway of this protein.
Abbreviations
cat-f, catalytic domain from PKCf; PKC, protein kinase C; PKCf-kn, kinase-defective dominant-negative form of PKCf; PS, pseudosubstrate;
PtdInsP
3
, phosphatidylinositol 3,4,5-triphosphate.
FEBS Journal 273 (2006) 3273–3286 ª 2006 The Authors Journal compilation ª 2006 FEBS 3273
by diacylglycerol or by calcium [3,4] but are directly or
indirectly activated by phosphatidylinositol 3,4,5-tris-
phosphate (PtdInsP
3
) [5,6] and other lipids, such as
ceramides and arachidonate [7], and phosphatidic acid
[8]. Like other atypical isoenzymes, PKCf, consists of
four functional domains and motifs, including a PB1
domain in the N-terminus, a pseudosubstrate (PS)
sequence, a C1 domain of a single Cys-rich zinc-finger
motif, and a kinase domain in the C-terminus. The
catalytic region is relatively similar to those of the
remaining PKC isoenzymes, although their regulatory
regions are clearly different because they do not have
a C2 domain and the C1 domain is atypical with
respect to the classical and novel isoenzymes and is
not sensitive to diacylglycerol or phorbol esters.
The kinase domain of PKCf, as well as other mem-
bers of the AGC group, includes an MgATP-binding
region, an activation loop, a turn motif and a hydro-
phobic motif. The MgATP-binding region contains a
Lys residue, Lys281, which is crucial for its kinase
activity. A mutant whose Lys281 is substituted by
other amino acids is usually used as a kinase-defective
dominant-negative form of PKCf (PKCf-kn). Whereas
classical and novel isoforms of PKC have three phos-
phorylation sites localized in the activation loop, the
turn motif and the hydrophobic motif, PKCf has only
two phosphorylation sites, namely residues T410 (in
the activation loop) and T560 (in the turn motif) which
are phosphorylated upon activation [9,10]. However,
no phosphorylated residue has been detected in the
hydrophobic motif of the atypical PKCs [11].
PKCs have been shown to play an essential role in a
wide range of cellular functions including mitogenic
signalling, cytoskeleton rearrangement, glucose meta-
bolism, differentiation, and the regulation of cell survi-
val and apoptosis [12–15]. Many of these cellular
functions are related to human diseases and PKC
inhibitors are currently being used in clinical trials for
various types of cancer, and a PKCb inhibitor is being
used in trials for diabetes-related retinopathy [16].
PKCf is a member of the atypical PKC subfamily
and has been widely implicated in the regulation of cel-
lular functions. Increasing evidence from studies using
in vitro and in vivo systems points to PKCf as a key
regulator of the critical intracellular signalling path-
ways that are induced by various extracellular stimuli,
and this enzyme has been implicated in several types
of cancer [11,17]. For this reason it is of great interest
to study the structure of the catalytic domain of PKCf
and its interaction with substrates.
To date, no full structure of a complete PKC iso-
form, at an atomic resolution level, has been described,
although the structures of isolated regulatory domains
of some classical and novel PKC isoenzymes are
known, and the structure of the catalytic domain of an
atypical PKC (PKCi) has recently been reported [18].
The overall structure exhibits the classical bilobal kin-
ase fold, with both phosphorylation sites (Thr403 in
the activation loop and Thr555 in the turn motif) well
defined in the structure, and forming intramolecular
ionic contacts. These make an important contribution
to stabilizing the active conformation of the catalytic
subunit. The structure of the first catalytic domain of
a novel PKC, as PKCh is, has also been recently
solved at high resolution [19].
In this study we used IR spectroscopy to study the
secondary structure of the catalytic domain of PKCf
and the effect of its substrate, MgATP, and also to
study the effect of thermal unfolding in the presence
and the absence of MgATP. We used 2D correlation
spectroscopy to gain information into the correlation
between different elements of the secondary structure
during denaturation. The results showed an important
effect of MgATP on the secondary structure and on
the thermal unfolding process when this was induced.
Results
Information on the secondary structure of the catalytic
domain from PKCf (cat-f) was obtained by analysis of
the IR amide I band, located between 1700 and
1600 cm
)1
and arising mainly from the C ¼ 0 stretch-
ing vibration of the peptidic bond. This band is con-
formationally sensitive and can be used to monitor
either the secondary structure composition or changes
induced in the protein by external agents [20]. Spectra
were obtained using H
2
O and D
2
O buffers, and the
spectra shown were obtained by subtracting the spectra
of buffers and ligands (like MgATP) from those of
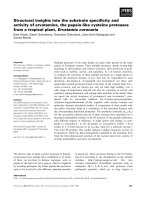
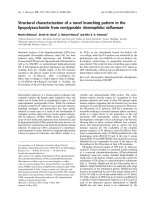
samples containing protein. Figure 1A shows the dif-
ference spectra of cat-f in the presence of D
2
O buffer
(5 mgÆmL
)1
). The spectra of protein samples, prepared
in D
2
O buffer, are also shown at 80 ° C, and in the
presence of the enzyme substrate MgATP at 25 and
80 °C.
To better appreciate the effect of heating on the pro-
tein structure, difference spectra were obtained by
spectra subtraction (Fig. 1A). More specifically,
Fig. 1B shows the difference between the spectrum of
cat-f obtained in D
2
O buffer at 25 °C and the same
sample at 80 °C. It can be seen that heating induced a
very substantial increase at 1616 and 1683 cm
)1
, and
a very substantial decrease in the region 1660–
1630 cm
)1
, with a maximum within this region, at
1657 cm
)1
. The meaning of these variations is dis-
cussed below. Also interesting was the effect of heating
Structure of catalytic domain from PKCf S. Sa
´
nchez-Bautista et al.
3274 FEBS Journal 273 (2006) 3273–3286 ª 2006 The Authors Journal compilation ª 2006 FEBS
in the presence of MgATP, which can be seen after
obtaining the spectrum of cat-f at in D
2
O buffer at
25 °C and subtracting the spectrum of the same sample
at 80 °C. Figure 1C shows a very considerable increase
upon heating at 1616 and 1683 cm
)1
, whereas a
decrease was observed in the region 1660–1630 cm
)1
although, unlike the situation in the absence of
MgATP, the maximum was now located at 1640 cm
)1
.
This indicated that the different types of secondary
structure were not equally protected from denaturation
by the presence of MgATP, as is shown in detail after
decomposition of the amide I band.
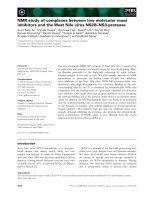
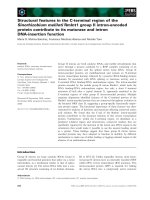
Figure 2 shows the spectrum obtained in H
2
O buffer
in the absence of ligands at 25 °C (20 mgÆmL
)1
). In
order to decompose the amide I band, the number and
initial positions of the component bands were obtained
from band-narrowed spectra by derivation (Fig. 2B).
Amide I band decomposition of cat-f H
2
Oat25°Cis
shown in Fig. 2C. The corresponding parameters, i.e.
band position, percentage area and assignment, are
shown in Table 1.
The spectrum in H
2
O showed seven components in
the amide I region. The main component, which
accounted for 43% of the total band area, was locali-
zed at 1657 cm
)1
and can be assigned to an a-helix
although it may also arise from a disordered structure
[20]. Because these two types of structure are not dis-
tinguished when using H
2
O buffer, it is convenient to
inspect the spectrum obtained in D
2
O buffer. The
component found at 1631 cm
)1
(14%) can be assigned
to a b structure [20]. The components appearing at
1672 cm
)1
(9%), 1681 cm
)1
(7%) and 1691 cm
)1
(3%)
may arise from b-turns [21,22], although the last two
may also arise in part from b-sheet [20,23]. Another
component was located at 1641 cm
)1
(19%) and can
be assigned to loops or a 3
10
-helix [23]. However, tak-
ing into account the spectrum decomposition of the
amide I¢ band obtained in D
2
O buffer, as shown
below, we assigned it to both. Finally, another compo-
nent band appeared at 1622 cm
)1
(5%). This has usu-
ally been attributed to peptides in an extended
configuration with a hydrogen-bonding pattern formed
by peptide residues not taking part in the intramolecu-
lar b-sheet, but rather hydrogen-bonded to other
molecular structures [20,24,25]. Nevertheless, this fre-
quency when associated with another peak at
1693 cm
)1
, both in H
2
O and D
2
O, has been attributed
to b-hairpin [26]. Note that we observed a band at
1691 cm
)1
(Table 1), and it might be possible to assign
this component to b-hairpin at 25 °C. It should also
be noted that the area located between 1600 and
1615 cm
)1
, which corresponds to contributions of ami-
noacyl side chains, was not taken into account.
When spectra were obtained in the presence of D
2
O
buffer for a sample of cat-f at 25 °C (Fig. 1A) it was
seen that the amide II band observed in samples pre-
pared in the presence of H
2
O buffer and centred
at 1560 cm
)1
decreased very considerably as a
∆
Abs
1800 1750 1700 1650 1600 1550 15001800 1750 1700 1650 1600 1550 1500
-0.03
-0.02
-0.01
0.01
0.00
-0.03
-0.02
-0.01
0.01
0.00
1800 1750 1700 1650 1600 1550 1500
1640
1683
1616
1800 1750 1700 1650 1600 1550 1500
1683
1657
1616
a
b
c
d
AB
C
Fig. 1. FTIR spectra of cat-f in D
2
O buffer at
25 °C. The protein concentration was
5mgÆmL
)1
(105 lM). The increase in absorb-
ance units (DAbs) was 0.04. (A) FTIR
spectra in the range between 1800 and
1500 cm
)1
, where the amide I¢ and amide II
regions can be observed for (top to bottom)
cat-f at 25 °C (a), cat-f at 25 °C plus 1 m
M
MgATP (b), cat-f at 80 °C (c) and cat-f at
80 °C in the presence of 1 m
M MgATP (d).
In all cases, the spectrum shown was
obtained by subtracting the buffer spectrum,
which also contained MgATP in cases (b)
and (d). (B) The difference spectrum
obtained by subtracting (c) from (a). (C) The
difference spectrum obtained by subtracting
(d) from (b). In order to obtain difference
spectra (B) and (C) subtraction of the two
absorption spectra was performed by using
a factor that led to the 1700–1600 cm
)1
interval (amide I) having the same positive
and negative area.
S. Sa
´
nchez-Bautista et al. Structure of catalytic domain from PKCf
FEBS Journal 273 (2006) 3273–3286 ª 2006 The Authors Journal compilation ª 2006 FEBS 3275
consequence of the use of D
2
O buffer. This is the con-
sequence of the H–D exchange that takes place when
using D
2
O buffer, a range of that was quantified using
two different procedures. The first implied calculating
the ratio between the areas of the amide II and ami-
de I bands [27] when the exchange was found to be
83.8% in the presence of D
2
O buffer. This percentage
seems to be related to maximum exchange because,
after heating at 80 °C, i.e. after thermal denaturation,
the percentage exchange increased, but only very
slightly to 85.7%. Similar percentages were also
obtained in the presence of MgATP. The second pro-
cedure consisted of obtaining the ratio between the
absorbance values at 1550 (amide II) and at
1515 cm
)1
, which corresponds to tyrosine (Fig. 1A).
The band at 1515 cm
)1
was used to normalize the data
because it was not affected by the H–D exchange [28].
The ratios obtained from the samples studied in D
2
O
buffer were then compared with those obtained in the
presence of H
2
O buffer. The results were very similar
to those found using the first procedure with a percent-
age exchange of 89.8% at 25 °C and 93.3% at 80 °C,
confirming that heating at 80 °C did not appreciably
enhance H–D exchange. Similar percentages were also
obtained when this procedure was used in the presence
of MgATP.
The amide I¢ band of cat-f in D
2
Oat25°C was
decomposed using the same procedure described above
for samples in the presence of H
2
O buffer (Fig. 2). The
corresponding parameters, i.e. band position, percent-
age area and assignment, are shown in Table 1. The
spectra in D
2
O showed eight component bands in the
1700–1600 cm
)1
region and the quantitative contribu-
tion of each band to the total amide I¢ contour was
obtained by band curve fitting of the original spectra.
The major component in the amide I¢ region appears
at 1658 cm
)1
(27%), which can be assigned to a-helix
[20,23,29,30] and is separated from a component
appearing in this D
2
O buffer at 1648 cm
)1
(16%),
which has been attributed to large open loops, i.e. fully
hydrated, not interacting with proximate amide func-
tional groups [20,23].
The high-frequency components at 1669 cm
)1
(8%),
1679 cm
)1
(6%) and 1689 cm
)1
(1%) can be assigned to
b-turns and the last two also partially to b-sheet [23]. It
was predicted that the high-frequency component inten-
sity is less than 1 ⁄ 10th that of the low-frequency band,
appearing at 1631 cm
)1
, and amounting to 17% [31].
The high-frequency components are attributed to the
antiparallel b-sheet structure [30,32] appearing at 1679
and 1689 cm
)1
in D
2
O buffer and 1681 and 1691 cm
)1
H
2
O. The component appearing at 1622 cm
)1
(7%) was
not shifted by the H–D exchange, which is compatible
with its origin in intermolecular b-sheet or from b-hair-
pin. Finally, the 1641 cm
)1
component was shifted only
1cm
)1
with respect to that observed in H
2
O buffer,
strongly suggesting that it arises from a 3
10
-helix or per-
haps from associated loops which therefore have a low
accessibility to D
2
O exchange.
A
1700 1680 1660 1640 1620 1600
Wavenumber (cm
-1
)
B
1700 1680 1660 1640 1620 1600
Wavenumber (cm
-1
)
∆Abs
C
0,00
0,02
0,04
0,06
0,08
0,10
0,12
0,14
1400 1800 1750 1700 1650 1600 1550 1500
1450
Wavenumber (cm
-1
)
Fig. 2. FTIR spectra of cat-f in H
2
O buffer at 25 °C. The protein
concentration was 20 mgÆmL
)1
(421 lM). The vertical bar (DAbs)
represents 0.05 absorbance units. (A) FTIR difference spectrum
obtained by subtracting the spectrum of the solvent from the spec-
trum of the protein in the same solvent, in the range 1800–
1500 cm
)1
, where the amide I and amide II regions can be
observed. (B) Second derivative of the FTIR spectrum of this sam-
ple. (C) FTIR spectrum (solid line) in the amide region with the
fitted component bands. The parameters corresponding to the
component bands are shown in Table 1. The dashed line repre-
sents the curve-fitted spectrum, i.e. the dotted line is the sum of
the individual components.
Structure of catalytic domain from PKCf S. Sa
´
nchez-Bautista et al.
3276 FEBS Journal 273 (2006) 3273–3286 ª 2006 The Authors Journal compilation ª 2006 FEBS
To be activated, PKCf, must be phosphorylated in
the catalytic domain [11]. We verified that cat-f was
phosphorylated from the observation that the PO
2
–
double-bond asymmetric stretching band appeared at
1244 cm
)1
[33] in the spectrum taken in H
2
O buffer
and in the total absence of MgATP (not shown for the
sake of brevity).
When the effect of ligands such as the pseudosub-
strate peptide (see Experimental procedures) and
MgATP on the secondary structure of cat-f was tested,
only MgATP induced changes in the secondary struc-
ture, an observation that can be considered significant.
Table 1 shows that in D
2
O buffer the presence of
MgATP induced a 4% decrease in the a-helix structure
appearing at 1659 cm
)1
, which decreased to 23%, and
a 7% decrease in the component assigned to 3
10
-helix
plus associated loops at 1640 cm
)1
, which decreased to
11%. However, the component absorbing at
1648 cm
)1
(attributed to open loops) increased to 23%
(a 7% increase), whereas in the b-sheet component at
1631 cm
)1
it reached 23% (a 6% increase). It seems,
then, that this substrate was able to modulate the sec-
ondary structure significantly.
To gain further insight into the structure and folding
of cat-f and into the structural changes that occur dur-
ing MgATP binding, thermal-stability studies were per-
formed. The FTIR spectrum of cat-f in D
2
O buffer
revealed major changes in the amide I¢ mode at 80 °C
(Fig. 1A, Table 1). These included a broadening of the
overall amide I¢ contour and an increase in the area
under the component at 1620–1621 cm
)1
, which
reached 21% (a 14% increase). This can be attributed
to b-sheet with intermolecular bonds, which is charac-
teristically important in thermally denatured proteins
[32,34]. This component indicates that extended struc-
tures were formed by aggregation of the unfolded pro-
teins produced as a consequence of irreversible thermal
denaturation [34–36]. The increase in the components
contrasted with a decrease in the a-helix component
appearing at 1657–1658 cm
)1
, which decreased to 13%
(a decrease of 14%), and the b-pleated sheet, centred
at 1631–1632 cm
)1
which decreased to 11% (a decrease
of 6%; Table 1). These observations agreed with the
difference spectrum shown in Fig. 1B. The components
appearing at 1648–1649 and 1640 cm
)1
(attributed to
large open loops and 3
10
-helix plus associated loops,
respectively) did not change significantly.
The presence of MgATP during the heating process
did not prevent an increase in the area of the compo-
nent considered characteristic of denaturated proteins,
at 1621 cm
)1
, which continued to be 21% (Table 1),
and prevented changes in several other components.
Of note is the fact that, with respect to the situation at
25 °C, and in the presence of MgATP, the a-helix
component appearing at 1655–1659 cm
)1
represented
18% of the total area, hence the decrease was only 5%
(Table 1). In contrast, the 3
10
-helix plus associated
loops component (1639–1640 cm
)1
) did not change sig-
nificantly. The b-pleated sheet (1631–1632 cm
)1
) also
suffered a substantial decrease to 10% (a 13%
decrease), whereas the component at 1647–1648 cm
)1
attributed to exposed loops also decreased to 15%
(representing a decrease of 8%). Again, these changes,
including the preservation of the a-helix component in
the presence of MgATP, agreed quite well with the dif-
ference spectrum shown in Fig. 1C.
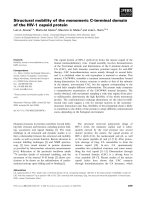
Figure 3 shows a plot of the half-height width of the
amide I¢ band versus temperature, which is one way of
Table 1. FTIR parameters of the amide I band components of cat-f (20 mgÆmL
)1
)inH
2
O buffer or cat-f (5 mgÆmL
)1
)inD
2
O buffer at 25 *C
and in the absence or presence of ATP.
H
2
O(25°C) D
2
O(25°C) D
2
O+ATP (25 °C) D
2
O(80°C) D
2
O+ATP (80 °C)
Assignment
position
a
(cm
)1
)
area
b
(%)
position
(cm
)1
)
area
(%)
position
(cm
)1
)
area
(%)
position
(cm
)1
)
area
(%)
position
(cm
)1
)
area
(%)
b-turns+ b-sheet 1691 3 1689 1 1688 1 1680 8 1681 6
b-turns+ b-sheet 1681 7 1679 6 1678 7 1667 13 1673 6
b-turns 1672 9 1669 8 1669 7 1664 11
b-turns 1657 13 1655 18
a-helix 1657 43 1658 27 1659 23 1649 16 1647 15
Open loops
3
10
-helix + associated loops 1641 19
1648
1640
16
18
1648
1640
23
11
1640
1632
18
11
1639
1632
13
10
b-sheet 1631 14 1631 17 1631 23 1620 21 1621 21
Intermolecular b-sheet
+ b-hairpins
1622 5 1622 7 1621 5
a
Peak position of the amide I band components.
b
Percentage area of the amide I band components. The area corresponding to side chain
contributions located at 1600–1615 cm
)1
has not been considered.
S. Sa
´
nchez-Bautista et al. Structure of catalytic domain from PKCf
FEBS Journal 273 (2006) 3273–3286 ª 2006 The Authors Journal compilation ª 2006 FEBS 3277
following protein denaturation [29]. As can be seen,
the onset of widening occurred at 40 °C in the absence
of MgATP, but shifted to 50 °C in the presence of
MgATP, indicating a protective effect by the substrate.
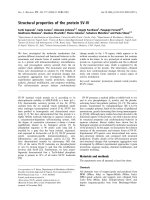
In order to better visualize the changes taking place
during thermal denaturation, 3D spectra were con-
structed (Fig. 4). When the cat-f spectra obtained in
the absence (Fig. 4A) and in the presence (Fig. 4B) of
MgATP were compared the widening of the overall
amide I¢ contour was less in the presence of MgATP
and the aggregation-indicative band at 1618 cm
)1
could be clearly visualized.
2D-IR correlation studies
The above thermal profiles and curve-fittings cannot
provide information on the interactions between the
secondary-structure elements that give rise to the
observed changes. Such interactions can, however, be
monitored in detail using 2D-IR correlation spectros-
copy. In a synchronous 2D map, peaks located along
the diagonal (autopeaks) correspond to changes in
intensity induced, in this case, by temperature, and
they are always positive. Cross-correlation (nondiago-
nal) peaks indicate an in-phase relationship between
the two bands involved, i.e. that two vibrations of the
protein, characterized by two different wave numbers
(m
1
and m
2
) are being affected simultaneously [37]. A
deeper insight into the mechanism of protein unfolding
and the role of the different ligands was therefore
obtained using 2D-IR correlation spectroscopy, a tech-
nique that we have previously used to study the ther-
mal unfolding of C2 domains from classical PKCs [38]
and also the full PKCa [39]. In all cases, the average
spectra of the temperature scans from 25 to 80 °C were
used as reference in the analysis.
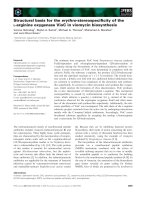
The synchronous 2D-IR correlation contour map of
cat-f in the absence of MgATP, corresponding to heat-
ing from 25 to 80 °C ( Fig. 5A), shows two autopeaks
Fig. 3. Half-height bandwidth of the amide I¢ region of the FTIR
spectra in cm
)1
as a function of temperature from 25 to 80 °C for
the cat-f in D
2
O buffer in the absence (s) or the presence of 1 mM
MgATP (d).
AB
Fig. 4. Deconvolved FTIR spectra of cat-f in the amide I¢ region (1700–1600 cm
)1
) as function of temperature from 25 to 80 °C in the
absence (A) or presence (B) of 1 m
M MgATP. The protein concentration was 5 mgÆmL
)1
(105 lM). The bands indicating aggregation (1618
and 1680 cm
)1
) are shown. The increase of absorbance units (DAbs) was 0.04.
Structure of catalytic domain from PKCf S. Sa
´
nchez-Bautista et al.
3278 FEBS Journal 273 (2006) 3273–3286 ª 2006 The Authors Journal compilation ª 2006 FEBS
located at 1617 and 1657 cm
)1
, indicating that these
are the frequencies at which the main changes take
place during the thermally induced unfolding of the
protein. The most intense cross-peaks were observed at
the same frequencies (1617–1657 cm
)1
) and were neg-
ative, indicating that during the heating process one
increased as the other decreased. Less intense, but
informative, cross-peaks were observed correlating
1684 and 1659 cm
)1
. These were negative, indicating
that the other component associated with denaturation
also increased, whereas the a-helix decreased; however,
quantitatively, this peak was smaller. In addition, pos-
itive cross-peaks were also observed correlating 1617
and 1684 cm
)1
, indicating that these two components,
which are associated during denaturation, were syn-
chronized. These observations are fully consistent with
the IR spectroscopic studies described above, emphasi-
zing that the disappearance of the a-helix component
is associated with the appearance of the intermolecu-
larly aggregated b-sheet.
When the correlation was made in the presence of
MgATP (Fig. 5B), there was a significant change in
the synchronous contour map because the autopeaks
were now centred at 1617 and 1648 cm
)1
, indicating
that the component which decreased due to denatura-
tion was now the one assigned to large open loops.
Negative cross-peaks correlated 1617 and 1652 cm
)1
,
indicating correlation between the decrease in this
lower frequency a-helix or open loops and the increase
in intermolecularly aggregated b-sheet. The correlation
observed at 1652 cm
)1
, a frequency at which no com-
ponent was found during amide I¢ decomposition, may
indicate that spectral widening is taking place [40], as
occurs during denaturation. Finally, a small positive
peak correlated 1617 and 1684 cm
)1
, and this again
may be interpreted as the simultaneous increase in
these two components, both of which are associated
with protein denaturation.
The asynchronous 2D-IR correlation contour maps
of cat-f in the absence and presence of MgATP due to
the thermal denaturation from 25 to 80 °C are shown
in Fig. 6. Figure 6A shows the results in the absence
of MgATP and reveals a number of correlations
between 1614 and 1616 cm
)1
and several other compo-
nents. There is a correlation cross-peak at 1614–
1683 cm
)1
with a negative sign, indicating that the
increase at 1683 cm
)1
preceded that at 1614 cm
)1
. The
correlation cross-peak at 1614–1659 cm
)1
is positive,
but was found in an area with a negative sign in the
corresponding synchronous map, so that the change at
1659 cm
)1
occurred before that at 1614 cm
)1
. Similar
situations occurred with the correlation cross-peak
located at 1614–1649 cm
)1
, which had a positive sign,
meaning that the change at 1649 cm
)1
preceded that at
1614 cm
)1
, and with the correlation cross-peak at
1614–1642 cm
)1
, the change at 1642 cm
)1
once again
preceding that at 1614 cm
)1
.
Other correlation asynchronous cross-peaks with
positive signs were observed, such as that correlating
1653 and 1684 cm
)1
, indicating that the change at
1653 preceded that at 1684 cm
)1
, and the cross-peak
correlating 1642 and 1653 cm
-1
, such that the change
A
Wavenumber (cm
-1
)
rebmu
nev
aW
m
c(
-1
)
1600
1620
1640
1660
1680
1700
160016201640166016801700
B
r
e
bmuneva
Wm
c(
-
1
)
Wavenumber (cm
-1
)
1600
1620
1640
1660
1680
1700
160016201640166016801700
Fig. 5. Synchronous 2D-IR correlation spectra of the catalytic domain from PKCf (cat-f)inD
2
O buffer as a function of temperature variation
between 25 and 80 °C in the absence (A) or presence (B) of ATP 1 m
M. Correlation spectra were obtained using the 2D-POCHA program.
White and dark peaks are positive and negative peaks, respectively.
S. Sa
´
nchez-Bautista et al. Structure of catalytic domain from PKCf
FEBS Journal 273 (2006) 3273–3286 ª 2006 The Authors Journal compilation ª 2006 FEBS 3279
in the component at 1642 cm
)1
occurred before that at
1653 cm
)1
. Finally, there was a peak signalling a cor-
relation between 1653 and 1658 cm
)1
, which has a neg-
ative sign and therefore indicates that the change at
1658 cm
)1
precedes that at 1653 cm
)1
. The butterfly
form of these correlation peaks indicates the existence
of a shift in frequencies associated with denaturation,
so that the a-helix component is being transformed in
the large open loops structure occurring at 1648 cm
)1
.
In the presence of MgATP (Fig. 6B) the asynchro-
nous correlation map again correlates the 1617 cm
)1
component with 1658, 1647 and 1640 cm
)1
, all with a
positive sign, although the corresponding area in the
synchronous map was negative. Therefore, changes at
1617 cm
)1
occurred after changes in the other compo-
nents, probably indicating that all decrease during
denaturation, leading to the appearance of the
1617 cm
)1
component associated with intermolecularly
aggregated b-sheet.
Discussion
The structure of PKCf is not entirely known, nor is
structure of its catalytic domain. However, two cata-
lytic domains from other PKCs have been determined
at high resolution, that of PKCi [18] (PDB code
1ZRZ) and that of PKCh [19] (PDB code 1XJD),
although this has been only partially determined
because the structure of 282 residues of a total of 344
have been solved [19]. The catalytic domain of PKCh
possesses a high degree of homology ( 80%) with the
catalytic domain of other isoforms of PKC belonging
to the classical or novel subfamilies. However, the per-
centage identity between the catalytic domain of PKCh
and cat-f is considerably lower (44%). It should be
noted that the percentage sequence identity of cat-f
with other kinases and with the catalytic domain of
cAMP-activated protein kinase [41] (PDB code 1J3H)
is only slightly lower, amounting to 39%. In the case
of the catalytic domain of PKB [42] (PDB code
1MRV), the homology with cat-f is 48%, It is notice-
able that for the catalytic domain of PKCi, the degree
of sequence homology with that of PKCf is 84%,
which is a consequence of the very early separation of
the branch of the atypical PKCs from other protein
kinases in the evolutionary tree [43].
It is, however, striking that, besides the lack of
sequence homology, there is remarkable analogy in the
3D structures. The structure of the catalytic domain of
PKCi [18] is similar to that of PKCh [19] which, in
turn, is similar to those of PKB [42] (PDB code
1MRV) and PKA [41] (PDB code 1J3H), formed by
two lobes, a small N-lobe and a bigger C-lobe.
MgATP binds between both lobes and establishes
polar interactions with residues located in other lobes.
We studied the secondary structure of the catalytic
domain of PKCf, its denaturation properties and the
effect of its substrate, MgATP, on the structure and
denaturation properties. Comparison of the structure
in H
2
O buffer and D
2
O buffer facilitated assignment
of the various components detected using band-nar-
rowing and band-fitting techniques. At 25 °C it was
160016201640166016801700
1600
1620
1640
1660
1680
1700
rebmuneva
W
mc
(
-1
)
Wavenumber (cm
-1
)
AB
rebmunevaWmc(
-1
)
Wavenumber (cm
-1
)
160016201640166016801700
1600
1620
1640
1660
1680
1700
Fig. 6. Asynchronous 2D-IR correlation spectra of the catalytic domain from PKCf (cat-f)inD
2
O buffer as a function of temperature variation
between 25 and 80 °C in the absence (A) or presence (B) of 1 m
M MgATP. Correlation spectra were obtained using the 2D-POCHA program.
White and dark peaks are positive and negative peaks, respectively.
Structure of catalytic domain from PKCf S. Sa
´
nchez-Bautista et al.
3280 FEBS Journal 273 (2006) 3273–3286 ª 2006 The Authors Journal compilation ª 2006 FEBS
concluded that the secondary structure included two
types of helix, an a-helix absorbing at 1658 cm
)1
and
another whose presence may be inferred from the com-
ponent absorbing at 1640 cm
)1
to be an 3
10
-helix. In
addition, it should be noted that two types of loops
may be present, one corresponding to open large loops
which suffer a large frequency shift in the presence of
D
2
O (from 1657 to 1648 cm
)1
) and the other corres-
ponding to the component absorbing at 1640–
1641 cm
)1
, which hardly shifted when exposed to D
2
O
buffer. These assignments are compatible with the
information available for other catalytic domains from
protein kinases, such as cAMP-dependent protein kin-
ase [41], PKB [44] or PKCi [18] and all contain 3
10
-
helix. However, the percentage of 3
10
-helix in all these
catalytic domains, which are analogous to that of
PKCf,is 3–4% (Table 2) and so a substantial part
of the 18% found in the sample at 25 °C (in the
absence of MgATP) for the component centred at
1640 cm
)1
(Table 1) can be assigned to loops, because
there is a very small shift due to D
2
O buffer (only
1cm
)1
), these loops must be interacting either with
themselves or with other structures.
A number of authors have previously assigned com-
ponents absorbing at 1640–1643 cm
)1
in D
2
Oto3
10
-
helices, for example, in the cases of cytochrome b
5
[45], alpha lactalbumin [46], streptokinase [23], short
alanine-based peptides [47] and cytochrome P-450 [48]
among others. Components absorbing at 1640–
1643 cm
)1
in D
2
O have also been assigned to loops in
streptokinase [23], photosystem II reaction centre [49]
or acetylcholinesterase [50]. The spectrum in H
2
O
suggests that these loops are not very accessible to the
solvent.
Comparison of the secondary structure of PKCf
with those of other protein kinases of the AGC family
(Table 2) offers other interesting data. The secondary
structure of PKCi, as deduced from the published 3D
structure [18], is very similar to that of PKCf, as con-
cluded from our IR work, and although this is not
unexpected given the high sequence homology, it lends
weight to the reliability of IR-spectroscopy. Also of
note, is the relatively high similarity in secondary
structure observed for PKB and PKA with respect to
PKCf.
An interesting aspect of the catalytic domains of
PKCh is that it has been reported to possess four
b-hairpins (see structure with PDB code 1XJD),
whereas the structure of PKCi also showed four
b-hairpins, amounting to 7% of the total [18]
(PDB code 1ZRZ). The 1622 cm
)1
component, which
is usually attributed to peptides in intramolecular
hydrogen bonding [20,24,25], has also been assigned
to b-hairpin when associated with another peak at
1693 cm
)1
in both H
2
O and D
2
O [26]. Note that the
band at 1691 cm
)1
(Table 1) supports the occurrence
of a b-hairpin structure. Whatever the case, the
observed increase in this component upon heating
may be attributed to the formation of intermolecular
hydrogen bonded b-sheet which is associated with
this process.
As mentioned above, thermal denaturation produced
an increase in the 1620 cm
)1
component, implying an
increase in the width of the amide I¢ band, although
the main loss was observed in the 1657 cm
)1
compo-
nent. It is of note that the widening of the amide I¢
band (Fig. 3) is not so pronounced as in other pro-
teins, probably because the denaturation process is not
very cooperative, at least between 40 and 60 °C. These
changes were clearly revealed by the synchronous 2D
correlation map, which indicated that the decrease in
a-helix correlated with the increase in intermolecular
hydrogen-bonded b-pleated sheet.
The asynchronous 2D correlation spectrum is com-
patible with the transformation of the secondary struc-
ture, so that a number of components are transformed
into intermolecularly aggregated b-sheet, especially the
a-helix and 3
10
-helix plus associated loops and the
b-sheet components.
Note that during thermal unfolding changes in 3
10
-
helix plus associated loops and in the a-helix preceded
changes in the open large loops absorbing at
1648 cm
)1
. These open loops act as an intermediate
state preceding aggregated b-sheet, which may be cor-
related with the fact that during thermal unfolding
there is no change in the percentage corresponding to
large open loops, whereas there is a decrease in a-helix
and in the component assigned to 3
10
-helix plus associ-
ated loops and an increase in aggregated b-sheet. It
may be concluded that large loops aggregate to give
intermolecularly aggregated b-sheet, although this is
Table 2. Comparison of the secondary structure of PKCf with
those from other protein kinases of the AGC family. The structures
of protein kinases were taken from: PKA [41] (PDB code 1J3H),
PKB inactive, i.e. apoenzyme [42] (PDB code 1MRV), PKB active,
i.e. complexed with AMPPNP [44] (PDB code 1O6K); PKCi [18]
(PDB code 1ZRZ and PKCf (our data of the sample in D
2
Oat25°C
without Mg
2
± ATP). ND, not determined.
PKA
PKB
inactive
PKB
active PKCi PKCf
a-helix 31.4 21.1 28.3 25.6 27.0
b-pleated sheet 14.0 13.0 15.2 13.7 17.0
3
10
-helix 3.4 4.4 2.7 3.3 ND
b-turns 15.2 13.9 17.0 13.2 15.0
S. Sa
´
nchez-Bautista et al. Structure of catalytic domain from PKCf
FEBS Journal 273 (2006) 3273–3286 ª 2006 The Authors Journal compilation ª 2006 FEBS 3281
simultaneously formed from the other two components
and a steady-state is reached with respect to its per-
centage.
The effect of the substrate MgATP on cat-f is
very interesting because it induced changes in the
secondary structure. In its presence there was an
increase in the open large loops absorbing at
1648 cm
)1
, and a considerable decrease in the
3
10
-helix plus associated loops possibly indicating
changes in the tertiary structure which may impede
interaction between loops. Other changes included a
decrease in the a-helix at 1658 cm
)1
and an increase
in the b-sheet at 1631 cm
)1
. In addition, MgATP
significantly altered the denaturation pattern of cat-f
because it protected against denaturation, as revealed
by the considerable shift in the onset of widening of
the amide I¢ band. It also changed the way in which
the secondary structure was altered so that, whereas
a-helix at 1655 cm
)1
was preserved to a certain
extent, the b-sheet component decreased to a greater
extent than at 25 °C in the presence of MgATP. It
is very interesting that significant differences in sec-
ondary structure were detected when PKB in an
inactive form [42] (PDB code 1MRV) and PKB in a
complex with AMPPNP and a substrate peptide [44]
(PDB code 1O6K) were compared (Table 2). These
differences confirmed the plasticity of these proteins
and their capacity to change secondary structure as
the result of interacting with substrates, as we
observed here for PKCf.
In summary, the secondary structure of cat-f,as
observed by IR spectroscopy, is quite compatible with
that revealed using high-resolution studies of catalytic
domains from other analogous kinases. The structure
is flexible, so that it is modulated by the presence of
the substrate MgATP. During thermal unfolding 2D
correlation spectroscopy reveals the way in which the
different components transform from one into another,
with open loops preceding the formation of aggregated
b-sheets.
Experimental procedures
Materials
ATP was purchased from Roche Diagnostics (Barcelona,
Spain). Deuterated water (D
2
O) was purchased from
Aldrich Chemical Co. (Milwaukee, WI). Pseudosubstrate
inhibitor (sequence: H-Ser-Ile-Tyr-Arg-Arg-Gly-Ala-Arg-
Arg-Trp-Arg-Lys-Leu-OH) was purchased from Calbio-
chem (La Jolla, CA). Water was twice distilled and deion-
ized using a Millipore system from Millipore Ibe
´
rica
(Madrid, Spain).
Expression and purification of cat-f
Rat PKCf cDNA was a gift from Y. Nishizuka and
Y. Ono (Kobe University, Kobe, Japan). The cDNA for
PKCf (229–592) was cloned into pFastBacHTb (Invitrogen,
Barcelona, Spain) using the XhoI and KpnI restriction sites,
resulting in a fusion protein with N-terminal His-tag with
TEV cleavage site. The recombinant viruses were obtained
using standard procedures for transposition and transfec-
tion as indicated by the manufacturer (Invitrogen). Sf9
(Spodoptera frugiperda) insect cells were used. For expres-
sion, 2 · 10
6
Sf9 cellsÆmL
)1
were infected with a high titre
of recombinant baculovirus and the cells were harvested
after 60 h incubation at 28 °C. Cells were resuspended in
homogenization buffer (25 mm Tris ⁄ HCl, pH 8.0, 400 mm
KCl, 0.25% Triton X-100, 10% glycerol, 10 mm benzami-
dine, 1 mm phenylmethanesulfonyl fluoride, 10 lgÆmL
)1
trypsin inhibitor, 4 lgÆmL
)1
pepstatine, 4 lgÆmL
)1
aproti-
nine and 10 lgÆmL
)1
leupeptin). The pellet was disrupted
by sonication (6 · 10 s), and the resulting lysate was centri-
fuged at 100 000 g for 30 min. The supernatant was incuba-
ted for 1.5 h with Ni-beads, and the target protein was
eluted with an elution buffer (25 mm Tris ⁄ HCl, pH 8.0,
200 mm NaCl and 0.5 mm dithiothreitol) containing
increasing concentrations of imidazole. Most cat-f was elut-
ed in 150 mm imidazole and loaded onto the Mono Q
anion-exchange column (Mono Q 5 ⁄ 50 GL, Amersham
Biosciences, Uppsala, Sweden) and eluted with an increas-
ing salt concentration. The buffer system used was: (A)
20 mm Tris (pH 8.0), 200 mm NaCl, 5% glycerol, 0.5 mm
dithiothreitol and (B) 20 mm Tris (pH 8.0), 5% glycerol,
0.5 mm dithiothreitol and 1 m NaCl. Fractions containing
cat-f were pooled and loaded onto a Superdex-200 gel fil-
tration column (Superdex 200 10 ⁄ 300 GL; Amersham Bio-
sciences). Fractions corresponding to cat-f monomers were
collected and concentrated up to 30 mgÆmL
)1
using an
Ultrafree-30 centrifugal filter device (Millipore Inc., Bed-
ford, MA) and the concentration was determined using the
method described by Smith et al. [51]. The purity of the
sample was checked by silver staining, and it was seen to
be >95%.
Kinase activity assay
The kinase activity was measured by adding 25 ng of pro-
tein to the reaction mixture (final volume, 50 lL), which
contained 25 mm Tris ⁄ HCl, pH 7.5, 0.1 mgÆmL
)1
peptide
substrate, 100 lm [
32
P]ATP[cP] (500 000 cpmÆnmol
)1
),
5mm MgCl
2
,1mm dithiothreitol and 0.5 mm EGTA. The
reaction was started by the addition of 5 lL of the purified
cat-f. After 10 min, the reaction was stopped with 1 mL of
ice-cold 25% trichloroacetic acid and 1 mL of ice-cold
0.05% BSA. After precipitation on ice for 30 min, the pro-
tein precipitate was collected on a 2.5-cm glass filter and
washed with 10 mL of ice-cold 10% trichloroacetic acid.
Structure of catalytic domain from PKCf S. Sa
´
nchez-Bautista et al.
3282 FEBS Journal 273 (2006) 3273–3286 ª 2006 The Authors Journal compilation ª 2006 FEBS
The amount of [
32
P
i
] incorporated into the peptide was
measured using liquid scintillation counting. The linearity
of the assay was confirmed from the time course of peptide
phosphorylation over 15 min. The kinase activity measured
for the isolated cat-f was 116 nmol P
i
Æmin
)1
Æmg
)1
protein.
IR spectroscopy
Cat-f was prepared at 20 mgÆmL
)1
(420 lm)inH
2
O buffer
and at 5 mgÆmL
)1
(105 lm)inD
2
O buffer, containing in
both cases 20 mm Tris ⁄ HCl pH 8.0 (or pD 7.6), 200 mm
NaCl, 1 mm dithiothreitol and 5 mm MgCl
2
. When D
2
O
buffer was used, the protein was incubated overnight at
4 °C to maximize H–D exchange. To study the IR amide
bands of the protein in the presence of MgATP, the protein
was prepared in D
2
O buffer and mixed with the protein to
a final concentration of 1 mm.
IR spectra were recorded using a Bruker Vector 22 FTIR
spectrometer equipped with an MCT detector. Samples
were examined in a thermostated Specac 20710 cell (Specac,
Orpington, UK) equipped with CaF
2
windows and 6 lm
spacers (H
2
O buffer) or 25 lm spacers (D
2
O buffer). The
spectra were recorded after equilibrating the samples at
25 °C for 20 min in the IR cell. A total of 128 scans were
accomplished for each spectrum with a nominal resolution
of 2 cm
)1
and then Fourier transformed using a triangular
apodization function. A sample shuttle accessory was used
to obtain the average background and sample spectra. The
sample chamber of the spectrometer was continuously
purged with dry air to prevent atmospheric water vapour
obscuring the bands of interest. Samples were scanned
between 25 and 80 °Cat5°C intervals with a 5 min delay
between each scan using a circulation water bath interfaced
to the spectrometer computer. IR spectroscopy of aqueous
samples can be used to study protein structure thanks to
spectral subtraction [52]. Spectral subtraction was per-
formed interactively using the grams ⁄ 32 program (Galactic
Industries Corporation, Salem, NH). Solvent contribution
was eliminated by subtracting the pure buffer spectrum
from the protein sample spectrum, in order to maintain a
flat baseline between 2000 and 1300 cm
)1
, as described pre-
viously [32]. This procedure eliminated any possible water
contamination because the water band at 2150 cm
)1
was
abolished when using D
2
O buffers [35]. In some experi-
ments in which MgATP was also present at 1 mm concen-
tration, it was necessary to subtract the spectrum of the
buffer containing 1 mm MgATP from the spectrum con-
taining protein also. The contribution of 1 mm ATP in the
amide I before subtraction was < 3% of the total amide I
area. In order to improve curve fitting, the spectra were
then subjected to a baseline processing in the amide I or I¢
regions (1700–1600 cm
)1
), so that the extremes were rear-
ranged to a zero-absorbance level by using the ‘Adjust
baseline’ function of the grams ⁄ 32 program. Afterwards the
spectra were processed by carrying out second-derivation
according to Griffiths & Pariente [53], using grams ⁄ 32.
Derivation gave the number and position, as well as an esti-
mation of the bandwidth and the intensity of the bands
making up the amide I or I¢ region. Thereafter, curve fitting
was performed and the heights, widths and positions of
each band were optimized successively. Data treatment and
band decomposition of the original amide I or amide I¢
regions have been described previously [29,32,54]. The frac-
tional areas of the bands in the amide I or amide I¢ regions
were calculated from the final fitted band areas. It is
assumed that the extinction coefficients of the different pro-
tein components do not differ greatly and that, in any case,
the error derived from this assumption is within the range
of errors inherent to the method. The solution given by
application of the computer programs to the decomposition
of amide I band may not be the only one. Because some
restrictions are imposed, for example maintenance of the
initial band positions obtained from the second derivative
in an interval of ± 1 cm
)1
, preservation of bandwidth
within the expected limits (typically 15–20 cm
)1
in IR
spectroscopy) and agreement with theoretical boundaries
and predictions, the result is, in practice, unique.
The signal-to-noise ratio was calculated through the ratio
of intensities between the maximum of the amide I or I¢
band, at 1646 cm
)1
, and the intensity at a frequency outside
this region, where no significant absorbance takes place
like, such as 1780 cm
)1
. This was found to be 600 in all
the samples studied.
The procedure used here to quantitatively calculate the
secondary structure is usually assumed to have an error of
1% [29], and we assumed it to be 1–2%, as deduced from
the comparison of at least three independent experiments
and the repetition of the fitting procedure by three different
persons. We therefore regard as significant changes in the
structural components that are >3%.
Difference spectra were obtained by subtracting two
absorption spectra using a factor that resulted in the 1700–
1600 cm
)1
interval (amide I) having identical positive and
negative area.
2D correlation analysis was carried out using the 2d-
pocha program written by D. Adachi and Y. Ozaki (Kwan-
sei Gakuin University, Japan), which can be found at the
following website: />2D-Pocha.htm. This software can calculate the 2D correla-
tion spectroscopy proposed by I. Noda [37,55]. The maxi-
mum intensity of the whole correlation map is divided by
six, giving a contour map in which the main peak, i.e. the
one with the maximum intensity, will be surrounded by six
contour lines, whereas the rest of the peaks will show a
number of contour lines reflecting their intensities in rela-
tion to the main peak. As reviewed by Noda [37,55], the
synchronous 2D correlation spectrum of dynamic spectral
intensity variations represents the simultaneous occurrence
of coincidental changes in spectral intensities measured at
m
1
and m
2
. Correlation peaks appear at both diagonal (auto-
S. Sa
´
nchez-Bautista et al. Structure of catalytic domain from PKCf
FEBS Journal 273 (2006) 3273–3286 ª 2006 The Authors Journal compilation ª 2006 FEBS 3283
peaks) and off-diagonal peaks (cross-peaks). The asynchro-
nous spectrum of dynamic spectral intensity variations rep-
resents sequential, or unsynchronized, changes in spectral
intensities measured at m
1
and m
2
. The asynchronous spec-
trum has no autopeaks, but consists entirely of cross-peaks
located at off-diagonal positions. An asynchronous cross-
peak develops only if the intensities of two dynamic spec-
tral intensities vary out of phase with each other for some
Fourier-frequency components of signal fluctuations.
Depending on the signal of a given cross-peak in the asyn-
chronous map and on the corresponding region of the syn-
chronous map, the order of changes in the correlated
wavenumbers, m
1
and m
2
, can be defined [54]. In this way, if
m
1
> m
2
, the cross-peak (m
1
, m
2
) is positive in the asynchro-
nous map and the corresponding region of the synchronous
map is also positive, then the change in m
1
precedes the
change in m
2
. However, if the corresponding region of the
synchronous map is negative, then changes in m
2
occur
before changes in m
1
. This rule is reversed if m
1
> m
2
.
Acknowledgements
This work was supported by grants BFU2005-02482
from the Direccio
´
n General de Investigacio
´
n, Ministe-
rio de Educacio
´
n y Ciencia (Spain) and 00591 ⁄ PI ⁄ 04
from the Fundacio
´
nSe
´
neca (Comunidad Auto
´
noma
de Murcia, Spain). SSB is the recipient of a fellowship
from the Ministerio de Educacio
´
n y Ciencia (Spain).
AK and MB were Marie Curie postdoctoral Fellows
(European Commission). AT is the recipient of a post-
doctoral fellowship from the Universidad de Murcia.
SC-G belongs to the Ramo
´
n y Cajal Programme
supported by Ministerio de Ciencia y Tecnolog’a and
Universidad de Murcia. Rat PKCf cDNA was a kind
gift from Drs Nishizuka and Ono (Kobe University,
Kobe, Japan).
References
1 Hofmann J (1994) Protein kinase C isozymes as poten-
tial targets for anticancer therapy. Curr Cancer Drug
Targets 4, 125–146.
2 Mackay HJ & Twelves CJ (2003) Protein kinase C: a
target for anticancer drugs? Endocrin Relat Cancer 10,
389–396.
3 Mellor H & Parker PJ (1998) The extended protein
kinase C superfamily. Biochem J 332, 281–292.
4 Newton AC (2001) Protein kinase C: structural and
spatial regulation by phosphorylation, cofactors, and
macromolecular interactions. Chem Rev 101, 2353–
2364.
5 Nakanishi H, Brewer KA & Exton JH (1993) Activation
of the f isozyme of protein kinase C by phosphatidyl-
inositol 3,4,5-trisphosphate. J Biol Chem 268, 13–16.
6 Standaert ML, Bandyopadhyay G, Kanoh Y, Sajan MP
& Farese RV (2001) Insulin and PIP
3
activate PKC-zeta
by mechanisms that are both dependent and indepen-
dent of phosphorylation of activation loop (T410) and
autophosphorylation (T560) sites. Biochemistry 40, 249–
255.
7 Muller G, Ayoub M, Storz P, Rennecke J, Fabbro D &
Pfizenmaier K (1995) PKCf is a molecular switch in sig-
nal transduction of TNF-a, bifunctionally regulated by
ceramide and arachidonic acid. EMBO J 14, 1961–1969.
8 Limatola C, Schaap D, Moolenaar WH & van Blitters-
wijk WJ (1994) Phosphatidic acid activation of protein
kinase C-f overexpressed in COS cells: comparison with
other protein kinase C isotypes and other acidic lipids.
Biochem J 304, 1001–1008.
9 Chou MM, Hou W, Johnson J, Graham LK, Lee MH,
Chen C-S, Newton AC, Schaffhausen BS & Toker A
(1998) Regulation of protein kinase C f by PI 3-kinase
and PDK-1. Curr Biol 8, 1069–1077.
10 Le Good JA, Ziegler WH, Parekh DB, Alessi DR,
Cohen P & Parker PJ (1998) Protein kinase C isotypes
controlled by phosphoinositide 3-kinase through the
protein kinase PDK1. Science 281, 2042–2045.
11 Hirai T & Chida K (2003) Protein kinase Cf (PKCf):
activation mechanisms and cellular functions. J Biochem
(Tokyo) 133, 1–7.
12 Kampfer S, Hellbert K, Villunger A, Doppler W,
Baier G, Grunicke HH & Uberall F (1998) Transcrip-
tional activation of c-fos by oncogenic Ha-Ras in
mouse mammary epithelial cells requires the combined
activities of PKC-lambda, epsilon and zeta. EMBO J
15, 4046–4055.
13 Selbie LA, Schmitz-Peiffer C, Sheng Y & Biden TJ
(1993) Molecular cloning and characterization of PKC
iota, an atypical isoform of protein kinase C derived
from insulin-secreting cells. J Biol Chem 15, 24296–
24302.
14 Tabuse Y, Izumi Y, Piano F, Kemphues KJ, Miwa. J &
Ohno S (1998) Atypical protein kinase C cooperates
with PAR-3 to establish embryonic polarity in Caenor-
habditis elegans. Development 125, 3607–3614.
15 Sanz L, Sa
´
nchez P, Lallena MJ, Diaz-Meco MT &
Moscat J (1999) The interaction of p62 with RIP links
the atypical PKCs to NF-kappaß activation. EMBO J
18, 3044–3053.
16 Cohen P (2002) Protein kinases – the major drug targets
of the twenty-first century? Nat Rev Drug Discov 1,
309–315.
17 Moscat J & Dı
´
az-Meco MT (2000) The atypical protein
kinase Cs. Functional specificity mediated by specific
protein adapters. EMBO Report 1, 399–403.
18 Messerschmidt A, Macieira S, Velarde M, Ba
¨
deker M,
Benda C, Jestel A, Brandstetter H, Neuefeind T &
Blaesse M (2005) Crystal structure of the catalytic
domain of human atypical protein kinase C-iota reveals
Structure of catalytic domain from PKCf S. Sa
´
nchez-Bautista et al.
3284 FEBS Journal 273 (2006) 3273–3286 ª 2006 The Authors Journal compilation ª 2006 FEBS
interaction mode of phosphorylation site in turn motif.
J Mol Biol 352, 918–931.
19 Xu ZB, Chaudhary D, Olland S, Wolfrom S, Czerwin-
ski R, Malakian K, Lin L, Stahl ML, Joseph-McCarthy
D, Benander C et al. (2004) Catalytic domain crystal
structure of protein kinase C-h (PKCh). J Biol Chem
279, 50401–50409.
20 Arrondo JLR & Gon
˜
i FM (1999) Structure and
dynamics of membrane proteins as studied by infrared
spectroscopy. Prog Biophys Mol Biol 72, 367–405.
21 Bandekar J & Krimm S (1980) Vibrational analysis of
peptides, polypeptides, and proteins. VI. Assignment of
beta-turn modes in insulin and other proteins. Biopoly-
mers 19, 31–36.
22 Bandekar J (1992) Amide modes and protein conforma-
tion. Biochim Biophys Acta 1120, 123–143.
23 Fabian H, Naumann D, Misselwitz R, Ristau O, Gerlach
D & Welfle H (1992) Secondary structure of streptokinase
in aqueous solution: a Fourier transform infrared
spectroscopic study. Biochemistry 31, 6532–6538.
24 Alvarez J, Haris PI, Lee DC & Chapman D (1987)
Conformational changes in concanavalin A associated
with demetallization and alpha-methylmannose binding
studied by Fourier transform infrared spectroscopy.
Biochim Biophys Acta 916, 5–12.
25 Arrondo JL, Young NM & Mantsch HH (1988) The
solution structure of concanavalin A probed by FT-IR
spectroscopy. Biochim Biophys Acta 952, 261–268.
26 Arrondo JLR, Blanco FJ, Serrano L & Gon
˜
iFM
(1996) Infrared evidence of a b-hairpin peptide structure
in solution. FEBS Lett 384, 35–37.
27 Saba RI, Ruyschaert JM, Herschuelz A & Goormaght-
igh E (1999) Fourier transform infrared spectroscopy
study of the secondary and tertiary structure of the
reconstituted Na
+
⁄ Ca
2+
exchanger 70-kDa polypeptide.
J Biol Chem 274, 15510–15518.
28 Hadden JM, Bloemendal M, Haris P, Srai SKS &
Chapman D (1994) Fourier transform infrared spectro-
scopy and differential scanning calorimetry of transfer-
rins: human serum transferrin, rabbit serum transferrin
and human lactoferrin. Biochim Biophys Acta 1205,
59–67.
29 Arrondo JLR, Castresana J, Valpuesta JM & Gon
˜
i
FM (1994) Structure and thermal denaturation of
crystalline and noncrystalline cytochrome oxidase as
studied by infrared spectroscopy. Biochemistry 33,
11650–11655.
30 Krimm S & Bandekar J (1986) Vibrational spectroscopy
and conformation of peptides, polypeptides, and pro-
teins. Adv Protein Chem 38, 181–364.
31 Fraser RDB & MacRae TP (1973) Conformation in
Fibrous Protein and Related Synthetic Polypeptides.
Academic Press, New York.
32 Arrondo JLR, Muga A, Castresana J, Bernabeu C &
Gon
˜
i FM (1989) An infrared spectroscopic study of
b-galactosidase structure in aqueous solutions. FEBS
Lett 252, 118–120.
33 Shimanouchi T, Tsuboi M & Kyogoku Y (1964) Infra-
red spectra of nucleic acids. In Advances in Chemical
Physics (Duchesne J, ed.), pp. 435–498. Wiley Inter-
science, New York.
34 Surewicz WK, Leddy JJ & Mantsch HH (1990) Deter-
mination of protein secondary structure by Fourier
transform infrared spectroscopy: a critical assessment.
Biochemistry 29, 8106–8111.
35 Powell JR, Wasacz FM & Jakobsen RJ (1986) An algo-
rithm for the reproducible spectral subtraction of water
from the FT-IR spectra of proteins in dilute solutions
and adsorbed monolayers. Appl Spectrosc 40, 339–344.
36 Susi H (1972) Infrared spectroscopy-conformation.
Methods Enzymol 26, 455–472.
37 Noda I (1989) Two-dimensional infrared spectroscopy.
J Am Chem Soc 111, 8116–8118.
38 Torrecillas A, Corbala
´
n-Garcı
´
aS&Go
´
mez-Ferna
´
ndez
JC (2003) Structural study of the C2 domains of the
classical PKC isoenzymes using infrared spectroscopy
and two-dimensional infrared correlation spectroscopy.
Biochemistry 42, 11669–11681.
39 Torrecillas A, Corbala
´
n-Garcı
´
aS&Go
´
mez-Ferna
´
ndez
JC (2004) An infrared spectroscopic study of the sec-
ondary structure of protein kinase C alpha and its ther-
mal denaturation. Biochemistry 43, 2332–2344.
40 Arrondo JLR, Iloro I, Aguirre J & Gon
˜
i FM (2004) A
two-dimensional IR spectroscopic (2D-IR) simulation
of protein conformational changes. Spectrosc Int J 18,
49–58.
41 Akamine P, Madhusudan Wu J, Xuong NH, Ten Eyck
LF & Taylor SS (2003) Dynamic features of cAMP-
dependent protein kinase revealed by apoenzyme crystal
structure. J Mol Biol 14, 159–171.
42 Huang X, Begley M, Morgenstern KA, Gu Y, Rose P,
Zhao H & Zhu X (2003) Crystal structure of an inactive
Akt2 kinase domain. Structure (Camb) 11, 21–30.
43 Manning G, Whyte DB, Martinez R, Hunter T &
Sudarsanam S (2002) The protein kinase complement of
the human genome. Science 298, 1912–1934.
44 Yang J, Cron P, Good VM, Thompson V, Hemmings
BA & Barford D (2002) Crystal structure of an acti-
vated Akt ⁄ protein kinase B ternary complex with
GSK3-peptide and AMP-PNP. Nat Struct Biol 9, 940–
944.
45 Holloway PW & Mantsch HH (1989) Structure of cyto-
chrome b
5
in solution by Fourier-transform infrared
spectroscopy. Biochemistry 28, 931–935.
46 Prestrelski SJ, Byler DM & Thompson MP (1991) Infra-
red spectroscopic discrimination between alpha- and
3(10)-helices in globular proteins. Reexamination of
amide I infrared bands of alpha-lactalbumin and their
assignment to secondary structures. Int J Pept Protein
Res 37, 508–512.
S. Sa
´
nchez-Bautista et al. Structure of catalytic domain from PKCf
FEBS Journal 273 (2006) 3273–3286 ª 2006 The Authors Journal compilation ª 2006 FEBS 3285
47 Miick SM, Martinez GV, Fiori WR, Todd AP & Mill-
hauser GL (1992) Short alanine-based peptides may
form 3(10)-helices and not alpha-helices in aqueous
solution. Nature 359, 653–655.
48 Mouro C, Jung C, Bodon A & Simonneaux G (1997)
Comparative Fourier transform infrared studies of the
secondary structure and the CO heme ligand environ-
ment in cytochrome P-450cam and cytochrome
P-420cam. Biochemistry 36, 8125–8134.
49 De las Rivas J & Barber J (1997) Structure and termal
stability of photosystem II reaction centres studied by
infrared spectroscopy. Biochemistry 36, 8897–8903.
50 Gorne-Tschelnow Naumann D, Weise C & Hucho F
(1993) Secondary structure behaviour of acetylcholines-
terase. Studies by Fourier-transform infrared spectro-
scopy. Eur J Biochem 213, 1235–1242.
51 Smith PK, Krohn RI, Hermanson GT, Mallia AK,
Gartner FH, Provenzano MD, Fujimoto EK, Goeke
NM, Olson BJ & Klenk DC (1985) Measurement of
protein using bicinchoninic acid. Anal Biochem 150,
76–85.
52 Chapman D, Gomez-Fernandez JC, Goni FM &
Barnard M (1980) Difference infrared spectroscopy of
aqueous model and biological membranes using an
infrared data station. J Biochem Biophys Methods 2,
315–323.
53 Griffiths PR & Pariente G (1986) Introduction to spec-
tral deconvolution. Trends Anal Chem 5, 209–215.
54 Garcı
´
a-Garcı
´
a J, Corbala
´
n-Garcı
´
aS&Go
´
mez-Ferna
´
n-
dez JC (1999) Effect of calcium and phosphatidic acid
binding on the C2 domain of PKC alpha as studied by
Fourier transform infrared spectroscopy. Biochemistry
38, 9667–9675.
55 Noda I (1993) Generalized two-dimensional correlation
method applicable to infrared, Raman, and other types
of spectroscopy. Appl Spectrosc 47, 1329–1336.
Structure of catalytic domain from PKCf S. Sa
´
nchez-Bautista et al.
3286 FEBS Journal 273 (2006) 3273–3286 ª 2006 The Authors Journal compilation ª 2006 FEBS