- Trang chủ >>
- Khoa Học Tự Nhiên >>
- Vật lý
one - pot facile synthesis of iron oxide nanowires as high capacity anode
Bạn đang xem bản rút gọn của tài liệu. Xem và tải ngay bản đầy đủ của tài liệu tại đây (1.24 MB, 15 trang )
Accepted Manuscript
Title: One-pot facile synthesis of iron oxide nanowires as high
capacity anode materials for lithium ion batteries
Authors: Hao Liu, David Wexler, Guoxiu Wang
PII: S0925-8388(09)01602-8
DOI: doi:10.1016/j.jallcom.2009.08.043
Reference: JALCOM 20491
To appear in: Journal of Alloys and Compounds
Received date: 24-5-2009
Revised date: 10-8-2009
Accepted date: 11-8-2009
Please cite this article as: H. Liu, D. Wexler, G. Wang, One-pot facile synthesis of iron
oxide nanowires as high capacity anode materials for lithium ion batteries, Journal of
Alloys and Compounds (2008), doi:10.1016/j.jallcom.2009.08.043
This is a PDF file of an unedited manuscript that has been accepted for publication.
As a service to our customers we are providing this early version of the manuscript.
The manuscript will undergo copyediting, typesetting, and review of the resulting proof
before it is published in its final form. Please note that during the production process
errors may be discovered which could affect the content, and all legal disclaimers that
apply to the journal pertain.
Page 1 of 14
Accepted Manuscript
1
One-pot facile synthesis of iron oxide nanowires as high capacity
anode materials for lithium ion batteries
Hao Liu
*
, David Wexler, Guoxiu Wang
*
Institute for Superconducting and Electronic Materials, School of Mechanical, Materials
and Mechatronic Engineering, University of Wollongong, NSW 2522, Australia
Abstract
Alpha-Fe
2
O
3
nanowires were synthesized by a facile hydrothermal method. The crystalline
structure and morphology of the synthesized materials have been characterized by X-ray
diffraction, scanning electron microscopy and transmission electron microscopy. The results
revealed that the prepared alpha-Fe
2
O
3
product was uniform nanowires with the
length/diameter ratio as high as 500. The electrochemical properties of alpha-Fe
2
O
3
nanowires
were evaluated by cyclic voltammetry (CV) and charge/discharge measurements. The initial
charge/discharge capacities can reach 947/1303
mAh/g at the rate of 0.1C. The lithium storage
capacity maintained 456
mAh/g after 100 cycles. This good electrochemical performance may
be attributed to the large surface area and short pathways in nanowires for lithium ion
migration.
Keywords:
α
-Fe
2
O
3
; Nanowires; Hydrothermal synthesis; Lithium ion batteries
* Corresponding author, email:
, , Fax: 61-2-42215731
Page 2 of 14
Accepted Manuscript
2
1. Introduction
Due to the low cost and abundance of the raw materials, the Fe
2
O
3
has been widely
investigated in many technological fields such as anode materials for lithium ion batteries, gas
sensors, catalysts and magnetic applications [1-6]. In the past decade, one-dimensional (1D)
nanomaterials have attracted great interest because of their unique morphologies and
properties in nanoscience and nanotechnology [7-9]. Iron oxides also have been synthesized
in a variety of 1D morphologies such as nanowires [10,11], nanoneedles [12]
,
nanorods
[3,4,13,14], and nanotubes [15,16] for various applications.
Many transition metal oxides have been investigated as anode materials for lithium ion
batteries to replace the current graphite materials [17,18]. Fe
2
O
3
has been tested as a lithium
ion storage material and shows promise in the quest to achieve new anode materials with high
capacity for lithium ion batteries [3,4,19-23]. The mechanism of lithium ion
intercalation/de-intercalation in Fe
2
O
3
materials can be described by the following equation:
Fe
2
O
3
+ 6Li ↔ 3Li
2
O+2Fe
The Fe
2
O
3
crystal lattice can cause six Li ions transport per formula unit during the
charge/discharge process, and the theoretical capacity of Fe
2
O
3
is as high as 1005 mAh/g,
which is much higher than that of the theoretical capacity of graphite anode materials (372
mAh/g). The extraction of lithium ion from Li
2
O is thermodynamically impossible. However,
it becomes feasible for nanosize materials, as has been reported previously [17]. Capacity
fading is the main issue for all transition metal oxides proposed as anode materials for lithium
ion batteries. Using nanoscale Fe
2
O
3
materials, especially 1D structured materials, is a
feasible approach to improve its properties as an anode material, because nanostructured
Page 3 of 14
Accepted Manuscript
3
materials can provide short pathway and high kinetics for lithium ion insertion/extraction.
In this paper, we first report a facile method with low cost starting materials (FeCl
3
and
nitrilotriacetic acid) to synthesize α-Fe
2
O
3
nanowires as anode material for lithium ion
batteries. The electrochemical performance of the
α
-Fe
2
O
3
nanowires has achieved
significantly higher capacity compared to the commercial graphite anode materials.
2. Experimental
The
α
-Fe
2
O
3
nanowires were synthesized via a hydrothermal method. Precursors were
prepared in the first step in an autoclave. In a typical synthesis, 1.05
mmol FeCl
3
was
dissolved in 7
mL distilled water and 7
mL isopropanol to form a solution. 3
mmol
nitrilotriacetic acid (NTA) was then added. After thorough stirring, the mixture was
transferred into a Teflon lined autoclave and hydrothermally treated at 180℃ for 24
h. The
resultant white floccules were washed with deionized water and absolute ethanol, and dried at
60
℃
in a vacuum oven. Finally, the precursors were sintered at 500
℃
for 2
h to obtain
α-Fe
2
O
3
nanowires.
The α-Fe
2
O
3
nanowire
anode electrodes were made up by mixing the active materials with
acetylene black (AB) and a binder, poly(vinylidene fluoride) (PVdF), at weight ratios of
40:40:20, in N-methyl-2-pyrrolidone (NMP) solvent. The resultant slurry was uniformly
pasted on Cu foil with a blade. These prepared electrode sheets were dried at 120
℃
in a
vacuum oven for 12 hours and pressed under a pressure of approximately 200
kg/cm
2
.
CR2032-type coin cells were assembled in a glove box for electrochemical characterization.
The electrolyte was 1M LiPF
6
in a 1:1 mixture of ethylene carbonate (EC) and dimethyl
Page 4 of 14
Accepted Manuscript
4
carbonate (DMC). Li metal foil was used as the counter and reference electrode.
The microstructure and morphology of the α-Fe
2
O
3
nanowires were characterized by X-ray
diffraction (XRD, GBC MMA) in the 2theta degree range from 15 to 70°, scanning electron
microscopy (SEM, JEOL JEM-3000), and transmission electron microscopy (TEM, JEOL
2011). The specific surface area of the Fe
2
O
3
nanowires was measured by the gas adsorption
technique using a Quanta Chrome Nova 1000 Gas Sorption Analyzer based on the
Brunauer-Emmett-Teller (BET) method. The cells were galvanostatically charged and
discharged at a current density of 0.1
C within the range of 0.01 V to 3
V. Cyclic voltammetry
(CV) curves were measured at 0.5
mV/s within the range of 0.01 to 3.0
V, using an
electrochemistry workstation (Princeton Applied Research 2273).
3. Results and discussion
Fig. 1 shows the XRD pattern of the Fe
2
O
3
nanowires, using Cu Kα radiation (λ=1.5406
Å).
The diffraction pattern confirmed that the crystal structure is coincident with the standard
hematite (α-Fe
2
O
3
) rhombohedral structure (JCPDS Card No. 33-0664). No impurity was
detected from the XRD pattern, indicating that the nanowires are of a single-phase
rhombohedral crystal structure after the 500
℃
annealing.
The SEM images of the nanowires and precursors are shown in Fig. 2(a). It clearly
demonstrated that the FeNTA precursors from the hydrothermal reaction are entirely in the
form of well dispersed nanowires. In the hydrothermal processing, Fe
3+
ions were bonded and
anchored to amino groups or carboxyl groups from the reactant of NTA, and formed 1D
long-chain polymer precursors. After being sintered at 500℃ for 2
h, the precursors
converted to alpha phase Fe
2
O
3
nanowires. Fig. 2(b) shows the final product, the Fe
2
O
3
Page 5 of 14
Accepted Manuscript
5
nanowires, which elucidates that the one-dimensional structure was stable during the thermal
treatment of the precursors. The nanowires can achieve lengths as long as long 100µm.
However, due to the high surface energy of the nanostructured materials, the Fe
2
O
3
nanowires
were partially agglomerated during the thermal treatment. Adjacent nanowires running in the
same direction combine easily with each other because there is maximum contact between the
surfaces, inducing minimum surface energy. Fig. 2(c) shows a TEM image of nanowires at
20k magnification. The nanowires are agglomerated with other nanowires in the same
direction. The inset in the upper right corner of Fig. 2(c) is the selected area electron
diffraction (SAED) pattern of the nanowires. In the electron diffraction pattern, each ring
represents the electron diffraction from a different lattice plane, which can be fully indexed to
the rhombohedral crystal structure. Fig. 2(d) is a TEM image of a single nanowire at 100k
magnification. It shows that the single nanowire has a polycrystalline structure with a width
around 200
nm. The length/diameter ratio is as high as 500. The upper right inset in Fig. 2(d)
shows a high resolution TEM (HRTEM) image of the inner part of the single nanowire. The
HRTEM image clearly shows the microstructure of the individual grains, which confirms the
polycrystalline structure of the nanowires. The spacing of the lattice planes in the image was
determined to be 0.37
nm, which is consistent with the standard value for the (012) plane
(0.368
nm). The polycrystal Fe
2
O
3
nanowires exhibit a high specific surface area of 152m
2
/g
from the BET calculation. The high surface area nanowires can provide more reaction sites
for lithium ion transport.
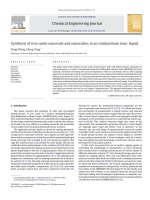
Cyclic voltammetry (CV) is a basic instrumental method that can reveal the
electrochemical mechanism of reactions. Fig. 3 shows the first three cycles of CV curves of
Page 6 of 14
Accepted Manuscript
6
the nanowires in the range of 0.01-3
V. It is clear that there is a substantial difference between
the first and the subsequent cycles. In the first cycle, with a scanning rate of 0.5
mV/s, the
spiky peak at 0.62
V represents the transition from Fe
3+
to Fe
0
in the cathodic process, which
could be associated with the electrolyte decomposition and the reversible conversion reaction
of lithium ion intercalation to form Li
2
O. An anodic peak is present at about 1.75
V,
corresponding to the reversible oxidation of Fe
0
to Fe
3+
. In the subsequent cycles, the
cathodic/anodic peak potentials shift to 0.68 and 1.76
V, respectively. During the anodic
process, both the peak current and the integrated area of the anodic peak are decreased,
indicating the capacity loss during the charge/discharge process. The capacity loss can be
attributed to the decomposition of electrolyte to form a SEI layer and the irreversible lithium
ion loss from the formation of Li
2
O. In the first cycle, the difference in the integrated area
between cathodic/anodic peaks is bigger than in the subsequent cycles, which indicates that
the initial capacity loss can be mostly attributed to the electrolyte decomposition. For the
one-dimensional Fe
2
O
3
nanowires, the high surface energy causes irreversible capacity loss
by decomposing the electrolyte. The SEI layer could cover the reactive sites and avoid further
decomposition. On the other hand, the nanowires with high surface area can provide more
sites for lithium ion intercalation/deintercalation. The short pathways in the nanowires can
also enhance lithium ion diffusion.
The Fe
2
O
3
nanowires were tested as anode materials for lithium ion batteries. The capacity
performance and charge/discharge curves for the first cycle are shown in Fig. 4. The
charge/discharge curves are shown in the inset, and they exhibit the charge/discharge plateaus
at 1.76/0.78
V. In CV testing, the anodic/cathodic peaks are present at 1.75/0.62
V, respectively.
Page 7 of 14
Accepted Manuscript
7
The difference can be attributed to the hysteresis in CV testing, which is caused by the
mismatch between the mass transfer and charge transfer processes on the electrode/electrolyte
interphase. The initial discharge capacity is 1303
mAh/g, which is higher than the theoretical
capacity of Fe
2
O
3
(1005
mAh/g). The extra capacity beyond the theoretical value is probably
due to the decomposition of non-aqueous electrolyte during the discharge process. The initial
charge capacity is 947
mAh/g, and the initial coulombic efficiency is 72.7%. In the second and
third cycles, the coulombic efficiencies are increased to 91.0% and 91.3%, which indicates
that the initial irreversible capacity loss is mainly caused by the decomposition. The formation
of the SEI layer protects the nanowires so as to avoid further electrolyte decomposition and
enhances the coulombic efficiency in the subsequent cycles. After 100 cycles, the
charge/discharge capacities reach 436/456
mAh/g. The charge/discharge capacity retention
after 100 cycles is 44.8% and 35.3%, respectively. Although the retention is not particularly
high, the capacity is higher than that of the commercial anode materials (graphite, 372
mAh/g),
and the performance is much better than that of the previously reported α-Fe
2
O
3
[24].
α-Fe
2
O
3
nanowires material appears to be a promising candidate as a high capacity anode
material for lithium ion batteries.
4. Conclusions
α-Fe
2
O
3
nanowires were successfully prepared by a hydrothermal method and subsequent
heat treatment. The nanowires are as long as 100
µm, and the diameter is less than 200
nm.
The Fe
2
O
3
nanowires were tested as anode materials for lithium ion batteries. The initial
discharge capacity is 1303
mAh/g, which is higher than the theoretical capacity of Fe
2
O
3
. The
discharge capacity retention after 100 cycles is 456
mAh/g, which represents better
Page 8 of 14
Accepted Manuscript
8
performance than the commercial graphite anode and other microsize α-Fe
2
O
3
powders.
Acknowledgement
We are grateful for financial support from the Australian Research Council (ARC) through
the ARC Discovery Project “First principles for development of novel hybrid electrochemical
energy storage and conversion systems” (DP0772999).
References
[1] M.H. Cao, T.F. Liu, S. Gao, G.B. Sun, X.L. Wu, C.W. Hu, Z.L. Wang,
Angew. Chem. Int. Ed.
44 (2005) 4197-4201.
[2] C. Karunakaran, S. Senthilvelan, Electrochem. Commun. 8 (2006) 95-101.
[3] C.Z. Wu, P. Yin, X. Zhu, C.Z. OuYang, Y. Xie, J. Phys. Chem. B 110 (2006)
17806-17812.
[4] H. Liu, G.X. Wang, J.S. Park, J.Z. Wang, H.K. Liu, C. Zhang, Electrochimica Acta 54
(2009) 1733-1736.
[5] X.W. Teng, X.Y. Liang, S. Rahman, H. Yang, Adv. Mater. 17 (2005) 2237-2241.
[6] X.L. Xie, H.Q. Yang, F.H. Zhang, L. Li, J.H. Ma, H. Jiao, J.Y. Zhang, J. Alloys Compd.
477 (2009) 90-99.
[7] Y. Cui, Q.Q. Wei, H. K. Park, C.M. Lieber, Science 293 (2001) 1289-1292.
[8] Y. Huang, X. Duan, Y. Cui, L.J. Lauhon, K.H. Kim, C.M. Lieber, Science, 294 (2001)
1313-1317.
[9]
P.G. Collins, M.S. Arnold, P. Avouris, Science 292 (2001) 706-709.
[10] Q. Han, Z.H. Liu, Y.Y. Xu, Z.Y. Chen, T.M. Wang, H. Zhang, J. Phys. Chem. C 111 (2007)
5034-5038.
Page 9 of 14
Accepted Manuscript
9
[11] Y.Y. Fu, R.M. Wang, J .Xu, J. Chen, Y. Yan, A.V. Narlikar, H. Zhang, Chem. Phy. Lett.
279 (2003) 373-379.
[12] X.H. Sun, W.T. Liu, D.X. Ouyang, J. Alloys Compd. 478 (2009) 38-40.
[13] J.J. Wu, Y.L. Lee, H.H. Chiang, D.K.P Wong, J. Phys. Chem. B 110 (2006) 18108-18111.
[14] X.L. Gou, G.X. Wang, J. Yang, J.S. Park, D. Wexler, Chem. Eur. J. 14 (2008) 5996-6002.
[15] X.P. Shen, H.J. Liu, L Pan, K.M. Chen, J.M. Hong, Z. Xu, Chem.Lett. 33 (2004)
1128-1129.
[16] J. Bachmann, J. Jing, M. Knez, S. Barth, H. Shen, S. Mathur, U. Goesele, K. Nielsch, J.
Am. Chem. Soc. 129 (2007) 9554-9555.
[17] P. Poizot, S. Laruelle, S. Grugeon, L. Dupont, J.M. Tarascon, Nature 407 (2000) 496-499.
[18] L.C. Yang, Q.S.Gao, Y.H. Zhang, Y. Tang, Y.P. Wu, Electrochem. Commun. 10 (2008)
118-122.
[19] D. Larcher, D. Bonnin, R. Cortes, I. Rivals, L. Personnaz, J.M. Tarascon, J. Electrochem.
Soc. 150 (2003) A1643-A1650.
[20] D. Larcher, C. Masquelier, D. Bonnin, Y. Chabre, V. Masson, J.B. Leriche, J.M. Tarascon,
J. Electrochem. Soc. 150 (2003) A133-A139.
[21] P.C. Wang, H.P. Ding, T. Bark, C.H. Chen, Electrochim. Acta 52 (2007) 6650-6655.
[22] M. Hibino, J. Terashima, T. Yao, J. Electrochem. Soc. 154 (2007) A1107-A1111.
[23] W.W. Zhou, K.B. Tang, S.A. Zeng, Y.X. Qi, Nanotechnology 19 (2008) 065602.
[24]
H. Morimoto, S.I. Tobishima, Y. Iizuka, J. Power Sources 146 (2005) 315-318.
Page 10 of 14
Accepted Manuscript
10
Caption of figures
Fig. 1. X-ray diffraction pattern of alpha phase iron oxide nanowires.
Fig. 2. SEM and TEM Images of Fe
2
O
3
nanowires and precursors. a) The SEM image of
Fe
2
O
3
nanowires precursors. b) The SEM image of Fe
2
O
3
nanowires after sintering at 500℃.
c) The TEM image of Fe
2
O
3
nanowires at low magnification (the inset is SAED pattern). d)
The TEM image on single nanowire at high magnification (inset is the HRTEM image).
Fig. 3. The first 3 cycles CV curves of the Fe
2
O
3
nanowires as anode for lithium ion cell.
Fig. 4. The charge/discharge performance of Fe
2
O
3
nanowires. The top-right inset is the first
cycle charge/discharge profiles.
Page 11 of 14
Accepted Manuscript
1
Fig. 1. X-ray diffraction pattern of alpha phase iron oxide nanowires.
20 30 40 50 60 70
(300)
(214)
(018)
(116)
(024)
(113)
(012)
(110)
(104)
Intensity / a.u.
2
/ degree
Figure(s)
Page 12 of 14
Accepted Manuscript
2
Fig. 2. SEM and TEM images of Fe
2
O
3
nanowires and precursors: (a) SEM image of Fe
2
O
3
nanowire precursors. (b) SEM image of Fe
2
O
3
nanowires after sintering at 500℃. (c) TEM
image of Fe
2
O
3
nanowires at low magnification (with the inset showing the corresponding
SAED pattern). d) TEM image of a single nanowire at high magnification (with the inset
showing a corresponding HRTEM image).
Page 13 of 14
Accepted Manuscript
3
Fig. 3. CV curves for the first 3 cycles of the Fe
2
O
3
nanowires as anode in lithium ion cell.
0.0 0.5 1.0 1.5 2.0 2.5 3.0
-2.0
-1.5
-1.0
-0.5
0.0
0.5
3rd
3rd
2nd
2nd
1st
1st
Current / mA
Potential / V
Page 14 of 14
Accepted Manuscript
4
0 20 40 60 80 100
0
200
400
600
800
1000
1200
1400
0 200 400 600 800 1000 1200 1400
0.0
0.5
1.0
1.5
2.0
2.5
3.0
Voltage / V
Capacity / mAh/g
Charge capacity
Discharge capacity
Capacity / mAh/g
Cycle Number
Fig. 4. The charge/discharge performance of the Fe
2
O
3
nanowires. The inset on the upper right
shows the first cycle charge/discharge profiles.