- Trang chủ >>
- Khoa Học Tự Nhiên >>
- Vật lý
synthesis of porous fe2o3 nanorods and deposition
Bạn đang xem bản rút gọn của tài liệu. Xem và tải ngay bản đầy đủ của tài liệu tại đây (677.18 KB, 7 trang )
Synthesis of Porous r-Fe
2
O
3
Nanorods and Deposition of Very
Small Gold Particles in the Pores for Catalytic Oxidation of CO
Ziyi Zhong,*
,†
Judith Ho,
†
Jaclyn Teo,
†
Shoucang Shen,
†
and Aharon Gedanken*
,‡
Institute of Chemical and Engineering Sciences, 1 Pesek Road, Jurong Island, Singapore 627833, and
Department of Chemistry and Kanbar Laboratory for Nanomaterials, Bar-Ilan UniVersity Center for
AdVanced Materials and Nanotechnology, Bar-Ilan UniVersity, Ramat-Gan 52900, Israel
ReceiVed April 30, 2007. ReVised Manuscript ReceiVed June 21, 2007
FeO(OH) nanorods were prepared by a mild hydrothermal synthesis using tetraethylammonium
hydroxide (TEAOH) as the structure director. The as-prepared FeO(OH) was converted to porous R-Fe
2
O
3
nanorods via calcination at 300 °C. The R-Fe
2
O
3
nanorods have a pore size distribution in the range of
1-5 nm, which is ideal to house very small gold (Au) particles. Later, by employing our invented
Au- colloid-method, in which lysine was used as the capping reagent and sonication was employed to
facilitate the deposition of the Au particles, we inserted very small Au particles into these pores. The
prepared Au/R-Fe
2
O
3
-nanorod catalyst exhibited higher catalytic activity than the Au/R-Fe
2
O
3
(Fluka)
catalyst.
1. Introduction
In recent years, intensive attention has been paid to gold
(Au) catalysis, evidenced by an exponential increase in
publications on its applications.
1-5
Initially, metallic Au was
believed to be very stable and inert in catalysis. However,
this status has changed since Haruta et al. observed the
extraordinary high catalytic activity for CO oxidation on the
supported-Au catalysts.
1
Interestingly, the catalytic perfor-
mance of Au catalysts is highly dependent on the Au particle
size.
6,7
When the Au particle size becomes very small
(usually e5 nm), high activities for a number of reactions
under mild conditions are reported.
8-13
Both Haruta
14
and
Goodman
6
reported that for CO oxidation, the optimum Au
particle size should be between 2 and 4 nm. Other factors
contributing to the enhanced catalytic activity include
electronic effects such as the transition of Au particles from
a metallic to a nonmetallic state when reducing Au particle
size to or below ca. 5.0 nm, as well as the strong metal-
support interaction (SMSI).
15
Although progress has been
made recently in the preparation of supported-Au catalysts
on silica,
16-19
developing practical methods for the prepara-
tion of Au-based catalysts with good control of Au particle
size and with high stability still remains a challenge. The
current paper adds to the vast existing information on Au
catalysis with the idea that, in order to provide a good control
on the Au particle size and to improve the stability of the
Au particle or lower their mobility, the pores of the catalyst
support should be of the same dimension as the Au particles.
Also, it is expected that the insertion of Au particles into
the shallow pores can increase the perimeter distance of the
Au-support interface, thus enhancing the catalytic perfor-
mance for CO oxidation
14
.
Among the various catalysts for CO oxidation, the catalysts
of Au supported on R-Fe
2
O
3
(hematite) exhibit almost the
highest catalytic activity.
1-4,14,20-22
Therefore, in order to
further improve the catalytic performance of the Au/R-Fe
2
O
3
catalysts, proper R-Fe
2
O
3
should be prepared, e.g., with pores
that are comparable to the size of the very small Au particles
so as to accommodate or fix the gold in the pores. However,
* Corresponding authors. E-mail: (Z.Z.);
(A.G.)
†
Institute of Chemical Engineering and Sciences.
‡
Bar-Ilan University.
(1) Haruta, M.; Kobayashi, T.; Sano, H.; Yamada, N. Chem. Lett. 1987,
405.
(2) Haruta, M.; Yamada, N.; Kobayashi, T.; Iijima, S. J. Catal. 1989,
115, 301.
(3) Haruta, M. Catal. Today 1997, 36, 153.
(4) Hutchings, G. J. Gold Bull. 1996, 29, 123.
(5) Hutchings, G. J. Catal. Today 2002, 72, 11.
(6) Valden, M.; Lai, X.; Goodman, D. W. Science 1998, 281, 1647.
(7) Chen, M. S.; Goodman, D. W. Science 2004, 306, 252.
(8) Fu, Q.; Saltsburg, H.; Flytzani-Stephanopoulos, M. Science 2003, 301,
935.
(9) Kim, W. B.; Voitl, T.; Rodrigue-Rivera, G. J.; Dumesic, J. A. Science
2004, 305, 1280.
(10) Enache, D. I.; Edwards, J. K.; Landon, P.; Solsona-Espiru, B.; Carley,
A. F.; Herzing, A. A.; Watanabe, M.; Kiely, C. J.; Knight, D. W.;
Hutchings, G. J. Science 2006, 311, 362.
(11) Chowdhury, B.; Bravo-Sua´rez, J. J.; Date´, M.; Tsubota, S.; Haruta,
M. Angew. Chem., Int. Ed. 2006, 45, 412.
(12) Hughes, M. D.; Xu, Y. J.; Jenkins, P.; McMorn, P.; Landon, P.; Enache,
D. I.; Carley, A. F.; Attard, G. A.; Hutchings, G. J.; King, F.; Stitt, E.
H.; Johnston, P.; Griffin, K.; Kiely, C. J. Nature 2006, 437, 1132.
(13) Corti, C. W.; Holloday, R. J.; Thompson, D. T. Appl. Catal. A. 2005,
291, 253.
(14) Haruta, M.; Tsubota, S.; Kobayashi, T.; Kageyama, H.; Genet, M. J.;
Delmon, B. J. Catal. 1993, 144, 175.
(15) Goodman, D. W. Catal. Lett. 2005, 99,1.
(16) Budroni, G.; Corma, A. Angew. Chem., Int. Ed. 2006, 45, 3328.
(17) Liu, Y. H.; Lin, H. P.; Mou, C. Y. Langmuir 2004, 20, 3231.
(18) Chiang, C. W.; Wang, A.; Wan, B. Z.; Mou, C. Y. J. Phys. Chem. B
2005, 109, 18042.
(19) Zhu, H.; Liang, C.; Yan, W.; Overbury, S. H.; Dai, S. J. Phys. Chem.
B 2006, 110, 10842.
(20) Cheng, W. H.; Wu, K. C.; Lo, M. Y.; Lee, C. H. Catal. Today 2004,
97, 145.
(21) Landon, P.; Ferguson, J.; Solsona, B. E.; Garcia, T.; Carley, A. F.;
Herzing, A. A.; Kiely, C. J.; Golunski, S. E.; Hutchings, G. J. Chem.
Commun. 2005, 3383.
(22) Khoudiakov, M.; Gupta, M. C.; Deevi, S. Appl. Catal. A. 2005, 291,
151.
4776 Chem. Mater. 2007, 19, 4776-4782
10.1021/cm071165a CCC: $37.00 © 2007 American Chemical Society
Published on Web 08/18/2007
so far, there are only a few successful reports on this kind
of synthesis,
23-25
including the synthesis of single-crystalline
R-Fe
2
O
3
nanotubes with inner diameters in the range of 40-
80 nm by reacting FeCl
3
with NH
4
H
2
PO
4
under hydrothermal
conditions,
23
the synthesis of hollow hematite nanowires
(with a pore size of 15 nm) by a vacuum-pyrolysis route
from β-FeOOH,
24
and the hydrothermal synthesis of R-Fe
2
O
3
hollow spheres in the presence of D-glucose.
25
In a series of
attempts, we first prepared porous γ-Fe
2
O
3
(not R-Fe
2
O
3
)
with high surface areas by the sonochemical method,
26
and
very recently, we prepared single crystals of R-Fe
2
O
3
nanorods but failed to create pores inside.
27
By using iron
(III) ethoxide as the precursor and decylamine as the
template, Bruce et al.
28
first prepared ordered 2-dimensional
(2D) and 3-dimensional (3D) mesoporous iron oxide with
an average pore size of 7.0 nm, but the precursor used in
the synthesis is quite expensive, limiting its large-scale
application in catalysis. In the past decade, intensive efforts
have also been invested in the synthesis of microporous and
mesoporus silicalites via the use of tetrapropylammonium
hydroxide (TPAOH) as the structure director.
29
Moritz et al.
30
also prepared 1-dimensional (1D) TiO
2
using TPAOH as the
structure director. However, so far, there is no report on the
synthesis of R-Fe
2
O
3
using similar strategies. Herein, we
adapted this method to the synthesis of porous R-Fe
2
O
3
,in
which, cheap Fe(NO
3
)
3
was used as precursor and TEAOH
was used as the structure director. The synthesis is a simple
one-pot hydrothermal reaction and can be readily scaled up,
and the as-prepared product, the R-FeO(OH) nanorods, can
be converted to porous 1D R-Fe
2
O
3
nanorods. Interestingly,
the pore size in the R-Fe
2
O
3
product is 1-5 nm. As already
proven, these pores are ideal to host the very small Au
particles. Indeed, by employing our invented method for the
deposition of the Au particles, we inserted very small Au
particles into these pores. The prepared Au/Fe
2
O
3
-nanorod
catalyst exhibited higher catalytic activity than the
Au/R-Fe
2
O
3
(Fluka) catalyst.
2. Experimental Details
All chemicals were purchased from Aldrich except for the
commercial R-Fe
2
O
3
, which was from Fluka. Reference Au catalysts
were purchased from the World Gold Council (WGC). The R-Fe
2
O
3
support was synthesized by a hydrothermal method. Typically, 1.0
g of Fe(NO
3
)
3
‚9H
2
O was added to 10 mL of 20 wt % aqueous
TEAOH solution. The added Fe(NO
3
)
3
‚9H
2
O was hydrolyzed within
several minutes, and a brown slurry was formed. The mixture was
stirred for a while and transferred into a screw-capped autoclave
lined with a Teflon vessel. The autoclave was heated in an oven at
a temperature of 80 °C. After the reaction, the precipitate was
washed with deionized (DI) water four times, dried in a vacuum
oven at 100 °C overnight, and calcined at 300 °C for 0.5 h. This
synthesis can be readily scaled up due to its simplicity. Using an
autoclave of 200 mL, we were able to prepare the R-Fe
2
O
3
nanorods
of ca. 12 g at one time.
For catalyst preparation, we employed our recently invented Au-
colloid-based method.
31-35
In this technique, very small Au colloids
were first produced by reduction of HAuCl
4
with NaBH
4
in the
presence of the capping reagent (lysine) and the catalyst support.
At the same time, during the reduction, ultrasonic irradiation
(sonication) was applied which efficiently facilitated the deposition
of the Au colloids on the catalyst supports. In a typical preparation,
0.50 g of R-Fe
2
O
3
was added to 10 mL of DI water, followed by
1.5 mL of 0.01 M HAuCl
4
and 1.5 mL of 0.01 M Lysine (Lys)
(Au loading was ca. 0.5 wt %). The pH value of the suspension
was then adjusted to 5-6 with 0.10 M of NaOH solution, after
which it was subjected to a sonication for 20 s. During the
sonication, freshly prepared NaBH
4
(0.1 M, 5-10 times the Au
molar number) was injected instantly. After the reaction, the end-
point pH value was measured. The suspension was changed in the
dark immediately and was then washed with DI water four times
with a centrifuge. The whole preparation for one catalyst including
the solution preparation and the washing can be finished within 1
h.
The measurement of the catalytic activity for CO oxidation was
carried out in a fixed-bed microreactor. Prior to the test, the catalyst
(50 mg) was treated in air at 300 °C for 1 h. According to our
unpublished Fourier transform infrared (FTIR) results, the capping
molecules of lysine were removed below 250 °C during this
activation stage. After cooling to room temperature, a reactant gas
containing 1% CO in air was passed through the catalyst bed. The
outlet gas was analyzed on-line with a GC (Shimadzu-14B). For
catalytic measurement at high gas hourly space velocity (GHSV)
(400 000 h
-1
), 10 mg of the Au/R-Fe
2
O
3
catalyst was diluted with
20 mg of R-Al
2
O
3
prior to the catalytic run.
The morphology and size of the products were observed
employing a transmission electron microscope (TEM, Tecai TF20
Super Twin, 200 kV). Powder X-ray diffraction (XRD) analysis
was conducted on a Bruker D8 Advance X-ray diffractometer with
CuK
R1
radiation, while the thermal analysis (TGA) was performed
on a SDT 2960 instrument in air flow. The surface area was
measured at 77 K (liquid nitrogen) on a Quantachrome Autosorb-
6B surface area and pore size analyzer. Before the BET surface
area measurement, the samples were degassed at 200 °C for several
hours. The infrared spectra for dried samples were recorded on a
Bio-Rad Excalibur spectrometer employing a KBr disc method.
X-ray photoelectron spectroscopy (XPS) spectra were recorded in
an ESCALAB 250 spectrometer and Al KR radiation was used as
the X-ray source. The C1s peak at 284.5 eV was used as a reference
for the calibration of the binding energy (BE) scale.
3. Results and Discussion
The influence of the experimental conditions on the
morphology and structure are studied. The as-prepared iron
(23) Xiong, Y.; Li, Z.; Li, X.; Hu, B.; Xie, Y. Inorg. Chem. 2004, 43,
6540.
(24) Jia, C. J.; Sun, L. D.; Yan, Z. G.; You, L. P.; Luo, F.; Han, X. D.;
Pang, Y. C.; Zhang, Z.; Yan, C. H. Angew. Chem., Int. Ed. 2005, 44,
4328.
(25) Titirici, M. M.; Antonietti, M.; Thomas, A. Chem. Mater. 2006, 18,
3808.
(26) Srivastava, D. N.; Perkas, N.; Gedanken, A.; Felner, I. J. Phys. Chem.
B 2002, 106, 1878.
(27) Zhong, Z.; Lin, M.; Ng, V.; Ng, G. N. B.; Foo, Y.; Gedanken, A.
Chem. Mater. 2006, 18, 6031.
(28) Jiao, F.; Bruce, P. G. Angew. Chem., Int. Ed. 2004, 43, 5958.
(29) (a) Rimer, J. D.; Fedeyko, J. M.; Vlachos, D. G.; Lobo, R. F. Chem.s
Eur. J. 2006, 12, 2926. (b) Israelachvili, V. Intermolecular and Surface
Forces; Academic Press: New York, 1992.
(30) Chemseddine, A.; Moritz, T. Eur. J. Inorg. Chem. 1999, 235.
(31) Zhong, Z.; Patskovskyy, S.; Bouvrette, P.; Luong, J. H. T.; Gedanken,
A. J. Phys. Chem. B 2004, 108, 4046.
(32) Zhong, Z.; Luo, J.; Ang, T. P.; Highfield, J.; Lin, J.; Gedanken, A. J.
Phys. Chem. B 2004, 108, 18119.
(33) Zhong, Z.; Subramanian, A. S.; Highfield, J.; Carpenter, K.; Gedanken,
A. Chem.sEur. J. 2005, 11, 1473.
(34) Zhong, Z.; Chen, F.; Subramanian, A. S.; Lin, J.; Highfield, J.;
Gedanken, A. J. Mater. Chem. 2006, 16, 489.
(35) Zhong, Z.; Lin, J.; Teh, S. P.; Teo, J.; Dautzenberg, F. M. AdV. Funct.
Mater. 2007, 17, 1402.
Synthesis of Porous R-Fe
2
O
3
Nanorods Chem. Mater., Vol. 19, No. 19, 2007 4777
oxide product exists in the form of FeO(OH) (see XRD
results in Figure 4). Figure 1 shows the TEM images of the
FeO(OH) products prepared at various TEAOH/Fe molar
ratios. When the TEAOH/Fe ratio was below 3/1, no
nanorods were observed except for the conventional ag-
glomerates of the small particles (Figure 1A). Increasing the
TEAOH/Fe molar ratio to 6/1 led to the near 100% formation
of the FeO(OH) nanorods (Figure 1B and C). The high-
resolution TEM (HRTEM) image shows that the nanorods
were well organized and crystallized on the surface (Figure
1C). It should be pointed out that little influence was
observed on the aspect ratio by varying the TEAOH/Fe ratio.
The impact of the reaction temperature and time on the
morphology of the FeO(OH) product is shown in Figure 2.
The formation of the FeO(OH) nanorods is a fast process.
The initial suspension was a brown slurry composed of very
small particles of Fe hydroxide (Figure 2A), but the FeO-
(OH) nanorods were formed after reaction at 80 °C for 0.5
h or even at temperatures as low as 40 °C (Figure 2C). These
FeO(OH) nanorods are about 7-10 nm in diameter and 150-
200 nm in length. Usually, several nanorods bundle together
due to the hydrophobic interaction. It is believed that the
(Et)
4
N
+
cations (dissociated TEAOH molecules) can adsorb
on the iron oxide hydroxide particles. Thus, the ethyl groups
will protrude out from these surfaces, causing them to be
hydrophobic.
29,30
The increase in the reaction temperature
to 200 °C leads to a significant increase in diameter to 20-
50 nm (Figure 2D). In order to understand the reason for
this change, two control experiments were conducted: two
samples were prepared at 80 and 110 °C, respectively (Figure
3A and B). The nanorods prepared at 80 °C still had small
diameters (Figure 3A). However, for the sample prepared at
110 °C, the diameters of the nanorods increased to 20-50
nm. Upon a closer observation, it was found that some of
the large nanorods were actually composed of several small
nanorods (Figure 3B). It is therefore clear that the increase
in diameter is due to the merging of several smaller nanorods
into a larger one. At high reaction temperatures, the adsorbed
TEAOH molecules on FeO(OH) particles are probably re-
organized or even gradually removed, thus enabling the
merging process. The reaction conducted at a middle
temperature such as 110 °C provides the possibility to detect
intermediates of the merging process.
Thermogravimetric analysis-differential thermal analysis
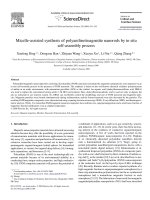
(TGA-DTA), XRD, and FTIR were used to characterize the
as-prepared FeO(OH) and its derived products calcined at
various temperatures (Figures 4-6). The as-prepared iron
oxide product was in the form of FeO(OH) (JCPDS-IC-00-
003-0249), and the calcined sample at 300 °C was identified
as R-Fe
2
O
3
by comparing its XRD pattern with that of the
Fluka R-Fe
2
O
3
(Figure 4, upper line). In the TGA-DTA
curve, the total weight loss was 12.8% up to 300 °C (Figure
5), and two peaks at 71 and 265 °C were observed. This
weight loss is a little higher than that of the weight loss from
FeO(OH) to R-Fe
2
O
3
(10.1%), indicating the existence of
the TEAOH molecules in the FeO(OH) product. The
Figure 1. Influence of the molar ratio of TEAOH/Fe on the morphology
of the FeO(OH) product. The molar ratio was 3/1 (A); 6/1 (B and C); and
12/1 (D). The reaction was conducted at 80 °C for 72 h.
Figure 2. Impacts of the reaction time and temperature on the morphology
of the final FeO(OH) product. In A and B, the TEAOH/Fe ratio was 12/1
and the reaction temperature was 80 °C, but the reaction time was 0.0 h in
A and 0.5 h in B. In C and D, the molar ratio of TEAOH/Fe was the same
as that in A and in B and the reaction time was 24 h, but the reaction
temperature was 40 °C in C and 200 °CinD.
Figure 3. Several FeO(OH) nanorods merged into one larger FeO(OH)
nanorod upon reactions at higher reaction temperatures or longer reaction
time. In A, the reaction was conducted at 80 °C for 15 h, and in B, it was
at 110 °C for 15 h. The molar ratio of TEAOH/Fe was 6/1.
4778 Chem. Mater., Vol. 19, No. 19, 2007 Zhong et al.
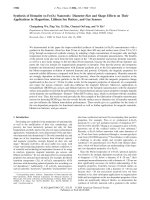
existence of the TEAOH molecules in the FeO(OH) product
was further confirmed by the FTIR spectra (Figure 6), which
showed a weak C-H vibration at 2981 cm
-1
for the samples
calcined below 250 °C. The strong vibrations at 3144, 895,
and 796 cm
-1
are the characteristic vibrations in the FeO-
(OH) product.
36
These peaks disappeared after calcination
at 250 °C, coinciding with the TGA-DTA results, in which
a max peak located at 264.5 °C was observed. At the same
time, we observed a sharp peak at 448 cm
-1
for the sample
calcined at 250 °C (Figure 6), indicating the formation of
the R-Fe
2
O
3
phase.
37
Therefore, both the TGA-DTA and the
FTIR results reveal that the TEAOH molecules existed in
the FeO(OH) product. The TEAOH molecules could facilitate
the hydrolysis of Fe(NO
3
)
3
and bind with the iron oxide
hydroxide particles as well. However, during the hydrother-
mal treatment and the washing procedure, most of the
TEAOH molecules were removed. This is consistent with
the observation in the synthesis of silicate using TEAOH as
the structure director.
29,30
Differing from Bruce’s method
28
in the synthesis of mesoporous iron oxide, the R-Fe
2
O
3
phase
obtained here is free of contamination after the calcination
at 300 °C.
During the reaction, the iron hydroxide particles capped
with structure director molecules probably first assembled
into micellelike structures,
29
which then led to the formation
of the FeO(OH) nanorods. For the formation of the FeO-
(OH) nanorods, both the molar ratio of TEAOH/Fe and the
TEAOH concentration are important. The former should be
higher than 3, and the latter should be above 9 wt %. In one
of our experiments, instead of using a 20 wt % TEAOH
aqueous solution, we useda9wt%TEAOH aqueous
solution. Even though the molar ratio of TEAOH/Fe was
increased to 6, we still failed to obtain FeO(OH) nanorods.
It is well-known that usually there is a minimum concentra-
tion required for the formation of certain micelles;
29b
thus,
most probably a micelle mechanism was involved in the
synthesis. Other important evidence for the formation of the
micelles is that, for the sample structure director, the length
of all prepared FeO(OH) nanorods was in the same range
under various reaction conditions, e.g., at various TEAOH/
Fe ratios and reaction times (see the Supporting Information
SI-1). This is different from the cases for the formation of
CuO, Fe
2
O
3
, and TiO
2
nanorods by assembly of the small
particles one by one, in which the length of the formed
nanorods always increases with the reaction time.
27,38,39
Another role of the TEAOH molecules is to facilitate the
hydrolysis of Fe(NO
3
)
3
. However, it should be pointed out
that even in the absence of the TEAOH molecules, Fe(NO
3
)
3
still can be hydrolyzed, although no nanorods are formed
under the same hydrothermal conditions.
27
The TEAOH
molecules probably also promoted the formation of R-FeO-
(OH), but the reason is still not clear.
Further calcination of the prepared 1D FeO(OH) is
supposed to create some pores in the nanorods by removal
of the residual TEAOH molecules and OH groups.
29
Figure
7A presents the TEM image of the sample calcined at 300
°C. Compared to the smooth surface of the sample without
(36) Socrates, S. Infrared Characteristic Group Frequencies, 2nd ed.; John
Wiley & Sons: New York, 1994; p 74.
(37) Cornell, R. M.; Schwermann, U. The Iron Oxide Structure, Properties,
Reactions, Occurrence and Uses; VCH: Weinheim, 1996.
(38) Zhong, Z.; Ang, T. P.; Luo, J.; Gan, H.; Gedanken, A. Chem. Mater
2005, 17, 6814.
(39) Zhong, Z.; Chen, F.; Ang, T. P.; Han, Y.; Lim, W.; Gedanken, A.
Inorg. Chem. 2006, 45, 4619.
Figure 4. XRD results for the as-prepared FeO(OH) dried at 100 °C that
was previously shown in Figure 3A and its derived products calcined at
various temperatures.
Figure 5. TGA-DTA curves for the as-prepared FeO(OH) dried at 100 °C
that was previously shown in Figure 3A.
Figure 6. FTIR results for the as-prepared FeO(OH) dried at 100 °C that
was previously shown in Figure 3A and its derived products calcined at
various temperatures.
Synthesis of Porous R-Fe
2
O
3
Nanorods Chem. Mater., Vol. 19, No. 19, 2007 4779
annealing (Figures 1-3), the annealed sample (Figure 7A)
possessed a lot of pores within the R-Fe
2
O
3
nanorods, while
still maintaining its 1D morphology. In Figure 7A, a porous
R-Fe
2
O
3
nanorod is marked by two dotted lines. The pores
are 1-5 nm in size and are slightly smaller than the diameter
of the nanorods (it can be seen more clearly in a higher
magnification image in the Supporting Information SI-2).
Different from the pore structures in TiO
2
nanotubes and
carbon nanotubes, these pores are open to the outer surface
and almost isolated from each other. Thus, they should be
very accessible to the small Au particles. After the calcina-
tion, the measured BET surface area increased markedly to
143 m
2
/g from the previous value of 30 m
2
/g for the
uncalcined but degassed sample (Figure 8A). Degassing of
the uncalcined sample at 200 °C still could not remove all
of the residual TEAOH molecules and the OH groups from
the dried 1D FeO(OH) product. Calcination at 300 °C could,
however, achieve the complete removal (Figures 5 and 6).
Deposition of the Au particles on the porous 1D R-Fe
2
O
3
was carried out by employing our invented method, in which
a capping reagent and ultrasonic irradiation were applied.
31-35
The capping reagent (lysine) can effectively prevent the
aggregation of the Au colloids and thus maintain their small
size,
32
while the sonication can facilitate the deposition and
insertion of the small Au particles into the pores.
40-42
As
observed, most of the deposited Au particles were in the
range of 1-5 nm (Figure 7B). Even after the reaction, there
was little change on the Au particle size (Figure 7C).
Interestingly, the surface area of the support catalyst de-
creased to 48 m
2
/g from the previous value of 143 m
2
/g after
the deposition (Figure 8A). Changes in the pore volume are
reflected in Figure 8B for the samples before and after the
calcination, as well as for that of the calcined sample and
after further deposition of the Au particles. The degassed
only, uncalcined sample has small pores that peaked at 2.4
and 3.9 nm, respectively. After calcination, the pore volume
increased markedly for the pores centered at 2.1 and 4 nm,
respectively (Figure 8B). Further deposition of the Au
particles led to the disappearance of the pore at 4 nm and a
significant decrease in the D
v
value for the pore centered at
2.1 nm, indicating that most of the small Au particles were
housed or half-buried in these pores. As indicated in the
literature, the Au particle size of 2-4 nm is critical for the
high catalytic activity of the supported-Au catalysts. For
comparison, we prepared an Au catalyst supported on the
commercially available R-Fe
2
O
3
(Fluka, shown in Figure 7D).
It is seen that very small Au particles were deposited on the
(40) Zhong, Z.; Prozorov, T.; Felner, I.; Gedanken, A. J. Phys. Chem. B
1999, 103, 947.
(41) Gedanken, A.; Tang, X.; Wang, Y.; Perkas, N.; Koltypin, Y.; Laddau,
M. V.; Vradman, L.; Herskowitz, M. Chem.sEur. J. 2001, 7, 4546.
(42) Perkas, N.; Zhong, Z.; Chen, L.; Besson, M.; Gedanken, A. Catal.
Lett. 2005, 103,9.
Figure 7. TEM images for the porous R-Fe
2
O
3
support and the supported-
Au catalysts. In A, the FeO(OH) product was calcined at 300 °C for 0.5 h,
and in B, Au particles were supported on the porous R-Fe
2
O
3
. The image
in C was the supported-Au catalyst shown in B but after the reaction. The
big particles were R-Al
2
O
3
used to dilute the catalyst in the reaction. The
image in D was the supported-Au catalyst on Fluka R-Fe
2
O
3
(black dots
indicated the Au particles in C and D). The FeO(OH) product was prepared
at 80 °C for 10 h with a molar ratio of TEAOH/Fe of 6/1.
Figure 8. Isotherms of N
2
adsorption/desorption (A) and pore volume
changes (B) before creating pores (bottom curves), after creating pores (top
curves), and after deposition of the Au particles in the pores (middle curves).
The pore size created in the 1D nanostructure is in the range of 1.0-5.0
nm and peaked at ca. 2.1 and 4.0 nm, respectively.
4780 Chem. Mater., Vol. 19, No. 19, 2007 Zhong et al.
outer surface of the Fluka R-Fe
2
O
3
particles, as these particles
have hardly any small pores. It should be pointed out that
the Au particle size distributions are similar in the two cases.
Recently, there are several reports published about the Au
particles being deposited on some metal oxides nanorods.
43-46
For example, Idakiev et al.
43
deposited Au particles on TiO
2
nanotubes by the deposition-precipitation method for the
water-gas shift reaction, Gao et al.
44
deposited Au particles
on CeO
2
and Pr
6
O
11
nanorods with an Au particle size above
8 nm, and Shen et al. and Zhong et al.
46
prepared Al
2
O
3
nanorods and deposited very small Au particles on them.
But, there is no evidence that the Au particles with sizes in
the range of 2-4 nm were inserted in the hollow channels
of the supports in these reports, unlike what we have achieved
here.
The catalytic performance of the supported-Au catalysts
for CO oxidation was tested. The supported-Au catalyst on
the porous R-Fe
2
O
3
nanorods has a very high catalytic
activity toward CO oxidation. Complete removal of CO at
30 °C was realized fora3%Au/R-Fe
2
O
3
-nanorod catalyst
at a GHSV of 25 500 h
-1
. In order to eliminate the influence
of the diffusion limitation, we lowered the Au loading in
the catalyst to 0.5 wt % and measured the catalytic activity
at a GHSV above 400 000 h
-1
at 30 °C. The measured
specific activity was 1.11 × 10
-3
mol
CO
‚g
-1
Au
‚S
-1
for the
0.5 wt % Au/R-Fe
2
O
3
-nanorod catalyst (Cat-1), which is
close to the very high activity in the literature,
22
while the
specific activity for the 0.5 wt % Au/R-Fe
2
O
3
-Fluka (Cat-2)
was 3.36 × 10
-4
mol
CO
‚g
-1
Au
‚S
-1
at 30 °C, only
1
/
3
the value
of Cat-1. Under the same conditions, we tested the reference
1wt%Au/R-Fe
2
O
3
purchased from the World Gold Council
(WGC), and its specific activity was ca. 4.87 × 10
-4
mol
CO
‚g
-1
Au
‚S
-1
. Thus, the insertion of the very small Au
particles in the pores enhances the catalytic performance of
the Au catalysts, probably because of an increased contact
between the Au particles and the support.
14
One of the TEM
images of the reacted catalyst is shown in Figure 7C. It is
seen that after the reaction, there is almost no change in Au
particle size.
The measured XPS spectra are shown in Figure 9. In the
two catalysts, the measured binding energies are lower than
that (84.1 eV) of the metallic Au, indicating a slight
negatively charged state of the Au particles. This is consistent
with Goodman and Rousset’s observations,
5-8,47
though
Hutchings et al. and Deevi et al. observed Au cation species
in the Au/Fe
2
O
3
catalysts prepared by the coprecipitation
(CP) method and the DP method, independently.
48,49
In
addition, compared to that of Cat-2, the binding energy of
Au
4f
in Cat-1 is ca. -0.25 eV shifted, though it is not very
significant. There is probably a stronger interaction between
the Au particle and the catalyst support in Cat-1 than in Cat-
2, because in Cat-1 many small Au particles are housed in
the pores, thus having a closer contact with the support. This
is possibly the reason for the higher catalytic activity for
CO oxidation in the first catalyst.
3,15
4. Conclusion
In summary, we have successfully prepared porous
R-Fe
2
O
3
nanorods by the hydrothermal method using TEAOH
as the structure director for the first time. The reaction
temperature and time and the molar ratio of TEAOH/Fe
influence the morphology of the product. The as-prepared
product is R-FeO(OH) nanorods, and it can be converted to
porous R-Fe
2
O
3
nanorods via calcination at 300 °C. The
created pore size is mainly distributed in the range of 1-5
nm and is centered at ca. 2.1 and 4.0 nm, respectively. The
BET surface area measurement confirms that the small Au
particles are inserted in these pores. The prepared Au catalyst
(43) Idakiev, V.; Yuan, Z. Y.; Tabakova, T.; Su, B. L. Appl. Catal. A 2005,
281, 149.
(44) Huang, P. X.; Wu, F.; Zhu, B. L.; Gao, X. P.; Zhu, H. Y.; Yan, T. Y.;
Huang, W. P.; Wu, H.; Song, D. Y. J. Phys. Chem. B 2005, 109,
19169.
(45) Huang, P. X.; Wu, F.; Zhu, B. L.; Li, G. R.; Wang, Y. L.; Gao, X. P.;
Zhu, H. Y.; Yan, T. Y.; Huang, W. P.; Zhang, S. M.; Song, D. Y. J.
Phys. Chem. B 2006, 110, 1614.
(46) (a) Shen, S. C.; Chen, Q.; Chow, P. S.; Tan, G. H.; Zeng, X. T.; Wang,
Z.; Tan, R. B. H. J. Phys. Chem. C 2007, 111, 700. (b) Han, Y. F.;
Zhong, Z.; Kanaparthi, R.; Chen, F. X.; Chen, L. W. J. Phys. Chem.
C 2007, 111, 3163.
(47) Arrii, S.; Morfin, F.; Renouprez, A. J.; Rousset, J. L. J. Am. Chem.
Soc. 2004, 126, 1199.
(48) Khoudiakov, M.; Gupa, M. C.; Deevi, S. Appl. Catal. A 2005, 291,
151.
(49) Hutchings, G. J.; Hall, M. S.; Carley, A. F.; Landon, P.; Solsona, B.
E.; Kiely, C. J.; Herzing, A.; Makkee, M.; Moulijn, J. A.; Overweg,
A.; Fierro-Gonzalez, J. C.; Guman, J.; Gates, B. C. J. Catal. 2006,
242, 71.
Figure 9. XPS spectra of Au4f and Fe2p for the 0.5 wt % Au/R-Fe
2
O
3
-
nanorod (Cat-1) and 0.5 wt % Au/R-Fe
2
O
3
-Fluka (Cat-2) catalysts.
Synthesis of Porous R-Fe
2
O
3
Nanorods Chem. Mater., Vol. 19, No. 19, 2007 4781
exhibits a higher catalytic activity toward CO oxidation than
the Au catalyst supported on a commercially available
R-Fe
2
O
3
Fluka, because of an enhanced interaction between
the Au particles and the porous R-Fe
2
O
3
support.
Acknowledgment. This research was supported by the
Agency for Science, Technology and Research in Singapore
(A-STAR, ICES04-414001). Z.Z. thanks Dr. Frits M. Dautzen-
berg for his helpful advice, Ms. Z. Wang for measuring the
XPS spectra, and Drs. P. K. Wong, Armando Borgna, and Keith
Carpenter for their kind support of this project.
Supporting Information Available: TEM images of 1D FeO-
(OH) formed at 80 °C with various raction times. We also present
HRTEM images of porous and 1D R-Fe
2
O
3
. This material is
available free of charge via the Internet at .
CM071165A
4782 Chem. Mater., Vol. 19, No. 19, 2007 Zhong et al.