dielectrics in electric fields (5)
Bạn đang xem bản rút gọn của tài liệu. Xem và tải ngay bản đầy đủ của tài liệu tại đây (1.53 MB, 35 trang )
DIELECTRIC LOSS
AND
RELAXATION
- II
T
he
description
of
dielectric loss
and
relaxation with emphasis
on
materials
in the
condensed phase
is
continued
in
this chapter.
We
begin with
Jonscher's
universal
law
which
is
claimed
to
apply
to all
dielectric materials. Distinction
is
made here
between dielectrics that show negligible conduction currents
and
those through which
appreciable current
flows by
carrier transport. Formulas
for
relaxation
are
given
by
Jonscher
for
each case. Again, this
is an
empirical approach with
no
fundamental
theory
to
backup
the
observed
frequency
dependence
of s*
according
to a
power law.
The
relatively
recent theory
of
Hill
and
Dissado, which attempts
to
overcome this restriction,
is
described
in
considerable detail.
A
dielectric
may be
visualized
as a
network
of
passive elements
as far as the
external circuit
is
concerned
and the
relaxation
phenomenon analyzed
by
using
the
approach
of
equivalent circuits
is
explained. This
method,
also, does
not
provide
further
insight into
the
physical processes within
the
dielectric, though
by a
suitable choice
of
circuit parameters
we can
reasonably reproduce
the
shape
of the
loss curve. Finally,
an
analysis
of
absorption
in the
optical
frequency
range
is
presented both with
and
without electron damping
effects.
4.1
JONSCHER'S UNIVERSAL
LAW
On
the
basis
of
experimentally observed similarity
of the
co-s"
curves
for a
large number
of
polymers, Johnscher
1
has
proposed
an
empirical "Universal Law" which
is
supposed
to
apply
to all
dielectrics
in the
condensed phase.
Let us
denote
the
exponents
at low
frequency
and
high
frequency
as m and
n
respectively. Here
low and
high frequency
have
a
different
connotation than that used
in the
previous chapter. Both
low and
high
frequency
refer
to the
post-peak
frequency.
The
loss
factor
in
terms
of the
susceptibility
function
is
expressed
as
TM
Copyright n 2003 by Marcel Dekker, Inc. All Rights Reserved.
X
®
2
m
\
where
1/CQi
and
1/ccb
are
well
defined,
thermally activated
frequency
parameters.
The
empirical exponents
m and n are
both less than
one and m is
always greater than
\-n by a
factor
between
2 and 6
depending
on the
polymer
and the
temperature, resulting
in a
pronounced asymmetry
in the
loss curve. Both
m and n
decrease with decreasing
temperature making
the
loss curve broader
at low
temperatures when compared with
the
loss curve
at
higher temperatures.
In
support
of his
equation Jonscher points
out
that
the
low
temperature
p-relaxation
peak
in
many polymers
is
much broader
and
less
symmetrical than
the
high temperature
a-relaxation
peak.
In
addition
to
polymers
the
dielectric loss
in
inorganic materials
is
associated with
hopping
of
charge carriers,
to
some extent,
and the
loss
in a
wide range
of
materials
is
thought
to
follow
relaxation laws
of the
type:
For
co
»
co
p
fiT
(4.2)
For
CD
«
co
p
YYITT
-z']Ka>>»
(4.3)
where
the
exponents
fall
within
the
range
0< m< 1
0<n
The
physical picture associated with hopping charges between
two
localized sites
is
explained with
the aid of
fig.
3-5 of the
previous chapter. This picture
is an
improvement
over
the
bistable model
of
Debye.
A
positive charge
+q
occupying site
i can
jump
to
the
adjacent
site
7
which
is
situated
at a
distance
r
tj
.
The
frequency
of
jumps between
the
two
sites
is the
Debye relaxation
frequency
I/T
D
and the
loss resulting
from
this
mechanism
is
given
by
Debye equation
for
s".
T
D
is a
thermally activated parameter.
TM
Copyright n 2003 by Marcel Dekker, Inc. All Rights Reserved.
In
Jonscher's
model some
of the
localised charge
may
jump over several consecutive
sites leading
to a
d.c. conduction current
and
some over
a
shorter distance; hopping
to
the
adjacent
site becomes
a
limiting case.
A
charge
in a
site
i is a
source
of
potential.
This potential repels charges having
the
same polarity
as the
charge
in
site
i and
attracts
those
of
opposite polarity.
The
repulsive
force
screens partially
the
charge
in
question
and
the
result
of
screening
is an
effective
reduction
of the
charge under consideration.
In
a gas the
charges
are
free
and
therefore
the
screening
is
complete, with
the
density
of
charge being zero outside
a
certain radius which
may be of the
order
of few
Debye
lengths.
In a
solid, however,
the
screening would
not be
quite
as
complete
as in a gas
because
the
localised charges
are not
completely
free
to
move. However,
Johnscher
proposed
that
the
screening would reduce
the
effective
charge
to pq
where
p is
necessarily less than one.
Let us now
assume that
the
charge jumps
to
site
j at
t=0.
The
screening charge
is
still
at
site
/
and the
initial change
of
polarization
is
qr^
The
screening readjusts itself over
a
time
period
T, the
time required
for
this
adjustment
is
visualized
as a
relaxation time,
T.
As
long
as the
charge remains
in its new
position longer than
the
relaxation time
as
defined
in the
above scheme,
(t
<
I
D
),
there
is an
energy loss
in the
system
2
.
The
situation
T >
x
d
is
likely
to
occur more
often,
and
presents
a
qualitatively
different
picture,
though
the end
result will
not be
much
diffferent.
The
screening
effect
can not
follow
instantly
the
hopping charge
but
attains
a
time averaged occupancy between
the
two
sites.
The
electric
field
influences
the
occupancy rate; down-field rate
is
enhanced
and
up-field
occupancy rate
is
decreased.
The
setting
up of the final
value
of
polarization
is
associated with
an
energy loss.
According
to
Jonscher
two
conditions should
be
satisfied
for a
dielectric
to
obey
the
universal
law of
relaxation:
1.
The
hopping
of
charges must occur over
a
distance
of
several
sites,
and not
over
just
adjacent
sites.
2. The
presence
of
screening charge must
adjust
slowly
to the
rapid hopping.
In
the
model proposed
by
Johnscher screening
of
charges does
not
occur
in
ideal polar
substances because there
is no net
charge transfer.
In
real solids, however, both
crystalline
and
amorphous,
the
molecules
are not
completely
free
to
change their
orientations
but
they must assume
a
direction dictated
by the
presence
of
dipoles
in the
vicinity.
Because
the
dipoles have
finite
length
in
real dielectrics they
are
more
rigidly
fixed, as in the
case
of a
side group attached
to the
main chain
of a
polymer.
The
dipoles
act as
though they
are
pinned
at one end
rather than completely
free
to
change
TM
Copyright n 2003 by Marcel Dekker, Inc. All Rights Reserved.
orientation
by
pure orientation.
The
swing
of the
dipole about
its
fixed
end is
equivalent
to the
hopping
of
charge
and
satisfies condition
1 set
above, though less
effectively.
The
essential
feature
of the
universal
law is
that
the
post-peak variation
of
x"
is
according
to eq.
(4.2)
or
superpositions
of two
such
functions
with
the
higher
frequency
component having
a
value
of n
closer
to
unity.
The
exponents
m and
n
are
weakly
dependent
on
temperature, decreasing with increasing temperature. Many polymeric
materials, both polar
and
non-polar, show very
flat
losses over many decades
of
frequency,
with superposed very weak peaks.
This
behavior
is
consistent with
n
«
1,
not
at all
compatible with Debye theory
of
co"
1
dependence. From
eq.
(4.2)
we
note
that,
(4
.
4)
As
a
consequence
of
equation (4.2)
the
ratio
x"/
x'
in the
high
frequency
part
of the
loss
peak remains independent
of the
frequency.
This ratio
is
quite
different
from
Debye
relaxation which gives
x" /
x'
=
COT.
Therefore
in a
log-log presentation
x'
- co and
x"
- co
are
parallel.
For the low
frequency
range
of the
loss peak, equation (4.3) shows that
(4.5)
Xs~X'
2
-
The
denominator
on the
left
side
of
equation (4.5)
is
known
as the
dielectric decrement,
a
quantity that signifies
the
decrease
of the
dielectric constant
as a
result
of the
applied
frequency.
Combining equations (4.2)
and
(4.3)
the
susceptibility
function
given
by
equation
(4.1)
is
obtained.
The
range
of
frequency
between
low
frequency
and
high
frequency
regions
is
narrow
and the fit in
that range does
not
significantly influence
the
representation significantly over
the
entire
frequency
range.
In any
case,
as
pointed
out
earlier, these representations lack
any
physical reality
and the
approach
of
Dissado-
Hill
3
'
4
assumes greater significance
for
their many-body theory which resulted
in a
relaxation
function
that
has
such significance.
Jonscher
identifies
another
form
of
dielectric relaxation
in
materials that have
considerable conductivity. This kind
of
behavior
is
called quasi-dc process
(QDC).
The
frequency
dependence
of the
loss
factor
does
not
show
a
peak
and
raises steadily
towards lower frequencies.
For
frequencies lower than
a
critical frequency,
co
<
co
c
the
complex part
of the
susceptibility
function,
x",
obeys
a
power
law of
type
co
1
'"
1
.
Here
the
TM
Copyright n 2003 by Marcel Dekker, Inc. All Rights Reserved.
real part,
%',
also obeys
a
power
law for frequencies co
<
co
c
,
as
shown
in
fig.
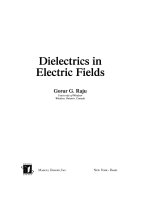
4.1.
Here
co
c
represents threshold
frequency not to be
confused
with
co
p
.
In the low frequency
region
%"
>
%'
and in
this
range
of frequencies the
material
is
highly
lossy.
The
curves
of
l'
and
i"
intersect
at
co
c
.
The
characteristics
for QDC are
represented
as:
%'
oc
j"
oc
co
m
~
l
for
CD
«
co
c
(4.6)
%'
oc
%*
oc
co
n
for
co
»
co
c
(4.7)
To
overcome
the
objection that
the
universal relaxation law, like Cole-Cole
and
Davidson-Cole,
is
empirical, Jonscher proposed
an
energy criterion
as a
consequence
of
equation (4.4)
(4.8)
^
'
W
s
2
in
which
WL is the
energy lost
per
radian
and
W
s
is the
energy stored.
In a
field
of
f\
magnitude
E^
the
energy lost
per
radian
per
unit volume
is
SQ
x"
E
rms
and the
power
lost
is
oE
2
rms
.
The
alternating current
(a.c.)
conductivity
is
<r
ac
=
°te
+
£
Q
<*>Z"
(4-9)
where
cidc
is the
d.c. conductivity. This equation defines
the
relationship between
the ac
conductivity
in
terms
of
%".
We
shall revert
to a
detailed discussion
of
conductivity
shortly.
The
energy criterion
of
Jonscher
is
based
on two
assumptions.
The
first
one is
that
the
dipolar orientation
or the
charge carrier transition occurs necessarily
by
discrete
movements.
Second, every dipolar orientation that contributes
to
%'
makes
a
proportionate contribution
to
%".
Note that
the
right sides
of
equations (4.4)
and
(4.5)
are
independent
of frequency to
provide
a
basis
for the
second assumption. Several
processes such
as the
losses
in
polymers, dipolar relaxation, charge trapping
and QDC
have been proposed
to
support
the
energy criterion. Fig.
(4.1c)
shows
the
nearly
flat
loss
in
low
loss materials. Fig.
4.1(d)
applies
to H-N
equation.
Though
we
have considered materials that show
a
peak
in e" -
logo
curve
the
situation
shown
in
fig.
4.1(c)
demands some clarification.
The
presence
of a
peak implies that
at
frequencies
(co
<
co
p
)
the
loss becomes smaller
and
smaller
till,
at co = 0, we
obtain
s"
=
TM
Copyright n 2003 by Marcel Dekker, Inc. All Rights Reserved.
0,
which
of
course
is
consistent with
the
definition
of the
loss factor (fig.
3.1).
There
are
a
number
of
materials which altogether show
a
different
kind
of
response;
in
these
materials
the
loss factor, instead
of
decreasing with decreasing frequency, shows
a
trend
increasing with lower frequencies
due to the
presence
of dc
conductivity which makes
a
contribution
to
e"
according
to
equation
(4.9).
The
conductivity here
is
attributed
to
partially
mobile, localised charge carriers.
Frequency
(a)
Frequency
(b)
Frequency
(c)
Fig.
4.1
Frequency dependencies
of
"universal"
dielectric response for:
(a)
dipolar system,
(b)
quasi-dc (QDC)
or low
frequency dispersion (LFD) process,
and (c) flat
loss
in
low-loss material
(Das-Gupta
and
Scarpa
5
©
1999, IEEE).
TM
Copyright n 2003 by Marcel Dekker, Inc. All Rights Reserved.
As
opposed
to the
small contribution
of the
free
charge carriers
to the
dielectric
loss,
localized
charge carriers make
a
contribution
to the
dielectric loss
at low
frequencies
that must
be
taken into account. Jonscher
6
discusses
two
different
mechanisms
by
which
localized
charges contribute
to
dielectric relaxation.
In the
first
mechanism, application
of a
voltage results
in a
delayed current response which
is
interpreted
in
terms
of the
delayed
release
of
localized charges
to the
appropriate band where they take part
in the
conduction
process.
If the
localized charge
is an
electron
it is
released
to the
conduction
band.
If the
localized charge
is a
hole, then
it is
released
to a
valence band.
The
second mechanism
is
that
the
localized charge
may
just
be
transferred
by the
applied
field
to
another site
not
involving
the
conduction band
or
valence band. This
hopping
may be
according
to the two
potential well models described earlier
in
section
3.4.
The
hopping
from
site
to
site
may
extend throughout
the
bulk,
the
sites forming
an
interconnected
net
work which
the
charges
may
follow. Some jumps
are
easier because
of
the
small distance between
sites.
The
easier jumps contribute
to
dielectric relaxation
whereas
the
more
difficult
jumps contribute
to
conduction,
in the
limit
the
charge
transfer
to the
free
band being
the
most challenging.
This picture
of
hopping charges contributing both
to
dielectric relaxation
and
conduction
is
considered
feasible
because
of the
semi-crystalline
and
amorphous nature
of
practical
dielectrics. With increasing disorder
the
density
of
traps increases
and a
completely
disordered structure
may
have
an
unlimited number
of
localized levels.
The
essential
point
is
that
the
dielectric relaxation
is not
totally isolated
from
the
conductivity.
Dielectric systems that have charge carriers show
an ac
conductivity that
is
dependent
on
frequency.
A
compilation
of
conductivity data
by
Jonscher over
16
decades leads
to
the
conclusion that
the
conductivity follows
the
power
law
v
ac
=°
dc
+A<D
n
(4.10)
where
A is a
constant
and the
exponent
n has a
range
of
values between
0.6 and 1
depending
on the
material. However there
are
exceptions with
n
having
a
value much
lower than
0.6 or
higher than
one.
A
further
empirical
equation
due to
Hill-Jonscher
which
has not
found
wide applicability
is
7
:
s*
=
e
aa
+(e,-e
aa
)
2
F
l
(m,n,a)T)
(4.11)
where
TM
Copyright n 2003 by Marcel Dekker, Inc. All Rights Reserved.
(4.12)
+a?
and
2
F
is the
Gaussian hypergeometric function.
4.2
CLUSTER APPROACH
OF
DiSSADO-HILL
Dissado-Hill
(1983) view matter
in the
condensed phase
as
having some structural order
and
consequently having some locally coupled vibrations. Dielectric relaxation
is the
reorganizations
of the
relative orientations
and
positions
of
constitutive molecules,
atoms
or
ions. Relaxation
is
therefore possible only
in
materials that possess some
form
of
structural disorder.
Under these circumstances relaxation
of one
entity
can not
occur without
affecting
the
motion
of
other entities, though
the
entire
subject
of
dielectric relaxation
was
originated
by
Debye
who
assumed that each molecule relaxed independent
of
other molecules.
This clarification
is not to be
taken
as
criticism
or
over-stressing
the
limitation
of
Debye
theory.
In
view
of the
inter-relationship
of
relaxing
entities
the
earlier approach should
be
viewed
as an
equivalent instantaneous description
of
what
is
essentially
a
complex
dynamic
phenomenon.
The
failure
to
take into account
the
local vibrations
has
been
attributed
to the
incorrect description
of the
dielectric response
in the
time domain,
as
o
will
be
discussed later
.
The
theory
of
Dissado-Hill
9
has
basis
on a
realistic picture
of the
nature
of the
structure
of
a
solid that
has
imperfect order. They pictured that
the
condensed phase, both solids
and
liquids, which exhibit position
or
orientation relaxation,
are
composed
of
spatially
limited regions over which
a
partially regular structural order
of
individual units
extends. These regions
are
called clusters.
In any
sample
of the
material many clusters
exist
and as
long
as
interaction between them exists
an
array will
be
formed
possessing
at
least
a
partial long range regularity.
The
nature
of the
long range regularity
is
bounded
by
two
extremes.
A
perfectly regular array
as in the
case
of a
crystal,
and a gas in
which
there
is no
coupling, leading
to a
cluster gas.
The
clusters
may
collide without
assimilating
and
dissociating.
These
are the
extremes.
Any
other
structure
in
between
in
the
condensed phase
can be
treated without loss
of
generality with regard
to
microscopic
structure
and
macroscopic average.
In
the
model proposed
by
them, orientation
or
position changes
of
individual units such
as
dipole molecules
can be
accomplished
by the
application
of
electric
field. The
electric
TM
Copyright n 2003 by Marcel Dekker, Inc. All Rights Reserved.
field
is
usually spatially
uniform
over
the
material under study
and
will
influence
the
orientation
or
position
fluctuations, or
both, that
are
also spatially
in
phase. When
the
response
is
linear,
the
electric
field
will
only change
the
population
of
these
fluctuations
and
not
their
nature.
The
displacement
fluctuations may be of two
kinds, inter-cluster
or
intra-cluster.
Each
of
these interactions makes
its own
characteristic contribution
to the
susceptibility
function.
The
intra-cluster (within
a
cluster) movement involves individual dipoles which relaxes
according
to a
exponential
law
(e"^),
which
is the
Debye model.
The
dipole
is
linked
to
other dipoles through
the
structure
of the
material
and
therefore
the
relaxing dipole will
affect
the field
seen
by
other dipoles
of the
cluster.
The
neighboring dipoles
may
also
relax exponentially
affecting
the field
seen
by the first
dipole.
The
overall
effect
will
be
a
exponential single dipole relaxation.
On
the
other hand,
the
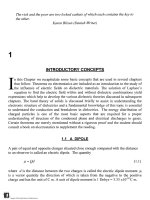
inter-cluster (between
adjacent
clusters) movement will occur
through dipoles
at the
edges
of
neighboring clusters
(Fig.
4.2
10
).
The
inter-cluster motion
has
larger range than
the
intra-cluster motion.
The
structural change that occurs because
of
these
two
types
of
cluster movements results
in a
frequency
dependent response
of the
dielectric properties. Proceeding
from
these considerations Dissado
and
Hill
formulate
an
improved rate equation
and
determine
its
solution
by
quantum
mechanical
methods.
Dipoles
Clusters
(a)
E-Field
Fig.
4.2
Schematic diagram
of (a)
intra-
cluster motion
and (b)
inter-cluster
exchange mechanism
in the
Dissado-Hill
cluster model
for
dielectric relaxation
(Das Gupta
and
Scarpa,
1999)
(with
permission
of
IEEE).
(b)
E-Field
TM
Copyright n 2003 by Marcel Dekker, Inc. All Rights Reserved.
The
theory
of
Dissado
and
Hill
is
significant
in
that
the
application
of
their theory
provides information
on the
structure
of the
material, though
on a
coarse scale.
The
inter-cluster displacement arises
from
non-polar structural fluctuations whereas
the
intra-cluster
motion
is
necessarily dipolar. Highly ordered structures
in
which
the
correlation
of
clusters
is
complete
can be
distinguished
from
materials with complete
disorder.
The
range
of
materials
for
which relaxations have been observed
is
extensive, running
from
covalent, ionic
or Van der
Waal crystals
at one
extreme, through glassy
or
polymer
matrices
to
pure liquids
and
liquid suspensions
at the
other.
The
continued existence
of
cluster
structure
in the
viscous liquid
formed
from
the
glass,
to
above
a
glass
transition
11
has
been demonstrated. Applications
to
plastic crystal
phases
12
and
ferroelectrics
have
also been made.
The
theory
of
Dissado-Hill
should
be
considered
a
major
step
forward
in
the
development
of
dielectric theory
and has the
potential
of
yielding rich information
when
applied
to
polymers.
4.3
EQUIVALENT CIRCUITS
A
real dielectric
may be
represented
by a
capacitance
in
series with
a
resistance,
or
alternatively
a
capacitance
in
parallel with
a
resistance.
We
consider that this
representation
is
successful
if the
frequency
response
of the
equivalent circuit
is
identical
to
that
of the
real dielectric.
We
shall soon
see
that
a
simple equivalency such
as
a
series
or
parallel
combination
of
resistance
and
capacitance
may not
hold true over
the
entire
frequency
and
temperature domain.
4.3.1
A
SERIES EQUIVALENT CIRCUIT
A
capacitance
C
s
in
series with
a
resistance
has a
series impedance given
by
Z,=R,+^—
(4.13)
The
impedance
of the
capacitor with
the
real dielectric
is
Z
=
-
-
-
(4.14)
s'
-js"}
TM
Copyright n 2003 by Marcel Dekker, Inc. All Rights Reserved.
where
C
0
is the
capacitance without
the
dielectric. Since
the two
impedances
are
equal
from
the
external circuit point
of
view
we can
equate equations
(4.13)
and
(4.14).
To
obtain
s'
and
s"
as a
function
of
frequency
we
equate
the
real
and
imaginary parts. This
gives
e'
=
-
&
-
-
(4.15)
2
e
*-
_ _
(416)
2
s
(4.17)
According
to
equation
(4.16)
the
e"-co
characteristics
show
a
broad maximum
at the
radian
frequency
corresponding
to
coC
s
R
s
=
1.
Substituting
C
S
R
S
=
x
the
condition
for
maximum
s"
translates
into
COT
= 1.
i
is the
relaxation time which substitutes
for the
time
constant
in
electrical engineering applications.
Qualitative agreement
of the
shape
of
e"-co
curve with
the
measured dielectric loss does
not
justify
the
conclusion that
the
series equivalent circuit
can be
used
to
represent
all
polar
dielectrics.
We
therefore consider other equivalent circuits
to
obtain
a
comprehensive picture
of the
scope
and
limitations
of the
equivalent circuit approach.
4.3.2
PARALLEL EQUIVALENT
CIRCUIT
A
capacitance
C
p
in
parallel with
a
resistance
R
p
may
also
be
used
as a
equivalent circuit
(fig.
4.3).
The
admittance
of the
parallel circuit
is
given
by
-
(4.18)
The
admittance
of the
capacitor with
the
dielectric
is
given
by
Y
=
ja>C
0
(e'
-
je")
(4.19)
TM
Copyright n 2003 by Marcel Dekker, Inc. All Rights Reserved.
Series
Parallel
—I
Variations
of
$(mes»parali?l
equivalent
Fig.
4.3
Equivalent
circuits
of a
lossy
dielectric.
Equating
the
admittances
and
separating
the
real
and
imaginary parts gives
C
s"
=
tan
8 =
(4.20)
Equation (4.20) shows that
the
s"-co
curve shows
a
monotonic decrease.
It is
clear that
a
wide
range
of
characteristics
can be
obtained
by
combining
the
series
and
parallel
behavior. Table
4.1
gives
the
parameters
for
series
and
parallel equivalent.
Table
4.1
Equivalent circuit parameters
Series circuit
Rs
Parallel equivalent
o)
2
C
2
R
2
tanS
=
Parallel circuit
Rn
Series
equivalent
R
TM
Copyright n 2003 by Marcel Dekker, Inc. All Rights Reserved.
4.3.3
SERIES-PARALLEL CIRCUIT
Fig.
4.3
also shows
a
series-parallel circuit
in
which
a
series branch having
a
capacitance
C
s
and a
resistance
R
s
is in
parallel with
a
capacitance
C
p
.
We
follow
the
same
procedure
to
determine
the
real
and
imaginary parts
of the
complex dielectric constant
c*.
The
admittance
of the
equivalent circuit
is:
(4.21)
Substituting again
C
s
R
s
=
i
the
above equation becomes
^
o)
2
CR
.
_,
jatCs
(4
-
22)
Equating equations (4.22)
and
(4.19)
we
obtain
Y
=
ja>e*C
0
=ja)C
0
(e'-je^
(4.23)
Separating
the
real
and
imaginary parts yields
we
obtain
the
equations:
C C 1
C
0
(4.24)
^TT
(4.25)
From these
two
equations
the
power factor
may be
obtained
as
—
(4.26)
S" COT
8
c.
s
These equations
may be
simplified
by
substituting conditions that apply
at the
limiting
values
of
co.
(a) At
co
= 0,
e"
= 0 and
s'
has a
maximum value given
by
TM
Copyright n 2003 by Marcel Dekker, Inc. All Rights Reserved.
c
c
v_^
A
^^0
(b) As
00—»oo,
s'
approaches
a
minimum value given
by
£
'
=
^T
=
£
«
(4-28)
(c)
The
radian
frequency
at
which
s" is a
maximum
is
given
by
c*
\j
^
/
&
\J
j
ooo
which
yields
=
1
(4.29)
This result shows that
the
equivalent circuit yields
co
max
that
is
identical
to the
Debye
criterion.
Substituting Equations (4.27)
-
(4.28)
in
equations (4.24)
-
(4.26)
we get
ff'^+^-O-^r (4-30)
CO
T
fflT
1 +
CD
T
(4-32)
These
are
identical with Debye equations providing
a
basis
for the use of the
equivalent
circuit
for
polar dielectrics.
The
parameters
of the
equivalent circuit
may be
obtained
by
the
relationships
C*
(4-33)
TM
Copyright n 2003 by Marcel Dekker, Inc. All Rights Reserved.
*„=%-
(4-34)
^o
(
4
-
35
)
We
can
also prove,
by a
similar approach, that
the a
series branch
of
C
s
and
R
s
in
parallel with
R
p
yields
the
Debye equations.
4.3.4
SUMMARY
OF
SIMPLE
EQUIVALENT
CIRCUITS
Fig.
4.4
shows
a few
simple circuits
(I
column),
Z, the
impedance
(II
column),
Y, the
admittance (III column),
C*,
the
complex capacitance
(IV
column)
defined
as
C*
=
C"
- jC' =
£
0
-(£'
-
js")
(4.36)
%',
%"
in the
frequency
domain
(V
column).
The
real
and
imaginary parts
are
plotted
for
Z,
Y, C* as in the
complex plane
plots
13
.
A
brief description
of
each
row is
given
below.
(a)
A
series circuit with
two
energy storage elements
L and C. The
energy
is
exchanged
between
the
inductive
and
capacitive elements
in a
series
of
periodic oscillations that
get
damped
due to the
resistance
in the
circuit. Resonance occurs
in the
circuit when
the
inductive
reactance
X
L
equals
the
capacitive reactance
X
c
and the
circuit behaves,
at the
resonance
frequency,
as
though
it is
entirely resistive.
The
current
in the
circuit
is
then
limited
only
by the
resistance.
In
dielectric studies resonance phenomenon
is
referred
to
as
absorption
and is
discussed
in
greater detail
in
section 4.6.
(b)
A
series
RC
circuit.
X
c
=
1/jwC
decreases with increasing
frequency.
The
Cole-Cole
plots
of Y and C* are
semi-circles
and
Debye relaxation applies. This circuit
has
been
discussed
in
section
4.3.1.
(c)
A
parallel combination
of R and C,
representing
a
leaky capacitor.
The
Cole-Cole
plot
of Z is a
semi-circle while
s"-oo
plot decreases monotonically. This circuit
has
been
analysed
in
section 4.3.2.
(d) A
series
RC
circuit
in
parallel with
a
capacitance,
Coo.
A
series
RC
circuit
has
been
shown
to
exhibit Debye relaxation.
The
capacitance
in
parallel represents
any
frequency
independent process that operates jointly with
the
Debye process.
The
Cole-Cole plot
of
Y
shows
a
upturn
due to the
additional admittance
of the
parallel capacitor.
The
limiting
values
of
capacitance, that
is the
intercept
on the
real axis
are
C+Coo
and
Coo.
The
s"-oo
peak
is
shifted
higher
and the
s'-ro
curve
has a
limiting value
due to
Soo.
TM
Copyright n 2003 by Marcel Dekker, Inc. All Rights Reserved.
(e) A
parallel
RC
circuit
in
series with
a
resistance.
An
inflection
in the
loss
factor
at f
requencies
lower than
co
p
is the
dominant characteristic
of
this circuit.
(f)
A
parallel
RC
circuit
in
series with
a
capacitance.
The
response
is
similar
to
that
shown
in (d)
with
the
Cole-Cole plot showing
a
upturn
due to the
series capacitance
which
'resembles'
a
series barrier.
(g) Two
parallel
RC
circuits
in
series. This
is
known
as
interfacial polarization
and is
considered
in
detail
in the
next section.
The
increase
in c" at
lower frequencies
is
similar
to
(e)
above.
(h) The
last entry
is in a
different
category than
the
lumped elements adopted
in the
equivalent circuits
so
far.
The
so-called transmission line equations
are
derived using
the
concept that
the
circuit parameters,
R, L and C, are
distributed
in
practice.
In the
case
of
dielectric
materials
we can use
only
R and C as
distributed,
as in the
case
of a
capacitor
with
electrodes providing
a
high sheet
resistance
14
.
In one
dimension
let r and c be
resistance
and
capacitance
per
unit length respectively.
The
differential
equations
for
voltage
and
current
at a
distance
x are
(4.37)
dl
=
jcocV(x)dx
(4.38)
Equations (4.37)
and
(4.38) result
in
differential
equations
for V:
d
2
V
,,_
,
dx
2
where
(4.39)
xl/2
core
\
-^J
(4-40)
The
solution
of
equation (4.39)
is
V(x)
=
V
0
(coshAx-BsmhAx)
(4.41)
where
V
0
is the
input voltage
and B is a
constant determined
by the
boundary
conditions.
For an
infinitely
long line
B = 1. The
current
is
given
by
equation (4.37)
as
TM
Copyright n 2003 by Marcel Dekker, Inc. All Rights Reserved.
Circuit
Comments
L
R
T
R
.£
I
^«
C.
C
\
C
Resonance
,\
Debye
"Leaky"
capacitor
Series
barrier
Diffusion
Fig.
4.4
Schematic representations
of the
equivalent simple circuits,
see
text (Jonscher, 1983;
Chelsea Dielectric).
r/
.
\dV
V
0
A,.,
A
,
.
.
I(x)
=
-^—
(sinn
Ax -
cosh
Ax)
r
dx
r
(4.42)
The
input current
I
0
is
obtained
by
substituting
x = 0, as
TM
Copyright n 2003 by Marcel Dekker, Inc. All Rights Reserved.
(4.43)
r
The
input admittance
of an
infinitely
long line
is the
ratio
lo/Vo,
giving
f
V
/2
Y
= — =
{
—
}
co
l/2
(l
+
j)
(4.44)
r
\2rJ
The
Cole-Cole plot
of the
admittance
is a
straight line with
a
slope
of one or
making
an
angle
of
7t/4
with
the
real axis (see column
3, row h in fig.
4.4).
If
there
is a
parallel
dc
conductance
the
line through
the
origin will
be
displaced
to the
right.
The
real
and
complex part
of the
dielectric constant
in the
frequency
domain
are
shown
by the
same
line
with slope
of-1/2
as
shown
in the
last column
of row h. The
dashed upward tilt
at
low
frequencies
is due to the
additional parallel conductance,
if
present. Lack
of
peak
in
this situation
is
particularly interesting.
4.4
INTERFACIAL
POLARIZATION
Interfacial
polarization,
also
known
as
space charge polarization, arises
as a
result
of
accumulation
of
charges locally
as
they
drift
through
the
material.
In
this respect, this
kind
of
polarization
is
different
from
the
three previously discussed mechanisms,
namely,
the
electronic, orientational
and
atomic polarization,
all of
which
are due to
displacement
of
bound charges.
The
atoms
or
molecules
are
subject
to a
locally distorted
electric
field
that
is the sum of the
applied
field and
various distortion mechanisms
apply.
In the
case
of
interfacial polarization large scale distortions
of the field
takes
place.
For
example, charges pile
up in the
volume
or on the
surface
of the
dielectric,
predominantly
due to
change
in
conductivity that occurs
at
boundaries, imperfections
such
as
cracks
and
defects,
and
boundary regions between
the
crystalline
and
amorphous
regions within
the
same polymer. Regions
of
occluded moisture also cause
an
increase
in
conductivity locally, leading
to
accumulation
of
charges.
We
consider
the
classic example
of
Maxwell-Wagner
to
derive
the
s'-co
and
s"-o
characteristics
due to the
interfacial
polarization that exists between
two
layers
of
dielectric materials that have
different
conductivity.
Let
d
}
and
d
2
be the
thickness
of two
materials that
are in
series. Their dielectric constant
and
resistivity
are
respectively
s and
p,
with subscripts
1 and 2
denoting each material (Fig. 4.5).
TM
Copyright n 2003 by Marcel Dekker, Inc. All Rights Reserved.
Fig.
4.5
Dielectrics with
different
conductivities
in
series.
When
a
direct voltage,
V, is
applied across
the
combination
the
voltage across each
dielectric will
be
distributed,
at t = 0+,
according
to
10
C
1+
C
2
(4.45)
v
-v
'20
'
C
l+
C
2
(4.46)
When
a
steady state
is
reached
at t =
oo
the
voltage across each dielectric will
be
R
}
+R
2
;
v.^v-
(4.47)
The
charge stored
in
each dielectric will change during
the
transition period.
At t = 0+
the
charge
in
each layer
will
be
equal;
c c
-Q
-cv -CV - '
2
V
—
V-^IA
—
^*-s
\r
in
—
\~">
r
T/-V
—
r
-S-'.ZU
I
(U
Z
Zv
,^-v
x-»
C,
+C
2
(4.48)
At t =
oo
the
charge
in
each layer will
be
n
-
iiloo
~~
loo
f
R
f
K
'
'
V-
O -CV -
2 2
Y
•>
*Z2aa
—
^2
r
2oo
~~
R
]+
R
2
R
l+
R
2
(4.49)
TM
Copyright n 2003 by Marcel Dekker, Inc. All Rights Reserved.
During
the
transition period
the
change
in the
stored charge
in
each layer
is:
The
redistribution
of
charges within
the
layers occurs
due to
migration
of
charges
and
equations (4.50)
and
(4.51)
show that there will
be no
migration
of
charges
if the
condition
C\
RI
=
C
2
R
2
is
satisfied. Since
Ci
R
t
=
8
0
Sipi
and
C
2
R
2
=
e
0
8
2
p
2
the
condition
for
migration
of
charges translates into
O 1
LJI
~f
Cr
ry
X-^O
\
**
*
*"^
^
/
Let
us
suppose that
the
condition
set by
expression (4.52)
is
satisfied
by the
components
of
the two
layer dielectric.
The
frequency
response
of the
series combination
may be
calculated
by the
method outlined
in the
previous section.
The
admittance
of the
equivalent circuit (fig.
4. 6) is
given
by
Y,Y,
n«=Tr4r
(4-53)
where
(4.54)
(4.55)
2
leading
to
=
cq
where
we
have made
the
substitutions
<?,/?,=!•,;
C
2
R
2
=T
2
(4.57)
TM
Copyright n 2003 by Marcel Dekker, Inc. All Rights Reserved.
We
further
substitute
_
=
1212=}}22
R
{
+R
2
Substituting equations (4.57)
and
(4.58) into (4.56)
and
rationalizing
the
resultant
expression yields
a
rather
a
long
expression:
,
-co
T^T
2
+a>
T(T
}
+T
2
)-
JCOT(\
-
The
admittance
of the
capacitor with
the
real dielectric
is
7 =
jo)
C
0
s*
=
jco
C
0
(s
1
-
js")
(4.60)
where
s* is the
complex dielectric constant
of the
series combination
of
dielectrics.
Equating
the
real
and
imaginary parts
of
(4.59)
and
(4.60)
we get
e'
=
l
-
[(r
'
+r
^)
-r(l-fi>rif
2
)]
(461)
i
ri-^2
+
^1
+
^2)]
(462)
(a)
When
co
= 0
equation (4.61) reduces
to
£'
= £,=
T
^
+
^~
T
(4.63)
C
0
(R
l+
R
2
)
(b) As
co—>oo
^'
=
^=1^
!
(4.64)
T
C
0
(R
l+
R
2
)
TM
Copyright n 2003 by Marcel Dekker, Inc. All Rights Reserved.
c,
h-
Fig.
4.6
Equivalent circuit
for two
dielectrics
in
series
for
interfacial polarization.
R,
R
*
Substituting equations (4.63)
and
(4.64)
in
(4.61)
we get
i
O.,
£
=
£„
+
—*-
(4.65)
A
further
substitution
of
equations (4.63)
and
(4.64) into equation (4.62)gives
£"
=
-O
,2_2
(4.66)
Equation (4.65) gives
the e' - co
characteristics
for
interfacial polarization.
It is
identical
to the
Debye equation (3.28), that
is, the
dispersion
for
interfacial polarization
is
identical with dipolar dispersion although
the
relaxation time
for the
former
could
be
much longer.
It can be as
large
as a few
seconds
in
some heterogeneous materials.
The
relaxation spectrum given
by
equation (4.66)
has two
terms;
the
second term
is
identical
to the
Debye relaxation (equation 3.29)
and at
higher
frequencies
the
relaxation
for
interfacial
polarization
is
indistinguishable
from
dipolar relaxation. However
the
first
term,
due to
conductivity, makes
an
increasing contribution
to the
dielectric loss
as the
frequency
becomes smaller, Fig.
4.7
15
The
complex dielectric constant
of the two
layer dielectric including
the
effects
of
conductivity
is
given
by
'
dc
1 +
JCOT
G)£
0
(4.67)
The
conductivity term
(a
/co)
and not the
conductivity
itself,
increases with decreasing
co.
An
increase
in
absorbed moisture
or in the
case
of
polymers,
the
onset
of
d.c.
conductivity
at
higher temperatures, dramatically increases
the
loss
factor
at
lower
TM
Copyright n 2003 by Marcel Dekker, Inc. All Rights Reserved.
frequencies.
As
stated above,
the
relaxation time
for
interfacial polarization
can be as
large
as a few
seconds
in
heterogeneous
and
semi-crystalline polymers. Such behavior
is
observed
in
polyethylene terephthalate (PET), which
is
semi-crystalline.
Jog(OK)
Conductivity
term
Debye
term
log(C*>t)
Fig.
4.7
Relaxation
spectrum
of a two
layer
dielectric.
The
conductivity
is
given
by a
=
So/Co(Ri+R
2
).
Fig.
4.8
shows
the
measured
e' and e" as a
function
of
frequency
at
various temperatures
in
the
range
150-190°C
16
.
As the
frequency
is
reduced below
-100
Hz
both
e'
and
e"
increase significantly, with
e'
reaching values
as
high
as
1000
at
10"
2
Hz.
This
effect
is
attributed
to the
interfacial polarization that occurs
in the
boundaries separating
the
crystalline
and
non-crystalline regions,
the
former
region having much higher resistivity.
As the
frequency
increases
the
time available
for the
drift
of
charge carriers
is
reduced
and
the
observed increase
in
e'
and e" is
substantially less. Space charge polarization
at
electrodes
is
also considered
to be a
contributing
factor
at low
frequencies
for the
increase
in s'.
The two
layer model with each layer having
a
dielectric constant
of
EI
and
s
2
and
direct
current conductivity
of a
i
and
<5
2
,
in
series,
has
been analyzed
by
Volger
17
.
The
frequency
dependent behavior
of
this model
is
obtained
in
terms
of the
following
equations:
2 2
\+CD
T
(4.68)
In
equation (4.68)
the
following relationships hold:
TM
Copyright n 2003 by Marcel Dekker, Inc. All Rights Reserved.
2 2
+
<*2*2
A
(4.69)
(4.70)
The
inset
of
fig.
4.9
defines
the
quantities
in
equation (4.69).
The
conductivity
and
resistivities
are
also complex quantities
and
their relationships
to
the
same quantities
of the
individual
dielectrics
are
given
by:
t»*
*«*
If'
1
*
**
**
*
**
*
4
a*
#«
«»
»*
**
b
**
«***:.**
•»
«
* A
*
*•*
*
**
is
«
i
is
*
I
(NX)
Fig.
4.8 The (a)
real
and (b)
imaginary part
of the
complex dielectric constant
in PET at
various
temperatures
(Neagu
et.
al.,
1997, with permission
of the
Institute
of
Phys.,
UK)
TM
Copyright n 2003 by Marcel Dekker, Inc. All Rights Reserved.
<r'(a»=
ff
'
+ff
f°?
(4.71)
1
+
r>
2
where
a
=
_4±^L_
(4.72)
s
d
l
+d
Further
we
have
the
following
two
relationships
(4.74)
,2
2
1
+
(4.75)
Fig.
4 9
shows these relationships
and the
similarity between
e'
(CD)
and
p'(o>)
is
evident.
The
relaxation time
for
each process
is
different
and the
relationship between
them
is
given
by the
equation
The
increase
in
dielectric constant,
s',
at low
frequencies
as
shown
in fig. 4.8
cannot
be
attributed
to
conductivity
and the
observed
effect
is
possibly
due to the
accumulation
of
charges
at the
electrodes.
The
real part
of
conductivity,
a',
remains constant
at low
frequencies,
increasing
to a
saturation value
at
high frequencies.
The low
frequency
flat
part
is
almost
equal
to dc
conductivity
and may not be
observed
except
at
high
temperatures.
Fig.
4.10
demonstrates such conductivity behavior.
TM
Copyright n 2003 by Marcel Dekker, Inc. All Rights Reserved.