Báo cáo khoa học: Structural characterization of N-linked oligosaccharides of laminin from rat kidney: changes during diabetes and modulation by dietary fiber and butyric acid pdf
Bạn đang xem bản rút gọn của tài liệu. Xem và tải ngay bản đầy đủ của tài liệu tại đây (1016.4 KB, 13 trang )
Structural characterization of N-linked oligosaccharides of
laminin from rat kidney: changes during diabetes and
modulation by dietary fiber and butyric acid
Adishesha Puneeth Kumar, Chilkunda D. Nandini and Paramahans V. Salimath
Department of Biochemistry and Nutrition, Central Food Technological Research Institute, Mysore, India
Introduction
Changes in oligosaccharide structures are associated
with many physiological and pathological events. The
biochemical role of oligosaccharides in glycoproteins
has been examined for intracellular trafficking, protein-
ase susceptibility, molecular conformation, protein sta-
bility and protein–protein interactions [1]. Laminin has
been shown to be a glycoprotein with N-linked oligo-
saccharides and these oligosaccharides exhibit various
biological functions [2,3]. To date, 74 N-glycosylation
sites in laminin isolated from mouse have been reported
[2]. Fifteen isoforms of laminin have been identified,
wherein kidney laminin belongs to isoform 11 with
alpha-5-, beta-3- and gamma-3-type chains [4].
Laminin in kidney plays an important role in main-
taining the structural integrity of the glomerular base-
ment membrane [5]. During the past decade, the inci-
dence of end-stage renal disease as a result of diabetes
has risen dramatically due to sustained hyperglycemia.
In patients with diabetes, persistent hyperglycemic
status is reported to cause nonenzymatic addition of
carbohydrate moieties to laminin in kidney, resulting
in the formation of advanced glycated end products.
These abnormally glycated proteins create remarkable
shape changes and deformations, which reduce the
ability of laminin to polymerize, leading to compro-
mised interactions between laminin and other basement
Keywords
diabetes; kidney; laminin; MALDI-TOF;
oligosaccharides
Correspondence
P. V. Salimath, Dept. of Biochemistry and
Nutrition, Central Food Technological
Research Institute, Mysore – 570 020,
Karnataka, India
Fax: +91 821 251 7233
Tel: +91 821 251 4876
E-mail:
(Received 14 June 2010, revised 28
September 2010, accepted 26 October
2010)
doi:10.1111/j.1742-4658.2010.07940.x
Carbohydrates of laminin, a family of large multidomain glycoproteins,
have been implicated in various cellular activities including maintaining the
protein structure, its function and also basement membrane integrity. Dur-
ing the course of our investigation, we observed that purified laminin from
kidneys of control, diabetic, and dietary fiber- and butyric acid-treated dia-
betic rats showed differences in binding to extracellular matrix components.
This prompted us to determine whether there are structural changes in lam-
inin oligosaccharides. In this study, we have characterized a few major
N-linked oligosaccharides isolated from purified laminin in various experi-
mental groups, viz. normal, diabetic and diabetic rats fed with dietary fiber
and butyric acid. Sugar composition, as identified by GLC, revealed the
presence of mannose, galactose and N-acetylglucosamine. In order to study
fine structures of the oligosaccharides, N-linked oligosaccharides of laminin
were released by Peptide-N-glycosidase F digestion, end-labeled with
2-anthranilic acid and fractionated by lectin affinity chromatography.
Furthermore, structural elucidation carried out by MALDI-TOF MS ⁄ MS
analysis showed variations in the oligosaccharide sequence of laminin
during diabetes which were altered by the feeding of dietary fiber and
butyric acid.
Abbreviations
2AA, 2-anthranilic acid; FFC, dietary fiber-fed control; FFD, dietary fiber-fed diabetic; FFD-500, dietary fiber-fed diabetic with 500 mg butyric
acid; PGNase-F, Peptide-N-glycosidase F; SFC, starch-fed control; SFD, starch-fed diabetic.
FEBS Journal 278 (2011) 143–155 ª 2010 The Authors Journal compilation ª 2010 FEBS 143
membrane macromolecules [6]. Nonenzymatic glyca-
tion also affects the balance between the synthesis
and degradation of laminin in kidney. We have previ-
ously observed that the laminin content decreases dur-
ing diabetes and the binding property of purified
laminin to various extracellular matrix components
becomes altered (A. P. Kumar, C. D. Nandini & P. V.
Salimath, unpublished data). Hence, for proper func-
tioning of the kidney, maintaining the glomerular base-
ment membrane architecture is crucial, which in turn
depends on the proper structure and function of
matrix proteins, including laminin and its oligosaccha-
ride moieties.
Knowledge about the nature of oligosaccharides pres-
ent in the glycoproteins is crucial for better understand-
ing of its functional aspects [7]. However, structural
characterization of oligosaccharides in glycoproteins is
one of the most difficult challenges and often requires
the application of multiple analytical approaches [8].
MS has become a powerful analytical tool for the struc-
tural characterization of oligosaccharides. Of several
MS techniques, the soft ionization method MALDI-
TOF MS has been used extensively in recent years to
determine oligosaccharide structures [9] and this
approach has proved to be advantageous and also very
sensitive in elucidating the structural sequences of oligo-
saccharides [10]. Derivatization of oligosaccharides at
their reducing end with chromophores or fluorophores
to increase absorption, fluorescence or MS sensitivity
has become a common practice in recent years [11].
Hence, in this study an attempt was made to carry out
the structural elucidation of high mannose containing
N-linked oligosaccharides of laminin from different
experimental groups by facile labeling of oligosaccha-
rides with 2-anthranilic acid (2AA) [7] in conjunction
with MALDI-TOF MS ⁄ MS analysis to obtain their fine
structural details.
Dietary intervention is a potential strategy in the
prevention and treatment of many metabolic disor-
ders, including diabetes [12]. Butyric acid (CH
3
CH
2
CH
2
COOH), a four-carbon short-chain fatty acid is
produced in large amounts from dietary fibers after
their fermentation in the large intestine, along with
other short-chain fatty acids like acetate and propio-
nate [13]. The bioactivities of butyric acid are related
to its ability to modify nuclear architecture and induce
apoptosis, changing the structure of chromatin
through its effect on post-translation modification,
modulation of the activities of key regulatory enzymes
involved in metabolic activities, and also its ability to
regulate the gene expression [13]. Our earlier studies
have shown that supplementing the diet with dietary
fiber and butyric acid was beneficial in ameliorating
the diabetic condition of rats [14]. In this article, we
have tried to determine and explore the changes in N-
linked oligosaccharides of laminin during diabetes and
the likelihood of dietary fiber and butyric acid in mod-
ulating these changes.
Results
Rats experimentally induced with diabetes using strep-
tozotocin were used for the study. Age-matched rats
which were injected with buffer served as controls.
Animals were fed with different experimental diets for
65 days [15]. All diabetic rats were hyperglycemic at
the end of experimental period and, as expected,
showed increased urine output, excretion of sugar and
increase in glomerular filtration rate. Feeding dietary
fiber and butyric acid resulted in the amelioration of
the above parameters to a considerable extent
(Table 1).
Identification of monosaccharides by GLC
As a first step, laminin from rat kidneys from different
experimental groups was purified and purity was ascer-
tained by SDS ⁄ PAGE using silver nitrate staining
(depicted in Fig. S1 for laminin from starch-fed con-
trols as a representative). This showed bands corre-
sponding to 400 and 200 kDa which are characteristic
of laminin. Composition analysis of laminin was car-
ried out in terms of total sugars, amino sugars and sia-
lic acid (Table 2). The monosaccharide composition of
oligosaccharides of laminin was determined by GLC
after acid hydrolysis and was carried out for laminin
purified from starch-fed control (SFC) and starch-fed
diabetic (SFD) groups as a representative.
The results of composition analysis and GLC
revealed the presence of neutral sugars like mannose
and galactose and amino sugar as N-acetylglucos-
amine, along with sialic acid which accounted for 22
and 35% of total carbohydrate content in SFC and
SFD groups, respectively.
Purification of 2AA-labeled oligosaccharides from
different experimental groups
The low yield of laminin from rat kidney cortex necessi-
tated a sensitive method for the purification and subse-
quent characterization of laminin oligosaccharides.
Hence, in this study laminin oligosaccharides, which
were released by Peptide-N-glycosidase F (PNGase-F)
digestion, were tagged with 2AA to increase the sensitiv-
ity of detection. The 2AA-labeled oligosaccharides were
then fractionated using Concanavalin-A–Sepharose
Laminin oligosaccharide changes during diabetes A. P. Kumar et al.
144 FEBS Journal 278 (2011) 143–155 ª 2010 The Authors Journal compilation ª 2010 FEBS
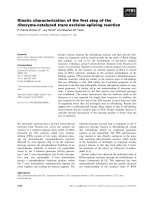
lectin-affinity chromatography. The oligosaccharides
from all the experimental groups that bound to Conca-
navalin-A–Sepharose lectin were eluted as two major
peaks with 0.2 and 0.3 m a-methyl d-glucopyranoside,
which indicated the presence of at least two types of
high mannose containing oligosaccharides in laminin
(Fig. 1). Fractions eluting with 0.4 and 0.5 m
a-methyl d-glucopyranoside were in minor amounts
and so were not taken up for further analysis.
MALDI-TOF MS/MS analysis of purified
oligosaccharide
Affinity-eluted 2AA-derivatized oligosaccharides of
laminin from different experimental groups were fur-
ther analyzed by subjecting them to MALDI-TOF MS.
Each of the fractions showed signals characteristic of
the oligosaccharides. In the control group, the 0.2 m
eluted fraction showed a signal with an m ⁄ z value of
2185 (Fig. 2A) and the 0.3 m eluted fraction had signal
at 3240 (m ⁄ z)(Fig. 3A). In the diabetic group, the 0.2
Table 1. Effect of dietary fiber and butyric acid on fasting blood sugar, urine sugar, urine volume and glomerular filtration rate (GFR) in
diabetic rats. Values are the mean ± SEM of six controls and 10 diabetic rats. SFC, starch-fed control; FFC, dietary fiber-fed control;
SFD, starch-fed diabetic; FFD, dietary fiber-fed diabetic; FFD-500, dietary fiber and butyric acid-fed diabetic.
Group FBS (mgÆdL
)1
) Urine sugar (gÆday
)1
) Urine output (mLÆday
)1
) GFR (mLÆmin
)1
)
SFC 108.45 ± 3.1 0.19 ± 0.01 16.3 ± 3.3 0.83 ± 0.04
SFD 348.61 ± 3.6
a
7.35 ± 0.50
a
73.5 ± 5.3
a
3.98 ± 0.45
a
FFC 106.54 ± 5.2 0.18 ± 0.03 18.3 ± 3.3 1.08 ± 0.05
FFD 264.87± 2.5
b
5.56 ± 0.30
b
55.6 ± 3.4
b
2.48 ± 1.01
b
FFD-500 188.75 ± 2.3
b
4.72 ± 0.20
b
47.2 ± 2.9
b
2.01 ± 0.03
b
a
Statistically significant at P < 0.05 when compared with SFC.
b
Statistically significant at P < 0.05 when compared with SFD.
Table 2. Effect of dietary fiber and butyric acid on total sugar,
amino sugar and sialic acid content of laminin (lgÆ100 lg
)1
protein).
Values are average of duplicate analyses carried out on laminin puri-
fied from pooled control (6) and diabetic (10) rats. SFC, starch-fed
control; FFC, dietary fiber-fed control; SFD, starch-fed diabetic;
FFD, dietary fiber-fed diabetic; FFD-500, dietary fiber and butyric
acid-fed diabetic.
Group Total sugar Amino sugar Sialic acid
SFC 21.91 ± 1.16 2.91 ± 0.31 2.15 ± 0.15
SFD 34.81 ± 1.57 5.11 ± 1.20 3.43 ± 0.23
FFC 21.57 ± 0.67 2.75 ± 0.34 2.18 ± 0.11
FFD 28.14 ± 1.42 4.08 ± 0.53 2.95 ± 0.35
FFD-500 25.74 ± 0.43 3.43 ± 0.44 2.58 ± 0.23
0
111213141
0.2
M
0.2 M
0.3 M
0.2 M
0.3 M
0.2 M
0.3 M
0.3 M
51
Fraction no.
61
1 1121314151
Fraction no.
61
1
1 6 11 16 2621 31 36 4641 5651 61
11 21 31 41 51
Fraction no.
Fraction no.
61
0.05
0.1
A at 333 nm
A at 333 nm
0.15
0.2
AB
CD
0
0.05
0.1
0.15
0.2
0.25
A at 333 nm
A at 333 nm
0
0.05
0.1
0.15
0.2
0.25
0.5
0.4
0.3
0.2
0.1
0
Fig. 1. Purification of 2AA-labeled oligosac-
charides. Oligosaccharides obtained by
PNGase-F digestion were end-labeled
with 2AA and purified on a lectin–agarose
column using
D-glucopyranoside as the eluent.
Elution profiles are shown by horizontal bars
with numbers representing the concentra-
tion of glucopyranoside. (A) Control group
(SFC ⁄ FFC), (B) diabetic group (SFD),
(C) dietary fiber-fed diabetic group (FFD),
(D) dietary fiber and butyric acid-fed group
(FFD-500).
A. P. Kumar et al. Laminin oligosaccharide changes during diabetes
FEBS Journal 278 (2011) 143–155 ª 2010 The Authors Journal compilation ª 2010 FEBS 145
and 0.3 m eluted fractions showed signals with masses
of 3322 (m ⁄ z ) and 3443 (m ⁄ z), respectively (Figs4A
and 5A). Similarly, in the fiber-treated diabetic group
the 0.2 and 0.3 m eluted fractions showed signals with
masses of 2713 (m ⁄ z) and 3119 (m ⁄ z), respectively
(Figs 6A and 7A). Furthermore, the MALDI-TOF
spectrum of 0.2 and 0.3 m eluted fractions in the fiber
plus butyric acid-treated diabetic group showed signals
with masses of 2389 (m ⁄ z)(Fig. 8A) and 2592 (m ⁄ z)
(Fig. 9A), respectively. An attempt was made to
deduce their fine structures by further subjecting them
to MS ⁄ MS.
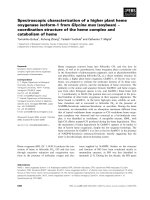
Peak 1 (0.2 m eluted) of the control (SFC) group,
when subjected to MS ⁄ MS with an m ⁄ z value of 2185
split into five fragments with an m ⁄ z values ranging from
566 to 2185 (Fig. 2B). These are due to oligomers of DP-
2[m⁄ z 566 (M + Na
+
+ 2AA)], DP-5 [m ⁄ z 1052 (M +
Na
+
+ 2AA)], DP-7 [m ⁄ z 1376 (M + Na
+
+ 2AA)],
DP-11 [m ⁄ z 2024 (M + Na
+
+ 2AA)] and DP-12 [m ⁄ z
2185 (M + Na
+
+ 2AA)]. peak 2 (0.3 m-eluted) of the
control (SFC) group with an m ⁄ z value of 3240 was split
into six fragments (Fig. 3B) which are identified as oligo-
mers of DP-2 [m ⁄ z 566 (M + Na
+
+ 2AA)], DP-4
[m ⁄ z 890 (M + Na
+
+ 2AA)], DP-8 [m ⁄ z 1620 (M +
Na
+
+ 2AA)], DP-12 [m ⁄ z 2268 (M + Na
+
+ 2AA)],
DP-16 [m ⁄ z 2916 (M + Na
+
+ 2AA)] and DP-18 [m ⁄ z
3240 (M + Na
+
+ 2AA)].
Similarly, peak 1 of the diabetic (SFD) group with an
m ⁄ z value of 3322 was split into eight major fragments
(Fig. 4B) which are identified as oligomers of DP-2 [m ⁄ z
566 (M + Na
+
+ 2AA)], DP-4 [m ⁄ z 889 (M +
Na
+
+ 2AA)], DP-6 [m ⁄ z 1296 (M + Na
+
+ 2AA)],
DP-8 [m ⁄ z 1702 (M + Na
+
+ 2AA)], DP-11 [m ⁄ z 2188
(M + Na
+
+ 2AA)], DP-13 [m ⁄ z 2512 (M +Na
+
+
2AA)], DP-15 [m ⁄ z 2836 (M + Na
+
+ 2AA)], and
DP-18 [m ⁄ z 3323 (M + Na
+
+ 2AA)]. peak 2 of the
diabetic (SFD) group with an m ⁄ z value of 3443 was split
into seven major fragments (Fig. 5B) which are identified
as oligomers of DP-2 [m ⁄ z 566 (M + Na
+
+ 2AA)],
DP-5 [m ⁄ z 1092 (M + Na
+
+ 2AA)], DP-8 [m ⁄ z 1620
(M + Na
+
+ 2AA)], DP-11 [m ⁄ z 2148 (M + Na
+
+
2AA)], DP-14 [m ⁄ z 2633 (M + Na
+
+ 2AA)], DP-16
[m ⁄ z 2956(M + Na
+
+ 2AA)] and DP-19 [m ⁄ z 3443
(M + Na
+
+ 2AA)].
Similarly, peak 1 of the fiber-fed diabetic (FFD)
group with an m ⁄ z value of 2713 was split into six major
fragments (Fig. 6B) which are identified as oligomers of
DP-2 [m ⁄ z 566 (M + Na
+
+ 2AA)], DP-5 [m ⁄ z 1052
(M + Na
+
+ 2AA)], DP-8 [m ⁄ z 1579 (M + Na
+
+
2AA)], DP-11 [m ⁄ z 2064 (M + Na
+
+2AA)], DP-13
0
0
100
200
1000
500 700 900 1100 1300 1500 1700 1900 2100 2300
1500 2000 2500 3000 3500
2185.34
A
B
566.56
1052.43
1376.93
2024.18
2185.84
4000 4500 5000 5500
m/z
m/z
1000
2000
3000
Intens. [a.u.]
Intens. [a.u.]
Fig. 2. Oligosaccharide moieties of laminin
released by PNGase-F. Oligosaccharide moi-
eties were labeled with 2AA and seperated
by lectin–agarose chromatography using
stepwise elution. Eluted oligosaccharides
were then subjected to MALDI-TOF MS ⁄
MS analysis for structural elucidation as
detailed in the Materials and Methods.
MALDI-TOF spectra of peak 1 (0.2
M-eluted)
from the SFC group (A) and its respective
MALDI-TOF MS ⁄ MS spectra (B).
Laminin oligosaccharide changes during diabetes A. P. Kumar et al.
146 FEBS Journal 278 (2011) 143–155 ª 2010 The Authors Journal compilation ª 2010 FEBS
[m ⁄ z 2389 (M + Na
+
+ 2AA)] and DP-15 [m ⁄ z 2713
(M + Na
+
+ 2AA)]. peak 2 of the fiber-fed diabetic
(FFD) group with an m ⁄ z value of 3119 was split into
five major fragments (Fig. 7B) which are identified as
oligomers of DP-2 [m ⁄ z 566 (M + Na
+
+ 2AA)], DP-6
[m ⁄ z 1213 (M + Na
+
+ 2AA)], DP-10 [m ⁄ z 1903 (M +
Na
+
+ 2AA)], DP-13 [m ⁄ z 2471 (M + Na
+
+2AA)]
and DP-17 [m ⁄ z 3119 (M + Na
+
+ 2AA)].
Further, peak 1 of the fiber plus butyric acid-fed
diabetic (FFD-500) group with an m ⁄ z value of 2389
was fragmented into five major fragments (Fig. 8B)
which are identified as oligomers of DP-3 [m ⁄ z 728
(M + Na
+
+ 2AA)], DP-5 [m ⁄ z 1093 (M + Na
+
+
2AA)], DP-7 [m ⁄ z 1417 (M + Na
+
+ 2AA)], DP- 10
[m ⁄ z 1903 (M + Na
+
+ 2AA)] and DP-13 [m ⁄ z 2389
(M + Na
+
+ 2AA)]. peak 2 of the fiber plus butyric
acid fed diabetic (FFD-500) group with an m ⁄ z value
of 2592 was fragmented into four major peaks
(Fig. 9B) which are identified as oligomers of DP-4
[m ⁄ z 890 (M + Na
+
+ 2AA)], DP-8 [m ⁄ z 1579 (M +
Na
+
+ 2AA)], DP-11 [m ⁄ z 2055 (M + Na
+
+ 2AA)]
and DP-14 [m ⁄ z 2592 (M + Na
+
+ 2AA)].
Based on the spectral signals, oligosaccharide struc-
tures were constructed, the proposed structures of
which are given in Table 3.
Discussion
Isolation of single molecular species of oligosaccha-
rides from laminin has remained a challenge because
of their tremendous heterogeneity [16]. In addition,
they are present in tissues such as kidney in minor
amounts, as a result of which large pools of tissues
are required to isolate and characterize them.
Although reports are available on laminin oligosaccha-
rides in Engelbreth–Holm–Swarm tumor cells [17],
information is lacking with respect to kidney laminin.
In pathological conditions such as diabetes, quantita-
tive changes in laminin content have been observed [6]
and our own observations have shown that there is a
difference in binding of laminin purified from control,
diabetic and fiber- and butyric acid-treated groups
towards extracellular matrix components such as
type IV collagen, fibronectin and heparan sulfate (A.
P. Kumar, C. D. Nandini & P. V. Salimath, unpub-
lished data). In this article, therefore, an attempt was
made to isolate and characterize N-linked oligosaccha-
rides which bound to Concanavalin-A–Sepharose from
control and diabetic rat kidney and determine whether
dietary fiber and butyric acid treatment results in
changes in these oligosaccharides. Interest in the
0
0
500
566.91
890.11
1620.47
2268.38
2916.24
3240.14
3240.24
1000 1500 2000 2500 3000 3500
Mass
100
%
1000 1500 25002000 35003000 45004000 5500
m/z
5000
1000
2000
3000
A
B
Intens. [a.u.]
Fig. 3. MALDI-TOF spectra of peak 2
(0.3
M-eluted) from the SFC group (A) and
its respective MALDI-TOF MS ⁄ MS spectra
(B). All other details are as in the legends to
Figs 1 and 2.
A. P. Kumar et al. Laminin oligosaccharide changes during diabetes
FEBS Journal 278 (2011) 143–155 ª 2010 The Authors Journal compilation ª 2010 FEBS 147
complexities of oligosaccharide structure on glycopro-
teins is increasing because of their pivotal functions in
cell adhesion and recognition mechanisms, and their
importance in signal transduction and as markers of
differentiation and carcinogenesis [18]. Hence, studying
the structure of oligosaccharides is crucial in ascertain-
ing their role.
The total carbohydrate content in laminin was
shown to be 32%. Reports of the abundance of car-
bohydrates in laminin differ between the research
groups. Reports of high (30%) [16] and low (12%) [2]
levels of carbohydrates are available. Our report is in
agreement to values reported by Knibbs et al. [16].
Our study showed the presence of only N-acetylglucos-
amine, which is in agreement with the earlier reports
demonstrating that laminin has predominantly
N-linked oligosaccharides [16]. Higher amounts of
total carbohydrates were observed in laminin from dia-
betic groups. This may be because of nonenzymatic
glycation as a result of sustained hyperglycemia [19].
During prolonged hyperglycemia, extracellular matrix
proteins undergo glycosylation through Amadori rear-
rangement, followed by further rearrangement and epi-
merization reactions, which probably involve various
enol intermediates that might lead to the formation of
different hexose isomers [20]. Feeding dietary fiber
with ⁄ without butyric acid resulted in amelioration
which may be a consequence of controlling blood glu-
cose levels (Table 1). Diet, in particular, plays a major
role in the management of diabetes. Butyric acid, a
metabolite of the anaerobic fermentation of dietary
fiber is known to act at the level of gene expression
and has shown great promise as an antidiabetic and
anticancer agent in addition to having various other
biological functions [13].
Analysis by GLC to determine the composition of
oligosaccharides revealed the presence of galactose,
mannose and N-acetylgalactosamine, which is in agree-
ment with the literature [17]. Furthermore, elucidation
of the fine structure was carried out by MALDI-
TOF MS ⁄ MS after labeling with 2AA to aid in increas-
ing the sensitivity of detection. MALDI-TOF MS ⁄ MS
has been proven to be a sensitive method for determin-
ing the structure of oligosaccharide moieties [9]. Sialic
acid was not detected in the oligosaccharides because
MALDI-TOF MS ⁄ MS was carried out in positive
mode, which leads to its decomposition [21]. The oligo-
saccharide structures so proposed revealed presence of
tri- and tetra-antennary structures. Fujiwara et al. [3]
have demonstrated the presence of nine forms of com-
0
100
0
500 1000 1500 2000 2500 3000 3500
Mass
566.26
889.46
1296.35
1701.82
2188.50
2512.26
2836.17
3323.02
%
15001000 2000 2500 3000
3322.14
3500 4000 4500 5000 5500
m/z
1000
2000
3000
A
B
Intens. [a.u.]
Fig. 4. MALDI-TOF spectra of peak 1 (0.2 -
M-eluted) from the SFD group (A) and its re-
spective MALDI-TOF MS ⁄ MS spectra (B).
All other details are as in the legends to Fig-
s 1 and 2.
Laminin oligosaccharide changes during diabetes A. P. Kumar et al.
148 FEBS Journal 278 (2011) 143–155 ª 2010 The Authors Journal compilation ª 2010 FEBS
plex oligosaccharide chains, which differed in anten-
nary and oligo-lactosamine structure, and small
amounts of high mannose-type oligosaccharides which
are further differentiated from laminin isolated from
Engelbreth–Holm–Swarm tumor cells by terminal
galactose and sialic acid residues. The oligosaccharide
moieties reported in our study contained mannose
predominantly followed by galactose. Considerable
alteration in the structures of the oligosaccharide moie-
ties was observed during diabetes (Table 3). Such
structural alterations in oligosaccharide moieties might
lead to functional, mechanical and immunological
alterations, giving rise to the pathological complications
of long-term diabetes. Some of the differences observed
in our result with respect to oligosaccharide structures
may be due to the yield of a unique subpopulation of
laminin oligosaccharides as a result of the different
purification techniques employed as well as the source
of laminin.
For the oligomannose-type structure, the [M +
Na
+
] adduct was primarily observed. Labeling of oli-
gosaccharides with a fluorescent probe like 2AA has
been reported to increase the sensitivity of the tech-
nique by almost threefold [7].
MALDI-TOF MS ⁄ MS spectra of oligosaccharides of
laminin from the SFC group (Figs 2 and 3) showed that,
it contains high mannose-type N-glycans with two puta-
tive structures, Hex
10
HexNAc
2
(peak 1 at m ⁄ z 2185)
and Hex
14
HexNAc
4
(peak 2 at m ⁄ z 3240). Whereas, the
MALDI-TOF MS ⁄ MS spectra of oligosaccharides
released from laminin from the diabetic group showed a
different N-glycan group, Hex
12
HexNAc
6
(peak 1 at
m ⁄ z 3322) (Fig. 4) and Hex
14
HexNAc
5
(peak 2 at m ⁄ z
3443) (Fig. 5), which might point to variation in the
oligosaccharide profiling during diabetic status. Sub-
sequently, the N-glycan structures in the fiber-fed
group were Hex
12
HexNAc
3
(peak 1 at m ⁄ z 2713) (Fig. 6)
and Hex
12
HexNAc
5
(peak 2 at m ⁄ z 3119) (Fig. 7),
and those in the fiber plus butyric acid-treated group
were Hex
10
HexNAc
3
(peak 1 at m ⁄ z 2389) (Fig. 8)
and Hex
10
HexNAc
4
(peak 2 at m ⁄ z 2592) (Fig. 9). The
possible structure of N-glycan of laminin from different
experimental groups as analysed by MALDI-
TOF MS ⁄ MS spectrum is summarized in Table 3.
In this investigation, diabetes results in changes in the
oligosaccharides of laminin. In addition, dietary fiber
and butyric acid were also able to bring about subtle
changes in oligosaccharide structure in laminin during
0
1000
100
0
500 1000 1500 2000 2500 3000 3500
Mass
566.91
1092.83
1620.17
2148.08
2633.24
2956.91
3443.06
%
1500 2000 2500 3000 3500 4000 4500
3443.27
5000 5500
m/z
1000
2000
3000
A
B
Intens. [a.u.]
Fig. 5. MALDI-TOF spectra of peak 2
(0.3
M-eluted) from the SFD group (A) and
its respective MALDI-TOF MS ⁄ MS spectra
(B). All other details are as in the legends to
Figs 1 and 2.
A. P. Kumar et al. Laminin oligosaccharide changes during diabetes
FEBS Journal 278 (2011) 143–155 ª 2010 The Authors Journal compilation ª 2010 FEBS 149
diabetes. It would be interesting to delineate the poten-
tial mechanism by which such changes are brought
about. Feeding dietary materials like fatty acid has been
shown to influence changes in oligosaccharides in brain
microsomes by feeding an n-3-deficient polyunsaturated
fatty acid-deficient or -rich diet, thereby affecting learn-
ing potential. This led the researchers to conclude that
changes may affect membrane functions through
changes in membrane surface physical properties and
reactivity against serotonin [22].
In conclusion, structural analysis of N-linked oligo-
saccharides of laminin using MALDI-TOF MS ⁄ MS
suggests that during diabetes the oligosaccharide
sequences of laminin are altered, thereby likely imping-
ing on its binding to other extracellular components.
Feeding dietary fiber and butyric acid were effective in
bringing about changes in oligosaccharide moieties.
Materials and methods
Materials
Streptozotocin, PNGase-F, 2AA and Sepharose 4B were
from Sigma-Aldrich (St. Louis, MO, USA). Heparin–
Sepharose column matrix was procured from Pharmacia
Biotech (NJ, USA). Glucose and creatinine estimation kits
were from Span Diagnostics (Surat, India). Vitamins, min-
erals and guar gum were from HiMedia Laboratories
(Mumbai, India). Wheat bran was procured from the local
market. All other chemicals and reagents were of analyti-
cal grade.
Animals, induction of diabetes and diet
Diabetes was induced in male Wistar rats weighing 100–
110 g by using streptozotocin (55 mgÆkg
)1
body weight in
0.1 m citrate buffer). The study had prior approval from
the Institutional Animal Ethics Committee. After 3 days,
animals were grouped into SFC and FFC, SFD, FFD and
FFD-500 groups. SFC and SFD groups received AIN-76
basal diet, whereas FFC and FFD groups received AIN-76
diet, wherein starch was replaced with 5% wheat bran
and 2.5% guar gum. Wheat bran had a total dietary fiber
content of 22% (soluble 2%, insoluble 20%) and was rich
in arabinose, xylose and glucose. Guar gum, which is a
good source of soluble fiber, was galactomannan in nature.
Furthermore, the FFD-500 group received butyric acid sup-
plementation at 500 mgÆkg
)1
body weightÆday
)1
in drinking
water.
Isolation of laminin from kidney cortex
Laminin from kidney was isolated according to Paulsson
et al. [23]. Kidneys from individual groups were pooled
0
0
500 1000 1500 2000
565.91
1052.03
1579.07
2064.98
2389.14
2713.12
2500 3000 3500
Mass
100
%
1000 1500 2000 2500 3000
2713.48
3500 4000 4500 5000 5500
m/z
1000
2000
3000
A
B
Intens. [a.u.]
Fig. 6. MALDI-TOF spectra of peak 1
(0.2
M-eluted) from the FFD group (A) and
its respective MALDI-TOF MS ⁄ MS spectra
(B). All other details are as in the legends to
Figs 1 and 2.
Laminin oligosaccharide changes during diabetes A. P. Kumar et al.
150 FEBS Journal 278 (2011) 143–155 ª 2010 The Authors Journal compilation ª 2010 FEBS
before extraction because of the lower amounts of laminin
present. Briefly, kidney cortex was separated and homoge-
nized with 20 vol. of extraction buffer (0.15 m NaCl in
0.05 m Tris ⁄ HCl) containing protease inhibitors (2 mm
phenylmethanesulfonyl fluoride, 2 mm N-ethylmaleimide
and 2 mm benzidine ⁄ HCl). The homogenate was centri-
fuged at 27 000 g for 15 min. The extraction was repeated
twice and supernatant was discarded. The residue left
behind was further extracted using extraction buffer con-
taining 10 mm EDTA. After stirring for 2 h at 4 °C, the
extract was centrifuged at 8000 g for 10 min and the super-
natant solution containing laminin was stored at )20 °C
until further use.
Purification of laminin
Purification of laminin was carried out according to Sak-
ashita et al. [24]. The method employed initial partial purifi-
cation of the crude extract on Sepharose 4B column
followed by affinity purification using heparin–Sepharose
column chromatography.
Partial purification
Partial purification of crude laminin was carried out on a
Sepharose 4B column. The column matrix and sample to
be loaded were initially equilibrated with 10 mm NaCl ⁄ P
i
(pH 7.4) containing protease inhibitors. Sample ( 15 mg
of protein) was loaded onto the column (1 · 35 cm) and
5 mL fractions at a flow rate of 2.5 mLÆmin
)1
were col-
lected. The eluates were monitored at 280 nm. Putative
laminin containing fractions eluting at void volume were
pooled, dialyzed and concentrated.
Purification by heparin–Sepharose
To the pre-equilibrated heparin–Sepharose matrix-contain-
ing column (1 · 5 cm), pooled laminin containing fractions
( 3 mg protein) were loaded and eluted at a flow rate of
10 mLÆmin
)1
. The column was washed with NaCl ⁄ P
i
(three
times the bed volume) and the bound protein was eluted
using NaCl ⁄ P
i
containing 0.15 m NaCl. The eluates were
monitored at 280 nm and protein containing fractions were
pooled, dialysed, concentrated and stored at 4 °Cinthe
presence of protease inhibitors for further studies.
SDS/PAGE of laminin
The purity of laminin was ascertained by 3.5% SDS ⁄ PAGE
and visualized by silver staining for bands corresponding to
400 and 200 kDa.
0
1000
%
0
100
500 1000 1500 2000 2500 3000 3500
Mass
566.01
1213.97
1903.18
2471.14
3119.12
1500 2000 2500 3000
3119.51
3500 4000 4500 5000 5500
m/z
1000
2000
3000
A
B
Intens. [a.u.]
Fig. 7. MALDI-TOF spectra of peak 2
(0.3
M-eluted) from the FFD group (A) and
its respective MALDI-TOF MS ⁄ MS spectra
(B). All other details are as in the legends to
Figs 1 and 2.
A. P. Kumar et al. Laminin oligosaccharide changes during diabetes
FEBS Journal 278 (2011) 143–155 ª 2010 The Authors Journal compilation ª 2010 FEBS 151
GLC analysis
Laminin (100–200 lg) was hydrolyzed with 2 m HCl at
100 °C for 2 h. The hydrolysate was repeatedly co-distilled
with distilled water and reduced using sodium borohydride.
Excess sodium borohydride was destroyed by adding 2 m
acetic acid and again repeatedly co-distilled with methanol
and dried in a dessicator. It was derivatized using acetic
anhydride and pyridine (1 : 1, 1 mL) and processed further
to remove the salts. The derivatized products were taken in
chloroform and analyzed by GLC. The conditions used for
the analysis of neutral and amino sugars are as follows: (a)
for neutral sugars, OV-225 column; column temp, 200 °C;
injection temp: 250 °C; detection temp: 250 °C; N
2
,40mLÆ
min
)1
; (b) for amino sugars, OV-225 column; column temp,
215 °C; injection temp, 250 °C; detection temp, 250 °C; N
2
,
40 mLÆmin
)1
.
Preparation of glycopeptides
Before the digestion, pronase was preincubated with 0.1 m
Tris ⁄ HCl (pH 8.0) buffer containing 2 mm CaCl
2
for 1 h at
50 °C. The enzyme solution was added to laminin (100 lg
as protein) at an enzyme substrate concentration of 1 : 50
and incubated at 50 °C with stirring. This was followed by
the addition of same amount of enzyme at intervals of 24
and 48 h. The digest was placed in a boiling water bath for
5 min to terminate the enzyme activity.
Release of N-linked oligosaccharides
The glycopeptides obtained from pronase digestion were sub-
jected to PNGase-F digestion for the release of oligosaccha-
rides. In brief, to glycopeptides, 4 lL of PNGase-F
(500 000 UÆmL
)1
) was added and incubated in water bath at
37 °C overnight. To the digest, 3 vol. of cold ethanol was
added and allowed to precipitate at room temperature for
5–10 min. The precipitate was centrifuged at 8000 g for
10 min. The supernatant containing oligosaccharides were
collected separately and volume reduced to 10 lL with speed-
vac concentrator.
Derivatization of oligosaccharides with 2AA
Oligosaccharides, obtained as above, were subjected to
2AA labeling for structural elucidation [6]. Before labeling,
the 2AA solution was prepared by dissolving 30 mg 2AA
and 30 mg sodium cyanoborohydride in 100 lL of a solu-
tion containing 4% sodium acetate and 2% boric acid in
methanol.
1000
100
0
500 1000 1500 2000 2500 3000 3500
Mass
728.01
1093.03
1417.42
1903.11
2389.08
%
0
1000
2000
3000
A
B
Intens. [a.u.]
1500 2000 2500 3000
2389.21
3500 4000 4500 5000 5500
m/z
Fig. 8. MALDI-TOF spectra of peak 1
(0.2
M-eluted) from the FFD-500 group (A)
and its respective MALDI-TOF MS ⁄ MS
spectra (B). All other details are as in the
legends to Figs 1 and 2.
Laminin oligosaccharide changes during diabetes A. P. Kumar et al.
152 FEBS Journal 278 (2011) 143–155 ª 2010 The Authors Journal compilation ª 2010 FEBS
To the oligosaccharides obtained, 0.1 mL of the above
2AA solution was added and heated to 85 °C for 45 min.
Tubes were cooled and diluted to 1 mL with 95% aceto-
nitrile–water solution and shaken vigorously. The above
reaction mixture was made up to 1 mL with NaCl ⁄ Tris
with a pinch of sodium azide (TBS-NaN
3
,10mm,pH
7.4).
Purification of oligosaccharide
2AA-labeled oligosaccharides were purified into individual
oligosaccharide fractions by Concanavalin-A–Sepharose lec-
tin-affinity column chromatography.
In brief, 1 mL of labeled oligosaccharides was loaded
onto a Concanavalin-A–Sepharose lectin column, pre-equil-
ibrated with NaCl ⁄ Tris. After passing the sample, column
was washed with twice the bed volume of NaCl ⁄ Tris and
the bound oligosaccharides were stepwise eluted with 0.1–
0.5 m of a-methyl d-glucopyranoside in NaCl ⁄ Tris. Frac-
tions of 1 mL, were collected at a flow rate of 10 mLÆmin
)1
.
The fractions were checked for oligosaccharides using a flu-
orescence spectrophotometer with excitation and emission
set 330 and 420 nm, respectively and oligosaccharide-con-
taining fractions were pooled and concentrated by speedvac
to reduce the volume to 100 lL.
Sample preparation for MALDI-TOF-MS analysis
2AA-labeled oligosaccharides were dissolved in water and
subsequently mixed on the target plate with 2,5-dihydroxy-
benzoic acid (1 mgÆmL
)1
in H
2
O) at a ratio of 1 : 3 as a
matrix. MALDI plate was dried under vacuum and used to
record the mass spectra.
MALDI-TOF MS
Positive-ion mode MALDI-TOF MS analysis of 2AA-
labeled oligosaccharides was performed on a Voyager-DE
(Perseptive Biosystems, MA, USA) instrument operating at
an accelerating voltage of 24 kV (grid voltage 93%, ion guide
wire voltage 0.01%) and equipped with a VSL-337ND-N2
laser. Linear mass scans of samples were recorded over
5000 Da by using a pulse-delay of 90 ns. Recorded data were
processed by using grams ⁄ 38[2]6 software (v. 3.04, Galactic
Industries, Salem, NH, USA).
Analytical methods
Total sugars were estimated by the phenol–sulfuric acid
method [25], sialic acid was estimated by Aminoff’s method
[26], protein content was estimated by Lowry’s method [27]
1000
100
0
500 1000
890.16
1579.05
2055.92
2592.05
2592.71
1500 2000 2500 3000 3500
Mass
%
0
1000
2000
3000
A
B
Intens. [a.u.]
1500 2000 2500 3000 3500 4000 4500 5000 5500
m/z
Fig. 9. MALDI-TOF spectra of peak 2
(0.3
M-eluted) from the FFD-500 group (A)
and its respective MALDI-TOF MS ⁄ MS
spectra (B). All other details are as in the
legends to Figs 1 and 2.
A. P. Kumar et al. Laminin oligosaccharide changes during diabetes
FEBS Journal 278 (2011) 143–155 ª 2010 The Authors Journal compilation ª 2010 FEBS 153
and glucose was estmated by enzymatic GOD-POD kit
method [28].
Statistical analysis
Analyses for changes in basic parameters such as fasting
blood glucose, urine output, urine sugar and glomerular fil-
tration rate were carried out on individual rats in control
(n = 6) or diabetic groups (n = 10). Comparisons were
made between control and diabetic groups by unpaired,
two-tailed Student’s t-test and P < 0.05 was deemed statis-
tically significant.
Acknowledgements
The authors thank Dr V. Prakash, Director, CFTRI,
Mysore, for his kind support and encouragement to carry
out the investigation. The authors also thank Department
of Science and Technology, New Delhi (SP ⁄ SO ⁄ HS-56 ⁄
2002), for Financial Assistance. Puneeth Kumar A,
thanks Indian Council of Medical Research (ICMR),
New Delhi, for the award of Senior Research Fellowship.
References
1 Takahashi M, Takeo T, Ikeda Y, Koichi H & Naoyuki
T (2004) Role of N-glycans in growth factor signaling.
Glycoconj J 20, 207–212.
2 Dean JW, Chandrasekaran S & Marvin LT (1990) A
biological role of the carbohydrate moieties of laminin.
J Biol Chem 265, 12553–12562.
3 Fujiwara S, Shinkai H, Deutzmann R, Paulsson M &
Timpl R (1988) Structure and distribution of N-linked
oligosaccharide chains on various domains of mouse
tumor laminin. Biochem J 252, 453–461.
4 Aumailey M & Neil S (1998) The role of laminins in
basement membrane function. J Anat 193, 1–21.
5 Sasaki T, Fassler R & Hohenester E (2004) Laminin:
the crux of basement membrane assembly. J Cell Biol
164, 959–963.
Table 3. Proposed structure of laminin oligosaccharides from dif-
ferent groups.
Group Mass (m ⁄ z) Composition Proposed structure
Control
group
Peak 1 –
2185.84
Hex
10
HexNAc
2
-AA
Peak 2 –
3240.24
Hex
14
HexNAc
4
-AA
Diabetic
group
Peak 1 –
3323.02
Hex
12
HexNAc
6
-AA
Peak 2 –
3443.06
Hex
14
HexNAc
5
-AA
Dietary
fiber fed
diabetic
Peak 1 –
2713.12
Hex
12
HexNAc
3
-AA
Peak 2 –
3119.12
Hex
12
HexNAc
3
-AA
Dietary fiber
plus butyric
acid fed
diabetic
group
Peak 1 –
2389.08
Hex
10
HexNAc
3
-AA
Table 3. (Continued).
Group Mass (m ⁄ z) Composition Proposed structure
Peak 2 –
2592.05
Hex
10
HexNAc
4
-AA
= Mannose; = Galactose; = N-acetylglucosamine; = 2-anth-
ranilic acid.
Laminin oligosaccharide changes during diabetes A. P. Kumar et al.
154 FEBS Journal 278 (2011) 143–155 ª 2010 The Authors Journal compilation ª 2010 FEBS
6 Abrass CK, Spicer D, Berfield AK, St. John PL &
Abrahamson DR (1997) Diabetes induced changes in
glomerular development and laminin-beta 2 (s-laminin)
expression. Am J Pathol 151, 1131–1140.
7 Anumula KR & Dhume ST (1998) High resolution and
high sensitivity methods for oligosaccharide mapping
and characterization by normal phase high performance
liquid chromatography following derivatization with
highly fluorescent anthranilic acid. Glycobiology 8, 685–
694.
8 Charuwan T, Kevin GR, Toida T & Linhardt RJ
(2004) Liquid chromatography ⁄ mass spectrometry
sequencing approach for highly sulfated heparin derived
oligosaccharides. J Biol Chem 279, 2608–2615.
9 Morelle W, Slomianny M, Diemer H, Schaeffer C,
Alain VD & Michalski J (2005) Structural characteriza-
tion of 2-aminobenzamide derivatized oligosaccharides
using a matrix-assisted laser desorption ⁄ ionization two-
stage time-of-flight tandem mass spectrometer. Rapid
Commun Mass Spectrom 19, 2075–2084.
10 Tosifusa T, Megumi N, Yamada M, Nishine T, Torii
T, Ikenaka K, Hashimoto R & Mayumi M (2009)
Glycoproteomic analysis of abnormal N-glycosylation
on the kappa chain of cryocrystalglobulin in a patient
of multiple myeloma. J Electrophor 53, 1–6.
11 Shen X & Perrault H (1998) Characterization of
carbohydrates using a combination of derivatization,
high-performance liquid chromatography and mass
spectrophotometry. J Chromatogr A 811, 47–59.
12 Zhanguo G, Jun Y, Zhang J, Robert EW, Martin RJ,
Lefevre M, William TC & Jianping Y (2009) Butyrate
improves insulin sensitivity and increases energy expen-
diture in mice. Diabetes 58, 1509–1517.
13 Smith JG, Yokoyama WH & German JB (2000) Butyric
acid from the diet: actions at the level of gene expres-
sion. Crit Rev Food Sci 38, 259–297.
14 Chethan Kumar M, Rachappaji KS, Nandini CD,
Sambaiah K & Salimath PV (2002) Modulatory effect
of butyric acid – a product of dietary fiber fermentation
in experimentally induced diabetic rats. J Nutr Biochem
13, 522–527.
15 Kumar AP, Chougala M, Nandini CD & Salimath
PV (2010) Effect of butyric acid supplementation on
serum and renal antioxidant enzyme activities in
streptozotocin induced diabetic rats. J Food Biochem
34, 15–30.
16 Knibbs RN, Perini F & Goldstein IJ (1989) Structure
of the major Concanavalin A reactive oligosaccharides
of the extracellular matrix component laminin. Biochem-
istry 28, 6379–6392.
17 Arumugham RG, Hsieh TCY, Tanzer ML & Laine RA
(1986) Structure of the aspargine-linked sugar chains of
laminin. Biochim Biophys Acta 883, 112–126.
18 Kim YS (2004) Altered glycosylation of mucin glyco-
protein in colonic neoplasia. J Cell Biochem 50, 91–96.
19 Charonis AS & Tsilibary EC (1992) Structural and
functional changes of laminin and type IV collagen
after nonenzymatic glycation. Diabetes 41, 49–51.
20 Krishnamoorthy R, Cahour A, Elion J, Hartmann L &
Labie D (1983) Monosaccharides bound to hemoglobins
in normal and diabetic individuals. Eur J Biochem 132,
345–350.
21 Masahiko O (2001) A comparative study on structural
elucidation of sialyl oligosaccharides by mass spectrom-
etry with fast atom bombardment, electrospray inoniza-
tion, and matrix laser desorption ⁄ ionization. Biosci
Biotechnol Biochem 65, 2519–2527.
22 Yoshida S, Miyazaki M, Zhang QZ, Sakai K, Fujimoto
I, Ikenaka K, Ikemoto A, Watanabe S & Okuyama H
(2001) Changes of oligosaccharides of rat brain micro-
somes depending on dietary fatty acids and learning
task. J Neurosci Res 63, 185–195.
23 Paulsson M & Saladin K (1989) Mouse heart laminin:
purification of the native protein and structural compar-
ison with Engelbreth–Holm–Swarm tumor laminin.
J Biol Chem 264, 18726–18732.
24 Sakashita S, Engvall E & Ruoslahti E (1980) Basement
membrane glycoprotein laminin binds to heparin. FEBS
Lett 116, 243–246.
25 McKelvy JF & Lee YC (1969) Microheterogeneity of
the carbohydrate group Aspergillus oryzae a-amylase.
Arch Biochem Biophys 132, 99–110.
26 Aminoff D (1961) Methods for quantitative estimation
of N-acetylneuraminic acid and their application to
hydrolysate of sialomucoids. Biochem J 81, 384–392.
27 Lowry OH, Rosebrough NJ, Farr AL & Randall RJ
(1951) Protein measurement with folin phenol reagent.
J Biol Chem 193, 262–272.
28 Hugget ASG & Nixon DA (1957) Use of glucose oxidase,
peroxidase and O-dianisidine in the determination of
blood glucose and urinary glucose. Lancet 273, 366–370.
Supporting information
The following supplementary material is available:
Fig. S1. SDS ⁄ PAGE profile of purified laminin.
This supplementary material can be found in the
online version of this article.
Please note: As a service to our authors and readers,
this journal provides supporting information supplied
by the authors. Such materials are peer-reviewed and
may be re-organized for online delivery, but are not
copy-edited or typeset. Technical support issues arising
from supporting information (other than missing files)
should be addressed to the authors.
A. P. Kumar et al. Laminin oligosaccharide changes during diabetes
FEBS Journal 278 (2011) 143–155 ª 2010 The Authors Journal compilation ª 2010 FEBS 155