Báo cáo khoa học: A systems biological approach suggests that transcriptional feedback regulation by dual-specificity phosphatase 6 shapes extracellular signal-related kinase activity in RAS-transformed fibroblasts pptx
Bạn đang xem bản rút gọn của tài liệu. Xem và tải ngay bản đầy đủ của tài liệu tại đây (308.61 KB, 12 trang )
A systems biological approach suggests that
transcriptional feedback regulation by dual-specificity
phosphatase 6 shapes extracellular signal-related kinase
activity in RAS-transformed fibroblasts
Nils Blu
¨
thgen
1,2
, Stefan Legewie
1
, Szymon M. Kielbasa
3
, Anja Schramme
2
, Oleg Tchernitsa
2
,
Jana Keil
2
, Andrea Solf
2
, Martin Vingron
3
, Reinhold Scha
¨
fer
2
, Hanspeter Herzel
1
and
Christine Sers
2
1 Institute for Theoretical Biology, Humboldt University, Berlin, Germany
2 Laboratory of Molecular Tumor Pathology, Charite
´
, Universita
¨
tsmedizin Berlin, Germany
3 Computational Biology, Max Planck Institute for Molecular Genetics, Berlin, Germany
The mitogen-activated protein kinase cascade (MAPK)
activating extracellular signal-related kinase ERK1 and
ERK2 controls crucial cell fate decisions such as differ-
entiation, proliferation and malignant transformation.
Quantitative differences in signal strength or signal
duration result in specific cell fates, e.g. either prolifer-
ation or differentiation [1]. The activity of ERK1,2 is
regulated through a balance of stimulation through
Keywords
dual-specificity phosphatase; mathematical
modelling; mitogen activated protein kinase;
transcriptional feed-back
Correspondence
N. Blu
¨
thgen, Institute of Pathology,
Universita
¨
tsmedizin Charite
´
, FORSYS junior
group, Chariteplatz 1, D-10117 Berlin
Fax: +49 30 450 536 909
Tel: +49 30 450 536 134
E-mail:
Database
The mathematical model described here has
been submitted to the Online Cellular
Systems Modelling Database and can be
accessed at />base/bluthgen/index.html free of charge
(Received 10 July 2008, revised 8
November 2008, accepted 8 December
2008)
doi:10.1111/j.1742-4658.2008.06846.x
Mitogen-activated protein kinase (MAPK) signaling determines crucial cell
fate decisions in most cell types, and mediates cellular transformation in
many types of cancer. The activity of MAPK is controlled by reversible
phosphorylation, and the quantitative characteristics of MAPK activation
determine the cellular response. Many systems biological studies have
analyzed the activation kinetics and the dose–response behavior of the
MAPK signaling pathway. Here we investigate how the pathway activity is
controlled by transcriptional feedback loops. Initially, we predict that
MAPK signaling regulates phosphatases, by integrating promoter sequence
data and ontology-based classification of gene function. From this, we
deduce that MAPK signaling might be controlled by transcriptional nega-
tive feedback regulation via dual-specificity phosphatases (DUSPs), and
implement a mathematical model to further test this hypothesis. Using
time-resolved measurements of pathway activity and gene expression, we
employ a model selection approach, and select DUSP6 as a highly likely
candidate for shaping the activity of the MAPK pathway during cellular
transformation caused by oncogenic RAS. Two predictions from the model
were confirmed: first, feedback regulation requires that DUSP6 mRNA
and protein are unstable; and second, the activation kinetics of MAPK are
ultrasensitive. Taken together, an integrated systems biological approach
reveals that transcriptional negative feedback controls the kinetics and the
extent of MAPK activation under both physiological and pathological
conditions.
Abbreviations
CREB, cAMP response element binding protein; DUSP, dual-specificity phosphatase; ERK, extracellular signal-related kinase; FDR, false
discovery rate; IPTG, isopropyl-thio-b-
D-galactoside; IR, inducible RAS; MAPK, mitogen-activated protein kinase; MEK, mitogen-activated
protein kinase ⁄ extracellular signal-related kinase kinase; PDGF, platelet-derived growth factor; siRNA, small intefering RNA; SRF, serum
response factor.
1024 FEBS Journal 276 (2009) 1024–1035 ª 2009 The Authors Journal compilation ª 2009 FEBS
upstream kinases [MAPK ⁄ ERK (MEK)1,2] and inhibi-
tory actions, namely dephosphorylation through spe-
cific phosphatases. Most experimental and theoretical
approaches have focused on the biochemical mecha-
nisms and on the spatiotemporal ordering mediating
ERK1,2 activation. These approaches lead to the
assumption that simply inhibiting MEK1,2 or ERK1,2
using therapeutic small-molecule inhibitors would be
sufficient to suppress pathway activation and thereby
reverse downstream biological responses such as
immune function, mitogenesis or even malignant cell
growth. However, many inhibitors directly targeting
MEK or upstream kinases have produced unpredict-
able cellular and clinical responses [2].
The MAPK signaling network has been investigated
by mathematical modeling for more than a decade
[3–5]. The input–output relationships of the MAPK
cascade have been intensively studied by mechanistic
modeling. Studies in Xenopus oocyctes have suggested
that the cascade-like structure and double phosphory-
lation of MEK and ERK give rise to a nonlinear
sigmoidal response [6]. Moreover, the influence of
post-translational feedback loops on the dynamic
behavior of this signaling cascade has been unveiled,
and it was found that there are positive and negative
feedbacks, depending on the cellular context [7]. Posi-
tive feedback has been shown to increase the sensitivity
of the stimulus–response relationships. It may even
cause bistability, where the state of signaling may
depend on whether the pathway has been stimulated
earlier [8]. In contrast, negative MAPK feedback
allows the MAPK cascade to return to lower activity,
even if upstream signaling persists, and therefore to
adapt to prolonged extracellular stimulation [9]. If the
signaling pathway is very sensitive, negative feedback
can bring about oscillations. This has been postulated
by Kholodenko for MAPK signaling [10], and was
recently observed experimentally [11].
So far, the consequences of transcriptional feedbacks
in MAPK signaling have not been addressed in detail.
Currently, the majority of biological information on
negative regulation of MEK ⁄ ERK signaling is derived
from studies on mouse, chicken and zebrafish develop-
ment [12–15]; the relevance in adult animals is less
clear. These studies revealed an essential role for the
ERK-specific dual-specificity phosphatase DUSP6 in
development, and showed that it acts downstream of
the fibroblast growth factor receptor to inhibit the
ERK response. Previous mathematical models were
focused on the control of ERK activation by
hormones at short time scales of < 60 min, and the
concentrations of the proteins were assumed to be con-
stant and independent of transcriptional changes.
However, many important cell fate decisions and cellu-
lar transformations are slow processes that require
long-term MAPK activation and subsequent altera-
tions in gene expression [16,17]. Downstream of ERK,
numerous transcription factors become activated in
sequential transcriptional cascades. It is believed that
distinct combinations of transcription factors give rise
to a specific cellular response [18,19]. In attempts to
predict the transcription factors that are functionally
involved in certain ERK-dependent processes, even
sophisticated methods, including combinatorial
approaches or the analysis of phylogenetic conserva-
tion of potential regulatory sites, have proven unsatis-
factory [20]. Therefore, the transcriptional response
was only rarely taken into account in modeling
approaches addressing ERK1,2 signaling, and the role
of individual transcription factors targeted through
MEK ⁄ ERK signaling was not included.
Here we aim at identifying feedback adaptation
mechanisms within the MEK ⁄ ERK signaling cascade
by first scanning MAPK target genes for potential
functions in MAPK signaling. Candidate transcrip-
tional feedback loops are then further analyzed using a
semiquantitative mathematical model of MAPK signal-
ing that incorporates changes in the transcriptome.
This approach allows us to identify transcriptional
feedback loops that may be important in cellular trans-
formation and for cell fate decisions.
The mathematical model described here has been
submitted to the Online Cellular Systems Modelling
Database and can be accessed at chem.
sun.ac.za/database/bluthgen/index.html free of charge.
Results
Transcription factors downstream of ERK are
predicted regulators of phosphatase function
The genome-wide prediction of target genes of a partic-
ular transcription factor is far from being reliable [21].
Therefore, we developed and validated a function-ori-
ented approach to predict target genes responding to
ERK activation [22]. Instead of screening promoter
sequences for transcription factor binding sites and pre-
dicting target genes directly, we asked which cellular
functions are regulated by a specific transcription factor
or combinations thereof. Once a set of defined tran-
scription factors was identified, transcriptional targets
were predicted and further tested for enrichment in
annotated functions as described by gene ontology
[22]. We applied this algorithm to serum response fac-
tor (SRF) and cAMP response element binding protein
(CREB), two central transcription factors downstream
N. Blu
¨
thgen et al. Transcriptional feedback in ERK signaling
FEBS Journal 276 (2009) 1024–1035 ª 2009 The Authors Journal compilation ª 2009 FEBS 1025
of ERK [23]. Our algorithm identified the terms
‘protein amino acid dephosphorylation’ and ‘dephos-
phorylation’ as the only terms that are significantly
enriched within the group of putative SRF ⁄ CREB
target genes (P
FDR
< 0.05, where FDR is false discov-
ery rate). Therefore, we speculated that phosphatases
might feed back into MAPK signaling. Good candi-
dates for such feedback mechanisms are the classical
DUSPs, a family of phosphatases that specifically
dephosphorylate MAPKs [24]. Therefore, we collected
evidence that DUSPs are regulated by these two tran-
scription factors. A recent chromatin-immunoprecipia-
tion on chip (ChIP-on-chip) experiment demonstrated
that the promoters of DUSP1, DUSP3, DUSP4,
DUSP6 and DUSP11 are directly bound by CREB
[25], suggesting a direct involvement of CREB in their
transcriptional regulation. To further confirm SRF-
dependent DUSP regulation experimentally, we tested
the effect of SRF silencing on DUSP4 and DUSP6
expression. After transient transfection of HRAS-trans-
formed immortalized human embryonal kidney cells
[26] with two independent small intefering RNAs (siR-
NAs) specifically targeting the SRF gene, we analyzed
SRF, DUSP4 and DUSP6 mRNAs by real-time PCR.
Transfection of the cells with SRF-specific siRNAs sup-
pressed SRF expression itself, but also that of the two
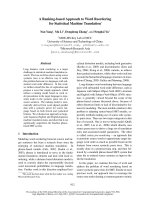
phosphatase genes, after 96 h (Fig. 1). These results
largely confirm our prediction of a strong impact
of SRF on DUSP regulation, and suggest that
ERK might regulate its own activity by inducing phos-
phatases, at least under certain biological conditions.
Model selection suggests that DUSP6 is induced
and modulates ERK activity
Having identified putative direct links between MAP-
Ks, the transcription factors SRF and CREB and the
regulation of DUSPs, we aimed at investigating
whether the regulation of these phosphatases consti-
tutes feedback loops that modulate MAPK activation
in vivo. Experimental evidence indicated that many
receptor-mediated stimuli cause rapid adaptation and
desensitization of the receptors and of signaling mole-
cules by post-translational modifications and receptor
internalization [27]. Thus, it is impossible to distinguish
feedbacks due to the transcriptional regulation of
phosphatases from feedbacks due to receptor deactiva-
tion when the cells are stimulated at the level of the
receptors. Consequently, we decided to stimulate the
canonical MAPK cascade using RAS constructs
encoding mutationally activated RAS proteins that
signal constitutively without requiring receptor activa-
tion. In immortalized rat fibroblasts, expression of
oncogenic RAS (H-RAS
V12
) elicits prolonged activa-
tion of ERK and cellular transformation [17].
To investigate the dynamic implications of a putative
DUSP-mediated feedback, we used an inducible onco-
genic H-RAS
V12
gene construct controlled by an isopro-
pyl-thio-b-d-galactoside (IPTG)-sensitive promoter
[28]. After addition of IPTG to the medium, the cells
express oncogenic RAS [29]. We monitored RAS
expression and ERK phosphorylation by western blot,
and the transcriptional levels of several DUSPsby
interrogating custom microarrays [30] and by northern
blots in a time-resolved manner (Fig. 2A,B). The RAS
protein is strongly induced and accumulates through-
out the measurement period, whereas ERK is initially
strongly activated, then declines, and is subsequently
maintained at an intermediate level of activation.
Among several DUSPs, the relatively unspecific
DUSP1 and the ERK-specific DUSP6 show rapid
induction. Therefore, both are likely candidates for
negatively regulating ERK activity and causing the
biphasic response of ERK activation. To further
DUSP4 mRNA
0
0.4
0.8
1.2
0
0.4
0.8
1.2
0
0.04
0.08
0.12
DUSP6 mRNA
SRF mRNA
SRF 1
SRF 2
SCR 1
SCR 2
SCR 3
MOCK 1
siRNA
ExpressionExpressionExpression
Fig. 1. Expression of DUSP4 and DUSP6 depends on SRF. Real-
time PCR analysis of SRF, DUSP4 and DUSP6 mRNA expression
96 h following transfection with siRNAs suppressing SRF. Two
independent SRF siRNAs (SRF_1 and SRF_2) were used, and three
scrambled siRNAs (SRC1 ⁄ 2 ⁄ 3) were used as controls. Reactions
for SRF, DUSP4 and DUSP6 were performed, and the cycle thresh-
old (CT) values are depicted. All reactions were normalized to
relative levels of tubulin as an internal standard.
Transcriptional feedback in ERK signaling N. Blu
¨
thgen et al.
1026 FEBS Journal 276 (2009) 1024–1035 ª 2009 The Authors Journal compilation ª 2009 FEBS
explore this hypothesis, we quantified time-resolved lev-
els of RAS and phosphorylated ERK proteins by wes-
tern blot, and of DUSP6 and DUSP1 mRNA by
northern blot, and fitted different mathematical models
to the data. The induction kinetics of RAS in the
experimental system varied from time-series experiment
to time-series experiment. It is therefore important that
we used both mRNA and protein samples from the
same experimental time-series experiments for model
construction and fitting, and did not use the microarray
data, which came from a different experimental run.
We applied a model selection process based on the
likelihood ratio test [31]. Briefly, for each of the models
investigated, the best fit of the model to the data was
obtained by a maximum likelihood method. The good-
ness of fit was quantified by calculating the v
2
-value,
i.e. the sum of the squared differences between data
and model fit divided by the variance of the data. A
more complex model can fit better, because it describes
the system better, or because it fits the experimental
error (also called overfitting). In order to discriminate
between these two scenarios, we calculated P-values
that quantified the probability that a model fits the
data better just because the alternative model fits the
noise better. These P-values were estimated using a
Monte Carlo method (for details, see Appendix S2 and
[32]). Using this approach, we can determine whether
adding additional molecular processes to the model or
assuming different mechanisms in the model improves
the description of data just because the model has more
degrees of freedom, which would lead to model rejec-
tion. If the new molecular steps are essential to the
model, the model will be accepted.
We first constructed two mathematical models: one
model describing ERK activation with DUSP6-medi-
ated ERK dephosphorylation and another model with-
out (Fig. 3A,B). We found that DUSP6-mediated
ERK dephosphorylation is indeed required for the
model to properly describe the data, as otherwise the
biphasic response in ERK phosphorylation cannot be
ERK
P
P
ERK
RAS
DUSP6
DUSP6
0
1
2
RAS
0
1
2
ERKpp
05
10 15 20
Time (h)
0
1
2
DUSP6
IPTG
0
1
2
RAS
0
1
2
ERKpp
0 5 10 15 20
Time (h)
0
1
2
DUSP6
western blot
western blot
northern blot
0
AB
CD
2468
Time (h)
Expression (AU)
DUSP6
DUSP1 DUSP5
DUSP9
Array
Northern blot
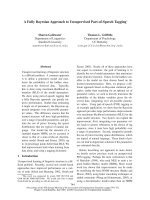
Fig. 2. Model construction from time-series data. (A) After induction of oncogenic RAS, several DUSPs are transcriptionally regulated, as
detected by microarrays (gray) and northern blots (black). DUSP6, a very specific phosphatase for ERK, is rapidly upregulated after induction.
(B) Quantified western blot and northern blot time series show that RAS expression increases monotonically over the first 24 h after induc-
tion. ERK phosphorylation is first increased, and then briefly decreased, followed by a plateau. Actin measurements are used for normaliza-
tion of RAS signals, and phospho-ERK levels are normalized by total ERK intensities. DUSP6 mRNA levels rapidly rise after RAS is induced.
(C) Schematic representation of the selected mathematical model. RAS is induced by IPTG and degraded. ERK is phosphorylated as a conse-
quence of RAS activation, and phospho-ERK in turn induces DUSP6 mRNA expression. DUSP6 is translated into DUSP6 protein, which
dephosphorylates ERK. In the final model, ERK (de)phosphorylation is assumed to be in quasi-steady state, with nonlinear dependence on
RAS and DUSP6. (D) Time-series of the best fit of the final model together with the quantified time-series data from western blots (for
ERKpp and RAS), and northern blot (for DUSP6 mRNA).
N. Blu
¨
thgen et al. Transcriptional feedback in ERK signaling
FEBS Journal 276 (2009) 1024–1035 ª 2009 The Authors Journal compilation ª 2009 FEBS 1027
ERK
P
P
ERK
RAS
dusp6
ERK
P
P
ERK
RAS
dusp6
DUSP6
Model A
without feedback
Model B
with DUSP6
Model D
reduced model
Model E
with ultrasensitivity
ERK
P
P
RAS
dusp6
DUSP6
Ultrasensitive
ERK
P
P
RAS
dusp6
DUSP6
Linear
Model reduction
explains data similarly well
(P > 0.6)
Model with DUSP6 feedback
explains data better (P < 0.01)
Model fits better with ultrasensitivit
y
(P < 0.05)
ERK
P
P
ERK
RAS
dusp1
DUSP1
Model C
with DUSP1
DUSP6 feedback explains data
better than with DUSP1 (P < 0.01)
0
1
2
Ras
0
1
2
ERK-p
05
Time (h)
0
1
dusp1
0
1
2
Ras
0
1
2
ERK-p
05
Time (h)
0
1
2
dusp6
0
1
2
Ras
0
1
2
ERK-p
05
Time (h)
0
1
2
dusp6
0
1
2
Ras
0
1
2
ERK-p
05
Time (h)
0
1
2
dusp1
0
1
2
Ras
0
1
2
ERK-p
05
Time (h)
0
1
2
dusp6
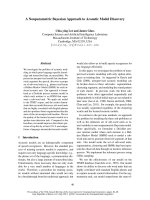
Fig. 3. Model selection procedure. The structure and the best fit to the first data points of the five models are shown, as well as the P-val-
ues from the likelihood ratio test. (A) First, a model without feedback was constructed and fitted to time-series data of RAS protein expres-
sion, ERK phosphorylation, and dusp6 mRNA expression. This model could not reproduce the biphasic response. (B) A model that includes
dephosphorylation of ERK explains the data significantly better. (C) Fitting the same model to time-series of dusp1 mRNA results in a signifi-
cantly worse fit. (D) Model B was reduced by quasi-steady-state approximation of ERK activity. This reduced model fits the data similarly
well. (E) Erk activation and deactivation was assumed to be ultrasensitive, and this model fits the data significantly better than model D.
Transcriptional feedback in ERK signaling N. Blu
¨
thgen et al.
1028 FEBS Journal 276 (2009) 1024–1035 ª 2009 The Authors Journal compilation ª 2009 FEBS
reproduced. We also investigated whether DUSP1 can
similarly account for the observed dynamics in ERK
phosphorylation by fitting the model with feedback to
the time course of ERK, RAS and DUSP1 mRNA
(Fig. 3C). This model fitted significantly less well,
which suggests that DUSP6 is the important regulator
in the first hours of ERK signaling.
Therefore, we chose the model structure shown in
Fig. 3B, and investigated whether we can reliably
determine the parameters in the mathematical model
from the experimental data. We used a Monte Carlo
approach to define confidence intervals for and corre-
lation coefficients between the parameters. The param-
eters describing ERK activation and deactivation
showed large confidence intervals, and were highly cor-
related, which indicates that they are not identifiable
(for details see Appendix S1). This is not too surpris-
ing, as the typical time scale for activation and deacti-
vation of ERK is much smaller than the intervals
between the time points of measurements of ERK
phosphorylation. Thus, the detailed activation and
deactivation rates cannot be inferred separately from
our data. Moreover, the parameters describing the
impact of ERK phosphorylation on DUSP6 expression
and vice versa were especially highly correlated. There-
fore, we reduced model complexity by applying a
quasi-steady-state approximation for phosphorylation
and dephosphorylation of ERK. Model selection
shows that the resulting reduced model fits the data
similarly well as the more detailed model (Fig. 3D and
Appendix S2).
The model also allows us to investigate whether
ERK activation is responding to upstream events in a
linear or nonlinear manner. Mechanistic modeling has
suggested that ERK and MEK respond in an ultrasen-
sitive fashion [6,33,34], but so far this has only been
confirmed for signaling processes in Xenopus oocytes.
We modified the model such that ERK activation is
nonlinear with an exponent of 2. This modified model
fitted the data significantly better and allowed us to
describe the biphasic response of ERK more precisely
(Fig. 3E). The structure and time-series of the best fit
of this final model is shown in Fig. 2C,D.
In conclusion, model selection of the time-series data
resulted in two testable predictions. First, the two
parameters describing DUSP6 mRNA and protein
decay in the model have a direct biophysical meaning.
Both DUSP6 mRNA and protein are estimated to be
rapidly decaying, which can be compared to the bio-
chemical data. Second, the model selection predicts
that the activation of ERK is nonlinear. As described
in the following, we collected quantitative experimental
measurements to test these model predictions.
Model prediction 1 – DUSP6 is unstable at the
mRNA and protein levels
Most of the model parameters are given in relative
units; thus, they cannot be compared to biochemical
measurements. However, two parameters in the model
have a direct biophysical meaning: the decay rates of
DUSP6 protein and mRNA are estimated to be
relatively fast, at 3.5 and 0.9 h
)1
, respectively. These
values correspond to half-lives of 11 and 46 min for
0
20
0
40
0
40
0
30
0
20
0
20
0
30
0 250 500 750 1000
ERKpp (IF)
0
10
n = 53
n = 159
n = 168
n = 156
n = 170
n = 159
n = 267
n = 55
0
0.1
0.2
0.5
1
2
5
10
PDGF
PDGF (ng·mL
–1
)
200
400
600
800
Mean flourescence
Hill coefficient
3.8 ± 0.7
024681
0
0
20
40
60
80
100
A
B
C
0246810
mRNA half-life (h)
Fraction of mRNAs (%)
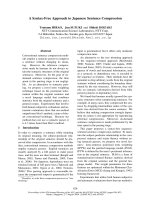
Fig. 4. Validation of model predictions. (A) Cumulative distribution
of mRNA half-lives. DUSP6 has a very low half-life (median 0.55 h,
marked with an arrow), which is significantly smaller than average
mRNA half-lives. (B, C) Distribution of ERK phosphorylation is single
cells after platelet-derived growth factor (PDGF) stimulation shows
that ERK responds with a unimodal distribution (B), in an ultrasensi-
tive fashion at the population level with a Hill coefficient of about
4 (C).
N. Blu
¨
thgen et al. Transcriptional feedback in ERK signaling
FEBS Journal 276 (2009) 1024–1035 ª 2009 The Authors Journal compilation ª 2009 FEBS 1029
DUSP6 protein and mRNA, respectively. Recently,
two studies of mRNA decay rates, measured at the
level of the genome, showed a median half-life of
DUSP6 mRNA of 33 min. This is one of the shortest
half-lives in the entire dataset (Fig. 4A) [35,36]. In
addition, the half-life of the DUSP6 protein has been
reported to be < 1 h [37]. Thus, the model prediction
of very short half-lives for DUSP6 is congruent with
the data available.
Model prediction 2 – ERK activity is ultrasensitive
The next prediction of the model selection procedure is
that ERK activation is ultrasensitive. Possible mecha-
nisms underlying ultrasensitivity have been discussed
earlier. The most likely mechanism is distributed,
sequential phosphorylation ⁄ dephosphorylation of
ERK, which typically gives rise to a Hill coefficient of
2 [33]. It was not possible to reliably measure small
quantitative changes in MEK activation in our experi-
mental system. Therefore, we tested this prediction by
stimulating fibroblasts with different concentrations of
the platelet-derived growth factor (PDGF), and mea-
sured ERK phosphorylation in the nucleus 20 min
poststimulation by immunofluorescence. Single-cell
measurements were employed, as it has been proposed
earlier that PDGF-stimulated fibroblasts react in a
bistable manner, with individual cells responding in an
all-or-none fashion [8,38]. Such cellular behavior is
expected to give rise to a bimodal histogram of ERK
activity for intermediate stimuli. The distribution of
ERK activity is shown in Fig. 4B. In contrast to bista-
ble responses, the stimulation experiments showed a
monomodal distribution of ERK activity, which grad-
ually shifts to higher activity levels as the stimulus
increases. This suggests that ERK activity is not bista-
ble in fibroblasts stimulated with PDGF. The average
activity shows a Hill-type response with a coefficient of
approximately 4 (Fig. 4C). Thus, ERK activation is
ultrasensitive when it responds to PDGF stimulation.
As Hill coefficients are determined in cell populations,
the strong sensitivity of the response observed at the
population level could be even more pronounced at
the level of individual cells. A similar estimate for the
Hill coefficient can be derived from previously pub-
lished data obtained by flow cytometry [39] (for
details, see Appendix S3). Such ultrasensitivity may
arise at any point during the transduction from recep-
tor to ERK. Ultrasensitivity is partly due to the func-
tion of the receptor, which has been determined to
respond with a Hill coefficient of 1.7 in fibroblasts
[40]. Hill coefficients of signaling cascades are maxi-
mally the product of the Hill coefficients of the
individual elements of the signaling pathway [41,42].
Therefore, the remaining coefficient of at least 2 can
be attributed to MAPK signaling. It remains to be
shown, however, whether the resulting ultrasensitivity
results from the double phosphorylation of ERK, or
from a combination with processes further upstream,
such as MEK phosphorylation.
Discussion
MAPK signaling is central to proliferation control in
many cells, and quantitative aspects of ERK activa-
tion, such as signal amplitude and duration, determine
the cell fate. However, little is known of how MAPK
signaling is regulated quantitatively by transcriptional
feedback loops, although the time scale of decision-
making is often well beyond that of early transcrip-
tional feedbacks. To improve our knowledge of the
transcriptional responses involved in MAPK signaling,
we have employed a systems biological approach to
identify a feedback loop that shapes the activation of
ERK within the first hours of cellular transformation.
We present evidence that DUSP6 is transcriptionally
upregulated by oncogenic RAS signaling through the
potential cooperation of SRF with CREB, and thus
causes a biphasic response of ERK. Current sequence-
based methods fail to provide a genome-wide predic-
tion of target genes, due to the high number and
length of the mammalian promoters and the short
binding motifs of transcription factors. However, the
combination of ‘conventional’ promoter analysis with
gene ontology-term-based functional annotation [22]
revealed phosphatase genes as primary targets of SRF
and of CREB. SRF is a key determinant of muscle dif-
ferentiation, and plays a major role in the regulation
of proliferation through the activation and repression
of a variety of target genes [43,44]. The transcriptional
activity of SRF is stimulated through ERK-dependent
phosphorylation. Specificity is achieved by interaction
of SRF with cofactors in a signal-specific or tissue-
specific manner. These cofactors bind either together
with SRF at the serum response element or in close
proximity to Ets binding sites [45]. Also, the CREB
transcription factor has been implicated in the regula-
tion of proliferation, mainly in leukemias through the
induction of proto-oncogenes and cell cycle regulatory
genes [46]. A direct impact of CREB-mediated gene
activation on signaling feedback control during trans-
formation or tumor development has not been
reported previously. Thus, our approach identified a
hitherto unknown combinatorial role of both tran-
scription factors, which is likely to determine both the
onset and quantity of mitogenic signaling in several
Transcriptional feedback in ERK signaling N. Blu
¨
thgen et al.
1030 FEBS Journal 276 (2009) 1024–1035 ª 2009 The Authors Journal compilation ª 2009 FEBS
different cellular contexts. In a recent publication [44],
DUSP6 was predicted to harbor an SRF-binding site;
however, this was not confirmed experimentally.
Therefore, it remains to be tested whether CREB and
SRF both interact with the phosphatase genes, or
whether there is an indirect contribution of SRF,
which does not seem likely, because of the rapid induc-
tion. SRF might also play a role as a mediator for
MAPK-dependent, ETS1-controlled induction of
DUSP6, as suggested very recently [47]. The fact that
we found phosphatases to be overrepresented in the
joint list of SRF and CREB targets suggests that
regulation of protein phosphorylation is a common
function of the two transcription factors.
Another important aspect of our model is that it
predicted the very short half-lives of DUSP6 mRNA
and protein, which have been reported to be £ 1h
[37]. The time span required for a protein to reach a
steady-state expression level is determined by its half-
life [48]. Therefore, short-lived molecules such as
DUSP6 can respond quickly to any alteration in
signaling, and thus can influence ERK activity within
1–2 h. The functional relevance of DUSP-mediated
feedback is supported by a recent study using meta-
bolic control analyses on epidermal growth factor
receptor models [49]. This study predicted a central
role for the dephosphorylation of ERK. The distribu-
tion of control strength within the epidermal growth
factor receptor-induced network of MAPK signaling
showed that relatively few, distinct steps in the signal-
ing cascade appeared to have a significant control
function for the signaling amplitude, duration and
integrated output of transient ERK phosphorylation.
The dephosphorylation of ERK by DUSP6 and also
the overall protein concentrations of both ERK and
DUSP6 had a significant influence on signaling control
[49]. Such differential control functions might have
important implications for the efficacy of targeted
pathway inhibition, as blocking of different pathway
components might cause different and eventually unex-
pected biological responses. One important aspect is
that systems controlled by negative feedbacks may be
very robust with respect to manipulations of different
components within the feedback loop [50]. MAPK
phosphatase genes, such as DUSP6 and DUSP4, are
at least partially understood in terms of their transcrip-
tional regulation downstream of ERK [44,47,51]. In
addition, there are other feedback regulators within
the RAS–RAF–MEK–ERK pathway that might con-
tribute to signaling modulation. We tested whether
feedback regulation via DUSP1, an unspecific MAPK
phosphatase, contributes to early signal attenuation,
but found that it does not play a major role, possibly
because the cells are not serum-starved. DUSP9, which
is induced at later a time point, may mediate signal
attenuation at time points after 10 h. Other classes of
signaling proteins might also mediate transcriptional
feedback. Most recently, Ding and Lengyel [52]
described a novel regulator of RAS, p204, which is
induced by Egr1, a transcription factor directly down-
stream of ERK. Moreover, Sprouty, an inhibitor act-
ing at the receptor level, seems to be transcriptionally
regulated upon pathway activation [48]. Therefore, fur-
ther quantification and more detailed modeling includ-
ing time-resolved analysis of phosphatase expression
will be required to determine whether therapeutic
approaches targeting DUPSs or signaling components
further downstream of MAPK could be beneficial.
Several lines of evidence suggest that the feedback
mediated by DUSP6 ‘steps in’ whenever noncancerous
cells are exposed to prolonged stimulation. This allows
switching-off of the pathway [53]. Several studies have
demonstrated the role of DUSP6 as a central feedback
regulator dampening ERK levels in developmental
programs [14,54]. Our study shows that a strong onco-
genic signal can overcome this negative feedback and
achieve constitutive ERK activation. However, it also
shows that the feedback keeps ERK activity at a mod-
erate level. One could speculate that the robustness
gained from this feedback in normal cells is ‘hijacked’
or co-opted by cancer cells to circumvent apoptosis
caused by ERK overactivation. The role of DUSP6 in
controlling the robustness of tumor cell proliferation
and progression seems to be dependent on tumor type.
Pancreatic cancer cells progress towards a more
aggressive and invasive phenotype following loss of
DUSP6 expression [55]. In breast cancer cells, activa-
tion of the DUSP6 feedback correlated with chemo-
therapy resistance following tamoxifen treatment [56].
Moreover, DUSP6 is part of a predictive gene signa-
ture for non-small cell lung cancer based on five infor-
mative genes [57]. These examples show that it is
crucial to understand MAKP-dependent control mech-
anisms in more quantitative terms, and suggest that
molecules involved in feedback regulation can play
ambiguous roles as oncogenes and tumor suppressors,
depending on quantitative differences.
From our experimental data, we could derive a role
for one of the regulated DUSPs. As other DUSPs are
regulated as well, MAPK signaling is most likely regu-
lated by a complex network of negative feedback regu-
lators. Moreover, the stability of several DUSP
proteins is regulated by post-translational modification
[37]. Our study based on model selection and time
course data could not fully resolve the complexity of
this regulatory network downstream of MEK. In order
N. Blu
¨
thgen et al. Transcriptional feedback in ERK signaling
FEBS Journal 276 (2009) 1024–1035 ª 2009 The Authors Journal compilation ª 2009 FEBS 1031
to disentangle this network, a much more complex
study needs to be conducted, including pathway inter-
ference, and incooperating biophysical data such as
binding constants and protein concentrations, which
crucially influence the dynamics of the pathway [33].
Only then we will be able to understand why such a
complex network of negative feedback players controls
MAPK signaling.
Moreover, the biological variability in our experi-
mental system, which caused different induction kinet-
ics of RAS, was a limitation, as all data used to
calibrate the model had to come from one experimen-
tal time course. In future studies, other means of
receptor-independent stimulation need to be exploited.
Our study also warrants the conclusion that mathe-
matical modeling of signaling pathways needs to incor-
porate the response of the transcriptome, if it is aimed
at modeling the pathways for physiologically relevant
time intervals. Previous detailed mathematical models
have emphasized the importance of post-translational
feedbacks, but have generally neglected transcriptional
feedback loops. A recent analysis has shown that tran-
scriptional feedback regulation by short-lived inhibi-
tory molecules controls all major signaling pathways in
humans [48]. Therefore, we expect that similar semi-
quantitative studies on the feedback regulation of
other disease-related pathways are required to fully
appreciate the complexity of pathway control. Such
studies could guide searches for new and more patient-
tailored therapeutic interventions and provide solutions
that either bypass the feedback loops or even modulate
the loops and achieve high therapeutic potential.
Experimental procedures
Cell culture conditions, transfection and
imunofluorescence
Immortal rat 208F fibroblasts, the HRAS
G12V
-transformed
derivatives FE-8 [58] and NIH3T3 cells were cultured in
DMEM supplemented with 10% fetal bovine serum, 2%
penicillin ⁄ streptomycin, and 2 mml-glutamine. HRAS
G12V
-
transformed human embryonal kidney cells were described
by Hahn et al. [26], and were cultivated in MEM, alpha
modification, supplemented with 10% inactivated fetal
bovine serum, 2 mm ultraglutamin, 1% penicillin ⁄ strepto-
mycin, 0.1 mgÆmL
)1
hygromycin, 0.5 lgÆmL
)1
puromycin,
and 0.4 mgÆmL
)1
G418.
Transient siRNA transfections against SRF were per-
formed for 96 h after double transfection with two different
oligonucleotides: SRF-1 (UGAGUGCCACUGGCUUUG
Att sense, UCAAAGCCAGUGGCACUCAtt antisense),
constructed with the Silencer siRNA Construction Kit
(#1620; Ambion, Applied Biosystems, Carlsbad, CA, USA)
and SRF-2 predesigned by Ambion (ID 142734). In both
cases, a final concentration of 50 nm was used.
Immortal rat 208F fibroblast-derived inducible RAS (IR)
cells (clone IR-4) harbor an IPTG-inducible HRAS onco-
gene, and have been described previously [29]. Expression
of HRAS was induced by the addition of 20 mm IPTG.
NIH3T3 cells grown on coverslips were serum-starved for
48 h and then treated with increasing concentrations of
PDGF. PhosphoERK immunofluorescence was determined
with the phospho-p44 ⁄ 42 MAPK antibody
(Thr202 ⁄ Tyr204) (New England Biolabs, Ipswich, MA,
USA) after 15 min of fixation in 3% paraformalde-
hyde ⁄ NaCl ⁄ P
i
and 1 min of permeabilization in 0.2%
Triton X-100 ⁄ NaCl ⁄ P
i
. Cells were then treated with the
pMAPK antibody for 2 h and with an Alexa546-labelled
antibody against rabbit for 1 h. Pictures were taken with a
standard fluorescence microscope and quantified as
described in Appendix S3.
Western blot analyses
Cells were solubilized in lysis buffer [20 mm Tris ⁄ HCl
pH 8.0, 100 mm NaCl, 1% sodium deoxycholate, 1%
NP-40, 0.1% SDS, complete protease inhibitor mix (Roche,
Mannheim, Germany)], and 20 lg of the whole cell extracts
were separated by SDS ⁄ PAGE. After semidry blotting
(TransBlot SD; BioRad, Laboratories, Munich, Germany)
to polyvinylidenefluoride membranes (Hybond P; Amer-
sham, Little Chalfont, UK), the membranes were blocked
for 1 h in NaCl ⁄ Tris-T (10 mm Tris, pH 8.0, 150 mm NaCl,
0.05% Tween-20) with 5% nonfat dry milk, and incubated
with primary antibodies against RAS (Transduction Lab-
oratories, BD Biosciences, San Jose, CA, USA) and
phospho-p44 ⁄ 42 MAPK (Thr202 ⁄ Tyr204) (New England
Biolabs). Membranes were washed and incubated with per-
oxidase-conjugated secondary antibodies. Signals were
detected by chemiluminescence reaction (ECL; Amersham
Pharmacia, Little Chalfont, UK) according to the manufac-
turer’s instructions.
Microarray experiments
Predesigned 70-mer oligonucleotides produced by Illumina
Inc. (San Diego, CA, USA) were spotted at 20 lm in 3·
SSC buffer, containing 0.01% SDS, onto poly(l-lysine)-
treated glass slides. Spotting was performed with the Micro-
Grid microarrayer (Genomic Solutions, Ann Arbor, MI,
USA). Every oligonucleotide was spotted six times. In addi-
tion, 20 different housekeeping genes and positive and
negative controls provided by the Alien SpotReport cDNA
Array Validation System were included (Stratagene, La
Jolla, CA, USA). Labeling and microarray hybridization
Transcriptional feedback in ERK signaling N. Blu
¨
thgen et al.
1032 FEBS Journal 276 (2009) 1024–1035 ª 2009 The Authors Journal compilation ª 2009 FEBS
was performed manually according to the Genisphere
3DNA Array 50 kit protocol (Genisphere, Hatfield, PA,
USA). For every hybridization a Cy3 ⁄ Cy5 dye swap experi-
ment was performed.
Microarrays were scanned with two wavelengths for Cy3
(570 nm) and Cy5 (660 nm) by using a laser fluorescent
scanner (Agilent G2565BA Scanner; Agilent Technologies,
Palo Alto, CA, USA) with three different photomultiplier
gains. Data analysis was performed using imagene
version 3.0 (BioDiscovery, Los Angeles, CA, USA). Raw
data obtained with the highest photomultiplier gain were
routinely used for quantification. Spots with saturated sig-
nal intensity were reanalyzed using a lower photomultiplier
gain. The fluorescence intensity of each spot in both the
Cy3 and Cy5 images was quantified, and fluorescence levels
of the local background were subtracted. Normalization of
Cy3 and Cy5 images was performed by adjusting the total
signal intensities of two images. A Lowess curve was fitted
to the log intensity versus log ratio plot. Twenty per cent of
the data were used to calculate the Lowess fit at each point.
This curve was used to adjust the control value for each
measurement. If the control channel was lower than 10,
then 10 was used instead.
Northern blot analysis
Ten micrograms of RNA were denatured for 5 min at 95 °C
and run on a 0.8% agarose ⁄ 0.6 m formaldehyde gel for 4 h.
The RNA was transferred to a nylon membrane (Nytran N;
Schleicher & Schuell, Dassel, Germany) and crosslinked by
UV light. Membranes were prehybridized for 1 h at 66 °C
in hybridization buffer (ExpressHyb; Clontech, Takara
Biogroup, Mountain View, CA, USA) with 100 lgÆmL
)1
yeast tRNA. Twenty-five nanograms of the cDNA probe
were radiolabeled with [
32
P]dCTP[aP] (ICN) by random
priming, and between 0.5 and 1 · 10
6
c.p.m. of the labeled
probe was added per milliter of hybridization buffer and
hybridized overnight at 66 °C. Membranes were washed to
a stringency of 2· SSC ⁄ 0.1% SDS at 42 °C, exposed to
X-ray films, and stored at – 80 °C until detection. To verify
equal loading and integrity of RNA, all gels were stained
with ethidium bromide. mRNA levels were normalized with
glyceraldehyde 3-phosphate dehydrogenase or 18S rRNA.
Real-time PCR analysis
RNA was prepared as described above 96 h after the sec-
ond siRNA transfection. Expression patterns of the genes
were validated by real-time RT-PCR using the ABI Prism
7900HT Sequence Detection System and TaqMan Gene
Expression Assays (Applied Biosystems, Foster City, CA,
USA), according to the supplier’s instructions. For relative
quantification, the linear expression values were calculated
by the DDCT method [59], using the tubulin gene as an
internal control.
Acknowledgements
We thank Dr Thomas Korte and Professor Andreas
Herrmann, Institute for Biophysics, HU Berlin for
help and advice on fluorescence microscopy. This pro-
ject was funded by Deutsche Forschungsgemeinschaft
DFG, SFB 618 Theoretische Biologie, projects A1 and
A3 and by the German Ministry for Education and
Research (BMBF), through the FORSYS partner
programme (grant number 0315261).
References
1 Murphy LO & Blenis J (2006) MAPK signal specificity:
the right place at the right time. Trends Biochem Sci 31 ,
268–275.
2 Klein PJ, Schmidt CM, Wiesenauer CA, Choi JN &
Gage EA (2006) The effects of a novel MEK inhibitor
PD184161 on MEK–ERK signaling and growth in
human liver cancer. Neoplasia 8, 1–8.
3 Bluthgen N & Legewie S (2008) Systems analysis of
MAPK signal transduction. Essays Biochem 45, 95–
108.
4 Orton RJ, Sturm OE, Vyshemirsky V, Calder M, Gil-
bert DR & Kolch W (2005) Computational modelling
of the receptor-tyrosine-kinase-activated MAPK path-
way. Biochem J 392, 249–261.
5 Vayttaden SJ, Ajay SM & Bhalla US (2004) A spectrum
of models of signaling pathways. Chembiochem 5, 1365–
1374.
6 Huang CY & Ferrell JE Jr (1996) Ultrasensitivity in the
mitogen-activated protein kinase cascade. Proc Natl
Acad Sci USA 93, 10078–10083.
7 Santos SD, Verveer PJ & Bastiaens PI (2007) Growth
factor-induced MAPK network topology shapes Erk
response determining PC-12 cell fate. Nat Cell Biol 9,
324–330.
8 Bhalla US & Iyengar R (1999) Emergent properties of
networks of biological signaling pathways. Science 283,
381–387.
9 Asthagiri AR & Lauffenburger DA (2001) A computa-
tional study of feedback effects on signal dynamics in a
mitogen-activated protein kinase (MAPK) pathway
model. Biotechnol Prog 17, 227–239.
10 Kholodenko BN (2000) Negative feedback and ultrasen-
sitivity can bring about oscillations in the mitogen-acti-
vated protein kinase cascades. Eur J Biochem 267 ,
1583–1588.
11 Nakayama K, Satoh T, Igari A, Kageyama R & Nish-
ida E (2008) FGF induces oscillations of Hes1
expression and Ras ⁄ ERK activation. Curr Biol 18,
R332–R334.
12 Eblaghie MC, Lunn JS, Dickinson RJ, Munsterberg
AE, Sanz-Ezquerro JJ, Farrell ER, Mathers J, Keyse
SM, Storey K & Tickle C (2003) Negative feedback reg-
N. Blu
¨
thgen et al. Transcriptional feedback in ERK signaling
FEBS Journal 276 (2009) 1024–1035 ª 2009 The Authors Journal compilation ª 2009 FEBS 1033
ulation of FGF signaling levels by Pyst1 ⁄ MKP3 in
chick embryos. Curr Biol 13, 1009–1018.
13 Kawakami Y, Rodriguez-Leon J, Koth CM, Buscher
D, Itoh T, Raya A, Ng JK, Esteban CR, Takahashi S,
Henrique D et al. (2003) MKP3 mediates the cellular
response to FGF8 signalling in the vertebrate limb. Nat
Cell Biol 5, 513–519.
14 Li C, Scott DA, Hatch E, Tian X & Mansour SL
(2007) Dusp6 (Mkp3) is a negative feedback regulator
of FGF-stimulated ERK signaling during mouse devel-
opment. Development 134, 167–176.
15 Owens DM & Keyse SM (2007) Differential regulation
of MAP kinase signalling by dual-specificity protein
phosphatases. Oncogene 26, 3203–3213.
16 Tchernitsa OI, Sers C, Zuber J, Hinzmann B, Grips M,
Schramme A, Lund P, Schwendel A, Rosenthal A &
Schafer R (2004) Transcriptional basis of KRAS onco-
gene-mediated cellular transformation in ovarian epithe-
lial cells. Oncogene 23, 4536–4555.
17 Zuber J, Tchernitsa OI, Hinzmann B, Schmitz AC,
Grips M, Hellriegel M, Sers C, Rosenthal A & Schafer
R (2000) A genome-wide survey of RAS transformation
targets. Nat Genet 24, 144–152.
18 Murphy GA & Der CJ (2002) Ras-mediated deregula-
tion of gene expression and contribution to oncogenesis.
In Oncogene-directed Therapies (Rak J, ed.), pp. 77–100.
Humana Press, Totowa, NJ.
19 Scha
¨
fer R, Tchernitsa OI & Sers C (2006) Global effects
of Ras signalling on the genetic program in mammalian
cells. In RAS Family GTPases (Der CJ, ed.), pp. 169–
198. Springer, Dordrecht.
20 Kielbasa SM, Bluthgen N, Sers C, Schafer R & Herzel
H (2004) Prediction of cis-regulatory elements of coreg-
ulated genes. Genome Inform 15 , 117–124.
21 Wasserman WW & Sandelin A (2004) Applied bioinfor-
matics for the identification of regulatory elements. Nat
Rev Genet 5, 276–287.
22 Bluthgen N, Kielbasa SM & Herzel H (2005) Inferring
combinatorial regulation of transcription in silico.
Nucleic Acids Res 33, 272–279.
23 Yang SH, Sharrocks AD & Whitmarsh AJ (2003)
Transcriptional regulation by the MAP kinase signaling
cascades. Gene 320, 3–21.
24 Keyse SM (2008) Dual-specificity MAP kinase phospha-
tases (MKPs) and cancer. Cancer Metastasis Rev 27,
253–261.
25 Zhang X, Odom DT, Koo SH, Conkright MD,
Canettieri G, Best J, Chen H, Jenner R, Herbolshei-
mer E, Jacobsen E et al. (2005) Genome-wide analy-
sis of cAMP-response element binding protein
occupancy, phosphorylation, and target gene activa-
tion in human tissues. Proc Natl Acad Sci USA 102,
4459–4464.
26 Hahn WC, Counter CM, Lundberg AS, Beijersbergen
RL, Brooks MW & Weinberg RA (1999) Creation of
human tumour cells with defined genetic elements.
Nature 400, 464–468.
27 Wiley HS (2003) Trafficking of the ErbB receptors and
its influence on signaling. Exp Cell Res 284, 78–88.
28 Liu HS, Scrable H, Villaret DB, Lieberman MA &
Stambrook PJ (1992) Control of Ha-ras-mediated mam-
malian cell transformation by Escherichia coli regula-
tory elements. Cancer Res 52, 983–989.
29 Sers C, Tchernitsa OI, Zuber J, Diatchenko L, Zhuma-
bayeva B, Desai S, Htun S, Hyder K, Wiechen K,
Agoulnik A et al. (2002) Gene expression profiling in
RAS oncogene-transformed cell lines and in solid
tumors using subtractive suppression hybridization and
cDNA arrays. Adv Enzyme Regul 42, 63–82.
30 Tchernitsa OI, Sers C, Geflitter A & Schafer R (2006)
Effects of Ras signaling on gene expression analyzed by
customized microarrays. Meth Enzymol 407, 373–387.
31 Swameye I, Muller TG, Timmer J, Sandra O & Kling-
muller U (2003) Identification of nucleocytoplasmic
cycling as a remote sensor in cellular signaling by data-
based modeling. Proc Natl Acad Sci USA 100, 1028–
1033.
32 Timmer J, Mu
¨
ller TG, Swameye I, Sandra O & Kling-
mu
¨
ller U (2004) Modelling the nonlinear dynamics of
cellular signal transduction. Int J Bif Chaos 14, 2069–
2079.
33 Bluthgen N, Bruggeman FJ, Legewie S, Herzel H,
Westerhoff HV & Kholodenko BN (2006) Effects of
sequestration on signal transduction cascades. FEBS J
273, 895–906.
34 Legewie S, Schoeberl B, Bluthgen N & Herzel H (2007)
Competing docking interactions can bring about bista-
bility in the MAPK cascade. Biophys J 93, 2279–2288.
35 Raghavan A, Ogilvie RL, Reilly C, Abelson ML, Ragh-
avan S, Vasdewani J, Krathwohl M & Bohjanen PR
(2002) Genome-wide analysis of mRNA decay in resting
and activated primary human T lymphocytes. Nucleic
Acids Res 30, 5529–5538.
36 Yang E, van Nimwegen E, Zavolan M, Rajewsky N,
Schroeder M, Magnasco M & Darnell JE Jr (2003)
Decay rates of human mRNAs: correlation with func-
tional characteristics and sequence attributes. Genome
Res 13, 1863–1872.
37 Marchetti S, Gimond C, Chambard JC, Touboul T,
Roux D, Pouyssegur J & Pages G (2005) Extracellular
signal-regulated kinases phosphorylate mitogen-acti-
vated protein kinase phosphatase 3 ⁄ DUSP6 at
serines 159 and 197, two sites critical for its
proteasomal degradation. Mol Cell Biol 25, 854–864.
38 Bhalla US, Ram PT & Iyengar R (2002) MAP kinase
phosphatase as a locus of flexibility in a mitogen-acti-
vated protein kinase signaling network. Science 297,
1018–1023.
39 Mackeigan JP, Murphy LO, Dimitri CA & Blenis J
(2005) Graded mitogen-activated protein kinase activity
Transcriptional feedback in ERK signaling N. Blu
¨
thgen et al.
1034 FEBS Journal 276 (2009) 1024–1035 ª 2009 The Authors Journal compilation ª 2009 FEBS
precedes switch-like c-Fos induction in mammalian
cells. Mol Cell Biol 25, 4676–4682.
40 Park CS, Schneider IC & Haugh JM (2003) Kinetic
analysis of platelet-derived growth factor receptor ⁄ phos-
phoinositide 3-kinase ⁄ Akt signaling in fibroblasts.
J Biol Chem 278, 37064–37072.
41 Bluthgen N & Herzel H (2003) How robust are switches
in intracellular signaling cascades? J Theor Biol 225,
293–300.
42 Brown GC, Hoek JB & Kholodenko BN (1997) Why
do protein kinase cascades have more than one level?
Trends Biochem Sci 22, 288.
43 Lee HJ, Yun CH, Lim SH, Kim BC, Baik KG, Kim
JM, Kim WH & Kim SJ (2007) SRF is a nuclear
repressor of Smad3-mediated TGF-beta signaling.
Oncogene 26, 173–185.
44 Sun Q, Chen G, Streb JW, Long X, Yang Y, Stoeckert
CJ Jr & Miano JM (2006) Defining the mammalian
CArGome. Genome Res 16, 197–207.
45 Posern G & Treisman R (2006) Actin’ together: serum
response factor, its cofactors and the link to signal
transduction. Trends Cell Biol 16, 588–596.
46 Mayr B & Montminy M (2001) Transcriptional regula-
tion by the phosphorylation-dependent factor CREB.
Nat Rev Mol Cell Biol 2, 599–609.
47 Ekerot M, Stavridis MP, Delavaine L, Mitchell MP,
Staples C, Owens DM, Keenan ID, Dickinson RJ, Sto-
rey KG & Keyse SM (2008) Negative-feedback regula-
tion of FGF signalling by DUSP6 ⁄ MKP-3 is driven by
ERK1 ⁄ 2 and mediated by Ets factor binding to a con-
served site within the DUSP6 ⁄ MKP-3 gene promoter.
Biochem J 412, 287–298.
48 Legewie S, Herzel H, Westerhoff HV & Bluthgen N
(2008) Recurrent design patterns in the feedback regula-
tion of the mammalian signalling network. Mol Syst
Biol 4, 190.
49 Hornberg JJ, Binder B, Bruggeman FJ, Schoeberl B,
Heinrich R & Westerhoff HV (2005) Control of MAPK
signalling: from complexity to what really matters.
Oncogene 24, 5533–5542.
50 Sauro HM & Kholodenko BN (2004) Quantitative anal-
ysis of signaling networks. Prog Biophys Mol Biol 86,
5–43.
51 Berasi SP, Huard C, Li D, Shih HH, Sun Y, Zhong W,
Paulsen JE, Brown EL, Gimeno RE & Martinez RV
(2006) Inhibition of gluconeogenesis through transcrip-
tional activation of EGR1 and DUSP4 by AMP-acti-
vated kinase. J Biol Chem 281, 27167–27177.
52 Ding B & Lengyel P (2008) p204 protein is a novel
modulator of ras activity. J Biol Chem 283, 5831–5848.
53 Smith TG, Karlsson M, Lunn JS, Eblaghie MC &
Keenan ID (2006) Negative feedback predominates
over cross-regulation to control ERK MAPK activity
in response to FGF signalling in embryos. FEBS Lett
580, 4242–4245.
54 Echevarria D, Martinez S, Marques S, Lucas-Teixeira
V & Belo JA (2005) Mkp3 is a negative feedback modu-
lator of Fgf8 signaling in the mammalian isthmic orga-
nizer. Dev Biol 277, 114–128.
55 Furukawa T, Sunamura M, Motoi F, Matsuno S &
Horii A (2003) Potential tumor suppressive pathway
involving DUSP6 ⁄ MKP-3 in pancreatic cancer. Am J
Pathol
162, 1807–1815.
56 Cui Y, Parra I, Zhang M, Hilsenbeck SG, Tsimelzon A,
Furukawa T, Horii A, Zhang ZY, Nicholson RI &
Fuqua SA (2006) Elevated expression of mitogen-
activated protein kinase phosphatase 3 in breast tumors:
a mechanism of tamoxifen resistance. Cancer Res 66,
5950–5959.
57 Chen HY, Yu SL, Chen CH, Chang GC, Chen CY,
Yuan A, Cheng CL, Wang CH, Terng HJ, Kao SF
et al. (2007) A five-gene signature and clinical outcome
in non-small-cell lung cancer. N Engl J Med 356, 11–20.
58 Griegel S, Traub O, Willecke K & Schafer R (1986)
Suppression and re-expression of transformed pheno-
type in hybrids of HA-ras-1-transformed rat-1 cells and
early-passage rat embryonic fibroblasts. Int J Cancer 38,
697–705.
59 Pfaffl MW (2001) A new mathematical model for rela-
tive quantification in real-time RT-PCR. Nucleic Acids
Res 29, e45.
Supporting information
The following supplementary material is available:
Appendix S1. Construction of the models.
Appendix S2. Model selection.
Appendix S3. Image analysis.
This supplementary material can be found in the
online version of this article.
Please note: Wiley-Blackwell is not responsible for
the content or functionality of any supplementary
materials supplied by the authors. Any queries (other
than missing material) should be directed to the
corresponding author for the article.
N. Blu
¨
thgen et al. Transcriptional feedback in ERK signaling
FEBS Journal 276 (2009) 1024–1035 ª 2009 The Authors Journal compilation ª 2009 FEBS 1035