Source investigation of a small event using empirical Green’s functions and simulated annealing ppt
Bạn đang xem bản rút gọn của tài liệu. Xem và tải ngay bản đầy đủ của tài liệu tại đây (1.58 MB, 13 trang )
Geophys.
J.
Int.
(1996) 125,768-780
Source investigation
of
a small event using empirical Green’s
functions and simulated annealing
F.
Courboulex,’
J.
Virieux,’
A.
Deschamps,’
D.
Gibert2
and
A.
Zollo3
Giosciences Azur, UniuersitC de Nice-Sophia Antipolis, Rue
A.
Einstein,
06560
Valhonne, France
Departmento di
Geofisca
e Vulcunologia, Universitu di Napoli,
Italy
’
GPosciences, Rennes
I,
Avenue Geniral Leclerc,
35042
Rennes cidex, France
Accepted 1996 January 23. Received 1996 January 23;
in
original
form
1994 October 21
SUMMARY
We propose a two-step inversion of three-component seismograms that
(
1)
recovers
the far-field source time function at each station and
(2)
estimates the distribution of
co-seismic slip on the fault plane for small earthquakes (magnitude
3
to
4).
The
empirical Green’s function (EGF) method consists of finding a small earthquake
located near the one we wish to study and then performing a deconvolution
to
remove
the path, site, and instrumental effects from the main-event signal.
The deconvolution between the two earthquakes is an unstable procedure: we have
therefore developed a simulated annealing technique to recover a stable and positive
source time function (STF) in the time domain at each station with an estimation of
uncertainties. Given a good azimuthal coverage, we can obtain information on the
directivity effect as well as on the rupture process. We propose an inversion method
by simulated annealing using the STF to recover the distribution of slip on the fault
plane with a constant rupture-velocity model. This method permits estimation of
physical quantities on the fault plane, as well as possible identification of the real
fault plane.
We apply this two-step procedure for an event of magnitude
3
recorded in the Gulf
of Corinth in August
1991.
A
nearby event of magnitude
2
provides
us
with empirical
Green’s functions for each station. We estimate an active fault area
of
0.02
to
0.15
km2
and deduce a stress-drop value of
1
to
30
bar and an average slip of
0.1
to
1.6
cm. The
selected fault of the main event is in good agreement with the existence of
a
detachment
surface inferred from the tectonics of this half-graben.
Key
words:
Green’s functions, inversion, Patras, source time functions.
INTRODUCTION
The empirical Green’s function (EGF) method proposed by
Hartzell
(1978)
shows that recordings
of
small earthquakes
contain the propagation characteristics necessary for modelling
large nearby earthquakes, and therefore yield empirical Green’s
functions that are more appropriate than the synthetic seismo-
grams generated by modelling the wave propagation in an
inadequately known structure. Mueller
(
1985)
used this concept
to
recover the source time function (STF)
of
a larger event by
deconvolving the small-earthquake seismograms from those
of
the larger one, thus removing path, site and instrumental effects.
This method has been widely applied to a large number of
earthquakes ranging from moderate
(M
=
4)
to very large
(M=7)
events, using local network data (Mueller
1985;
Frankel
&
Wennerberg
1989;
Mori
&
Hartzell
1990;
Hough
et
al.
1991),
strong motion data (Hartzell
1978;
Fukuyama
&
768
Irikura
1986),
as well as regional and teleseismic body and
surface waveforms (Hartzell
1989;
Kanamori
ef
al.
1992;
Velasco, Ammon
&
Lay
1994).
The applicability of the EGF method to a wide range of
earthquakes is still an open question; for example, the sensi-
tivity to the thickness of the seismogenic layer may prohibit
the use of this method for very large earthquakes (Scholz
1982),
while, for very small earthquakes, the influence
of
lithological structures is not clearly understood (Feignier
1991).
In this study, we apply the EGF method to earthquakes of
magnitude
-3
or
-4
using the EGF given by events
of
magnitude
-
2.
The deconvolution procedure to be applied
between the two earthquakes is an unstable process.
A
range
of different techniques, including both time-domain and fre-
quency-domain deconvolution, have been proposed in the
literature to tackle this problem (Helmberger
&
Wiggins
1971;
Lawson
&
Hanson
1974;
20110,
Capuano
&
Singh
1995).
0
1996 RAS
Source investigation
of
a small event
769
We propose a new time-analysis tool based on a simulated
annealing inversion to solve this problem and to recover a
positive and stable STF. The method that we have developed
is
a
two-step inversion. The first step consists
of
finding a
stable and positive STF by simulated annealing deconvolution
(SAD) at each available station. The computed far-field STF
may differ from one station to another because STFs incorpor-
ate the directivity effect of the source. In the second step, we
first use the method developed by Zollo
&
Bernard (1991b),
which is based
on
the construction of isochrons in order to
constrain the active fault-plane dimensions for the main shock.
Then, we perform an inversion of slip distribution over this
fault plane using deconvolved far-field STFs deduced by the
SAD method at each station. We obtain
a
detailed description
of the rupture process for small earthquakes assuming a
circular rupture model with a constant rupture velocity.
This kind of detailed waveform study requires a dense local
network composed
of
seismic stations with
a
dynamic range
high enough to avoid saturated signals for the main event and
with
a
sensitivity great enough to record signals of the small
event.
We applied this two-step inversion method to a set of
seismograms from a dense seismic network deployed during
1991 July and August in the Patras area of the Gulf
of
Corinth,
Greece. Many events of magnitude 1.5 to 3.5 were recorded
by three-component seismographs. This area has been the
subject
of
extensive studies (Rigo 1994; Le Meur 1994), which
have provided
us
with precise locations and well-constrained
focal mechanisms. We studied
in
detail an event that occurred
in the northern part
of
the Gulf, and obtained interesting
results relating to the rupture process of this 100 m sized event
and the determination of the active fault plane.
After
a
presentation of the EGF assumptions, we will give
a detailed explanation of the
SAD
that we propose, and the
two-step inversion method that we use.
EMPIRICAL GREEN’S
FUNCTIONS
For
a
small event occurring in the same period as and close
to
a
larger one, waves reaching
a
given station follow the
same ray paths, and the site response, which includes local
propagating effects near the station as well as instrumental
response, is the same for both events.
If
the two events have
the same focal mechanism, we may assume
a
linear scaling
between the two earthquakes; this
is
the basic self-similar
assumption
of
the EGF method.
With this hypothesis, we can use recordings of the small
earthquake as the empirical Green’s function
of
the larger one
(Mueller 1985) in order to remove the source radiation pattern
and, path, site and instrumental effects of the signal by
deconvolution at each station, and to recover the far-field
source time function.
The two selected events must not be too different in size
with respect to the propagation distance
so
that the recorded
signal of the small event can be used as the Green’s function
for any point
of
the fault associated with the large earthquake.
Only global time shifts estimated in the far-field approximation
are taken into account as we move along the fault. In addition,
the smaller earthquake must be small enough that its far-field
source time function can be approximated by a Dirac function.
In reality, the small-event source function has a finite duration,
and therefore a high-frequency-limited spectrum. This high-
frequency limit is represented by the corner frequency
of
the
small event and corresponds to the maximum resolution that
we can obtain on the large-event rupture process.
The EGF method assumes that the two events have the
same hypocentre. Consequently, waves that radiate from the
nucleation points
of
the two events should cross exactly
the same medium.
In
reality the two events are slightly shifted
in space, and a heterogeneity in the source region can be
detected by only one of the events. This is a restriction of the
EGF method, but the resulting error is smaller than the one
that would result from using a calculated Green’s function.
Nevertheless, for each type of phase the time shift of waves
coming from the source area will be the same, whatever the
complexity
of
the propagation path. Since we pick the initial
pulse on the STF manually at each station, and considering
that this initial pulse is radiated by the rupture nucleation, we
synchronize seismograms at each station at an absolute time.
In
so
doing, we remove the temporal effect
of
any possible
small difference in location
of
the two events.
THE DECONVOLUTION PROBLEM
The first problem we have to solve is the recovery
of
the
apparent STF at a given station. We then need to deconvolve
the seismogram of the smaller earthquake from that
of
the
larger one.
The signals used for convolution are the empirical Green’s
function and the assumed source time function, which have
nearly the same number of points in time. The associated
deconvolution, where the STF must be estimated from the
recorded seismogram for each station, is therefore an unstable
time-analysis problem, although the convolution is a linear
operation. Spectral deconvolution (Mueller 1985; Mori 1993;
Ammon, Velasco
&
Lay 1993) has been widely used and
different filtering strategies (Helmberger
&
Wiggins 1971) have
been performed to recover a nearly positive source time
function. Positive constraints on the source function make the
problem even more complex, although several techniques exist
to solve a linear problem under positivity constraints (Lawson
&
Nanson 1974).
Since the empirical Green’s function in this study has nearly
the same duration as the source function that we are looking
at, the matrix associated with the convolution is very sensitive
to the propagation
of
numerical errors, and often has
a
condition number greater than
1000
for
100
parameters. This
means that errors in the estimated source time function are
not bounded by perturbations
of
the convolution matrix built
from the empirical Green’s function. Moreover, estimation of
the STFs are very sensitive to the cut-off that can be selected
to stabilize the result, i.e. to the
a
priori
information or damping
that we include in the source-time-function retrieval procedure.
In order to control and minimize these effects we propose
an inverse technique for solving the deconvolution problem.
This is based on the iterative solution
of
the forward problem
and estimation of a misfit function. For each station, the misfit
is computed by comparing the synthetic signals, obtained by
convolution of the EGF with an assumed STF for the large
shock, with the observed recording of the same event. Each
iteration is driven by
a
numerical technique called simulated
annealing, which we describe below. Additionally, we shall use
the three components of the signal to estimate errors on the
results using a cross-validation technique.
0
1996
RAS,
GJI
125,
768-780
770
F.
Courboulex
et
al.
SIMULATED ANNEALING
DECONVOLUTION (SAD)
Annealing consists
of
heating
a
solid until thermal stresses
are released and then freezing it very slowly to reach the state
of lowest energy where the total crystallization is obtained.
If the cooling is too fast, a metastable glass can be formed,
corresponding to a local minimum of energy.
Simulated annealing is a numerical method proposed by
Kirkpatrick, Gellat
&
Vecchi (1983) and Cerny (1985),
analogous to the process
of
physical annealing, to obtain the
global minimum of
a
multiparameter function. In the same
way as
for
the physical process, the cooling must be slow
enough to prevent the system from being trapped into a local
minimum. This cooling procedure is a compromise between
local convergent methods and global Monte Carlo methods.
The inversion method will be used to recover the STF by
deconvolution and then to retrieve the slip distribution over
the earthquake fault plane. The method consists of solving the
forward problem many times instead of trying to perform the
inversion of the linear matrix associated with the deconvolution
problem numerically. Because this algorithm requires intensive
forward modelling, we must design a fast method to compute
the forward problem in order to have an inverse algorithm
that is sufficiently powerful. In this inversion the parameters
we wish to determine are the amplitudes of the STF
for
each
point in time.
The simulated annealing is a two-loop procedure. The first
loop consists of perturbing the model randomly and solving
the forward problem, and the second loop involves decreasing
a
parameter
T
(temperature). This parameter enables the
procedure to be highly non-linear at the beginning and to
become slowly linearized. If the decrease in temperature is
properly chosen, the method permits
us
to avoid local minima
of
the function and allows us to reach the global minimum in
a
reasonable number of iterations. The temperature,
T,
plays
the same role as the noise variance, and decreasing the
temperature during the cooling schedule is equivalent to
gradually increasing the influence
of
the data on the choice of
the new model (Tarantola 1987).
In this study we use a 'heat bath' technique, which is more
efficient at low temperature than the classical Metropolis
procedure (Metropolis
et
al.
1953). This fast technique has
been developed by Creutz (1980) and applied by Rothman
(1986)
to
seismic static corrections and Gilbert
&
Virieux
(1991) to electromagnetic imaging.
The misfit function is defined by an
L,
norm,
I
S(k)
=
c
"%bs(i)
-
A~yn(~)]~
9
(1)
i=l
where
I
is the number
of
time points,
i
is the current point,
Aobs(i)
is the value
of
the observed signal at the station and
Asyn(i) is the value
of
the synthetic one estimated by con-
volution. First, the starting temperature,
T,,
is chosen equal to
the average
of
the misfit function,
S(n),
obtained over 100
iterations, plus the standard deviation,
sd(
):
7;
=
(S(n))
+
sd(S(n)).
(2)
We then calculate at each discretized time step
i
of
the STF
the misfit function S(K) associated with every possible ampli-
tude value, k, while keeping other values
of
the STF fixed. The
speed of the forward modelling loop is increased by modifying
only those terms associated with the current point. The prob-
ability
of
acceptance,
Pa,
can be defined for each value
of
amplitude, k, for a given point in time, depending on the misfit
value and the actual temperature, as:
c
exp(-S(k)/T)
k=l
From this probability distribution, one can guess the amplitude
at the current point,
i.
Then, the next point in time of the STF
is considered and the whole procedure is undertaken again.
One loop is when all points have been taken into account. An
average
of
ten loops at the same temperature is enough to
make the result insensitive to the sequential selection of points
inside the solution. We have verified that reversing the order
of the selection of points gives us the same solution with the
same number of loops. After these ten loops, which correspond
to
one iteration of the simulated annealing procedure, we
decrease the temperature (Fig.
1).
When the temperature is high, the probability distribution
is
almost insensitive to the misfit function and any value can
be chosen. When the temperature decreases, few models remain
acceptable, and when the system is frozen, only the solution
providing the smallest misfit function is kept.
One difficulty of numerical simulated annealing, as is the
case for the corresponding physical technique, is the protocol
for cooling the temperature.
If
one imposes a cooling that is
too slow, retrieval
of
the solution becomes very expensive,
whereas
a
cooling that is too quick may trap the solution
into
a
local minimum (Kirkpatrick
et
al.
1983). We have used
the strategy proposed by Huang, Romeo
&
Sangiovanni-
Vincentelli (1986) and used by Gilbert
&
Virieux (1991) where
the cooling is made at a constant thermodynamic speed,
1.
We must verify that the average energy at iteration
n
+
l((S(n
+
1)))
is below the average energy at iteration
n((S(n)))
by
J.
times the standard deviation of the energy at
iteration
n:
(S(n
+
1))
=
(S(n))
-
Isd(S(n)).
(4)
Then, the cooling law is:
T(n
+
1)
=
T(n)
exp[-iT(n)/sd(S(n))].
(5)
In practice, we have taken
a
value of
i
around
0.1,
and the
number
of
iterations at
a
constant temperature equal to 10.
This gives
a
good estimate of the average energy and the
standard deviation.
Another problem that has to be solved is the determination
of
the final temperature. This can be done simply, by decreasing
the temperature until the system is totally frozen. In this case,
only one solution
is
retained. In order to take into account the
possible non-uniqueness
of
solution, and also the uncertainties
contained in the data itself, we propose the decreasing
of
the
temperature to
a
critical value equal to the noise variance
of
the data. This value is calculated using the three components
of
the signal and cross-validation theory, as described in
Courboulex, Virieux
&
Gilbert (1996).
At this temperature, we perform
a
large number of iterations
and keep the entire set
of
models. In the following example
we will use the average
of
these solutions and the standard
deviation that permits us to estimate uncertainties on the
STF obtained.
0
1996
RAS,
GJI
125,
768-780
Source
investigation
of
a small event
771
Random generation of sources
determination
of
initial temperature
Computation
of
the average misfit function
for
I
N
Iterations
I,
10
iterations with a constant temperature
for each point of source in time
(1
to
I)
for each possible amplitude
(1
to
K+
Convolution: R=model
*
green
Misfit function
:
S(k)=
(
R(i)
-
observed(i)
1
’
-S(k)/T
Probability
of
acceptance
of
each amplitude Pa(k)
=
-W)n
L”
Pseudo
-
random guess of the new model
bl
Cooling law
:
T(n+l)
=
T(n)
e
Figure
1.
Diagram
of
the heat-bath algorithm.
Let
us
now present the two-step method that we propose in
order to recover the spatio-temporal source of an earthquake.
A
TWO-STEP INVERSION
METHOD
The far-field body-wave displacement for a given fault-plane
geometry is obtained by the classical representation equation
(Aki
&
Richards
1980):
Uc(x,
t)
=
where
Au
is the scalar slip function, x and
ro
denote the
receiver and source position, respectively,
c
indicates the wave
type
(P
or
S
waves) and
T,
is the traveltime. The far-field
Green’s function
G
is taken as an empirical Green’s function.
The dot sign denotes the time derivative, while the asterisk
denotes convolution.
The first step is the reconstruction
of
the global contribution
of
the whole fault plane at a given station by the simulated
annealing deconvolution, as explained above, that estimates
the STF. We must solve the following equation:
G(x,
t;
ro)*Au(ro,
t
-
TJx,
ro))
dC,
(6)
s
fault
U‘(t)
=
G(t)*STF(t),
(7)
and recover the apparent source time function at a given
station.
Because the medium complexity has been extracted by
deconvolution, the STF at each station represents only the
source complexity in space and in time as if the medium were
homogeneous. The most obvious effect will be the directivity
effect, which modifies the STF shape at different stations,
especially if these are well distributed in azimuth around the
fault plane.
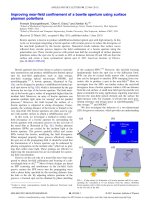
Once the far-field source time functions are obtained at each
station, we propose to back-propagate them onto the earth-
quake fault plane to determine its space-time slip distribution.
In order to investigate the spatio-temporal slip dependence at
the source, we need to solve the following equation for the slip
velocity,
Azi:
STF(x,
t)
=
AU(ro,
t
-
(TJx,
ro)
+
K(ro))
dC,
(8)
s
fault
where
T,
is the rupture time while
T,
is the wave-propagation
time. Propagation is performed in
a
homogeneous medium
because propagation effects in
a
complex medium have been
removed by deconvolution of EGF according to eq.
(7).
Thus,
the representation integral is reduced to a summation
of
the
contribution
of
several subfaults delayed by rupture time plus
propagation time estimated inside a homogeneous medium.
We discretize the fault plane on a regular grid and use the
simulated annealing technique for recovering the slip velocity
amplitude,
AU,
on the fault (Fig.
2).
The direction
of
the slip
velocity is assumed constant and defined by the specified focal
mechanism
of
the main shock.
In
summary, the first step consists
of
finding the appropriate
STF at each station by using the EGF method, and the second
step is the estimation of the slip distribution on the fault plane.
0
1996
RAS,
GJI
125,
768-780
772
F.
Courboulex
et
al.
SPatio-TemPoral
I
Source-Time Functions
I
;4,
r8
Slip Inversion (Simulated Annealing)
___________,
Slip
Distribution on
rhe
Facrft
Piane
Figure
2.
Two-step inversion procedure
for
recovering
the
slip
distribution.
With this method, it is possible to estimate physical quantities
on the fault plane, such as ruptured surface and stress drop,
and to provide arguments to discriminate between the two
nodal planes based on either
a
misfit function or on
a
realistic
slip distribution. Finally, in order to check the global accuracy
of
the spatio-temporal slip distribution obtained with
our
two-
step inversion, we perform the empirical Green's function
summation over the fault plane for all stations, in one step,
using eq. (6) directly.
DATA ANALYSIS
The Aegean region
is
one of the most seismically active regions
of
the Mediterranean basin (Le Pichon
&
Angelier 1987;
Jackson
&
McKenzie 1988). The Gulf of Corinth is a well-
studied example of active extensional tectonics (Jackson
et
al.
1982; Ori 1989; Hatzfeld
et
af.
1993; Lyon-Caen
et
al.
1994).
This gulf is recognized as a half-graben, bounded to the south
by
major normal faults, with no evidence
of
active rupture on
the northern side.
A seismic network was deployed in 1991 July and August,
around the Gulf
of
Corinth. 60 short-period
(2
Hz and 5
s)
portable digital stations were installed in the Patras-Aigion
region and recorded over
5000
events with
a
sampling fre-
quency ranging from 125 to 200 Hz. We have worked on a set
of 600 well-constrained events
of
1991 August recorded by the
three-component stations shown in Fig. 3.
Because the medium in the Patras region is complex and
not yet well known, we wanted
to
use empirical Green's
functions to model path effects on seismograms. We defined
criteria to find earthquakes for which this technique can be
applied.
In
the search for potential candidates
of
earthquake
couples, an automatic selection of the available data set was
performed using the following criteria:
(1) the difference in magnitude must be larger or equal to 1;
(2) the difference in hypocentre location must be smaller
(3) both events must be recorded at a minimum of three
(4)
the stations must be well distributed in azimuth around
than
2
km;
common stations;
the epicentre.
The last two criteria were difficult to satisfy because the smaller
events were often recorded by very few stations located near
the hypocentre. For these stations, seismograms
of
the main
event are likely to be saturated. Then, a visual inspection
of
each selected couple
of
events was required, in order to
eliminate saturated traces and to check the similarity
of
the
waveforms and the focal mechanisms of the two events. The
number
of
event candidates was small enough to make this
task feasible.
We selected two events that met these criteria. The main
earthquake occurred on 1991 August
2
on the northern coast
of the Gulf of Corinth. It was recorded by
a
large number of
stations in the local network: 18 three-component stations and
16 one-component instruments. Its duration magnitude has
been estimated as
3. Its
focal mechanism was determined by
Rigo (1994) using P-wave polarities and S-wave polarizations
by applying the method developed by
Zollo
&
Bernard (1991a).
The solution is a normal-fault mechanism. One nodal plane is
pseudo-vertical and oriented east-west with
a
southerly dip
(strike
=OW,
dip
=
73") and the other is almost horizontal,
with a shallow northerly dip (strike
=
300",
dip
=
20").
Both
planes are possible fault planes and lead
to
different geo-
dynamic explanations of this area. The pseudo-vertical plane
can be interpreted as an antithetic fault
of
the southern system,
and the pseudo-horizontal plane might be explained as a
decollement zone.
No
surface ruptures were observed, and
choosing which plane was active is a difficult task, although it
is a key question for the tectonic interpretation.
In
this study
we attempt to resolve this point with a detailed analysis of the
source coherence for the two supposed fault planes.
The small earthquake chosen as the empirical Green's
function occurred on 1991 August 16. Its location was close
to the main event and its magnitude was estimated at 2. It was
recorded by 12 stations, four of which were three-component
stations. We relocated it with respect to the main event by
using the master-event technique, and found an interevent
distance
of
1.8
km. The focal solution is almost identical to
the main-event nodal fault planes (Fig.
4).
The waveform
similarity
of
both events and likeness
of
focal mechanisms
leads
us
to consider the August 16 event as
a
possible empirical
Green's function for the August 2 event.
Three stations were available for our study. This number
is small compared to the large number of events and the
dense distribution of stations at our disposal. It highlights the
fact that high-dynamic-range stations are necessary to avoid
saturation
of
traces and to record very small events. Stations
MARM, SERG and LIMN were azimuthally well distributed
around the epicentre at distances of 15, 16 and 18 km, respect-
ively (see Fig.
3).
Seismograms of both events recorded by the
three stations are shown in Fig.
5.
The study is mainly per-
formed on S-wave signals because shear waves enhance the
detection of source directivity.
SOURCE-TIME-FUNCTION RETRIEVAL
On each component of the seismogram and for each station,
a
time window of 1
s
around the identified
S
pulse is extracted
and tapered by
10
per cent at both ends. We have applied
a
filter to the raw signal because of the decimation required by
the simulated annealing technique. The filter depends on the
number
of
points imposed on the source. The cut-off frequency
of this implicit low-pass filter is chosen to be around the value
0
1996
RAS,
GJI
125,
768-780
Source investigation
of
a small event
773
22'
00'
22'
30
30'
30
30'
00
August
1991
+limn
+
+
+
+
+
3
components Stations
22'
00'
22'
30'
Figure
3.
Three-component seismic stations deployed in the Gulf
of
Corinth near Patras during July and August 1991
Mag
3.
Figure
4.
Focal mechanisms
of
the two events after Rigo (1994)
of
the corner frequency of the smaller earthquake. We recall
that the initial time of the picking is quite arbitrary, and,
consequently, the initial time of the apparent source time
function will also be arbitrary.
The functional space of STF must be defined. The selected
time step is related to the corner frequency of the smallest
event. From the spectra, we found that the highest possible
30'
30'
30'
00
frequency would be
30
Hz,
limiting our time discretization,
At,
to a value equal to,
or
higher than, 0.03
s.
The time step,
At,
strongly influences the smoothing of the signal, but several
numerical experiments with different
At
showed a good stability
of the STF envelope.
The maximum positive amplitude
is
chosen by trial and
error. From an initially relatively high value, we decrease the
maximum permissable amplitude after a few tests. The ampli-
tude step depends mainly on the required precision for the
STF. Of course, a large number
of
values increases the con-
vergence time of the solution when using the simulated
annealing deconvolution, as explained previously.
We use the three components of the signal together in order
to obtain a set of STFs that best
fit
the three components,
and to estimate errors on the STF obtained. Fig.
6
shows
the estimated apparent source time functions bounded by
uncertainties, and Fig.
7, the observed and synthetic signals at
each station for each component. Synthetics were obtained by
convolution of the average STF solution and the empirical
Green's function of each component. We immediately observe
0
1996 RAS,
GJI
125,
768-780
774
F.
Courboulex
et
al.
d
we
7
k
sar
\
LIMN
n
\
S
k
Patras
Aigion
s-
Figure
5.
Three-component velocity seismograms
for
station
LIMN, SERG
and
MARM
for the main earthquake
(B)
and for the smaller one
(S).
Seismograms
of
the smaller event are scaled
by
a factor of
60
with respect to the seismograms
of
the main shock.
that the fit is worst on the vertical components. This can be
easily explained by the scarse information from
S
waves
on
the vertical component. The amplitude
of
S
waves is low and,
consequently, contributes very little to our calculation of the
L,
norm misfit function.
We observe an important difference between the three
apparent source time functions. While the main peak source
duration at station
LIMN
is about 0.1
s,
the duration at
station SERG is about
0.2
s
and that at station MARM is
about
0.25
s.
The seismic rupture seems, therefore, to move
towards the north-east.
SPATIO-TEMPORAL
SOURCE
MODEL
Isochron construction
In order to constrain the functional model space
of
possible
slip-velocity distribution, we should first define the possible
active region for each fault plane. We use isochron construction,
as
defined by Bernard
&
Madariaga (1984) and Spudich
&
Frazer (1984) for constraining the final extension of the rupture
area (Zollo
&
Bernard 1991b). Starting from the nucleation
point, the rupture propagates with a constant velocity, and
slip is assumed to have a step-like shape in time. Radiation
from
points
on
the fault which contribute to the S-wave pulse
at
time
t
along the seismogram belongs to a so-called isochron.
These isochrons are geometrically defined by
t
=
K@O>
r1)
+
ma,
XI,
(9)
where
ro
and
rl
denote the nucleation and isochron points and
x
denotes the receiver position.
T,
represent the rupture time
while
T,
is the wave-propagation time. The traveltimes are
inferred assuming a constant rupture-propagation velocity. If
we draw the isochrons for the final extension of the rupture at
each station, the intersection
of
the three isochrons delimits a
zone that must contain the real fracture area. This area depends
on the rupture velocity we consider for the calculation. We
chose an upper limit of rupture velocity equal to the shear-wave
velocity. Because the rupture propagates at the same speed as
the energy propagates along the fault plane, the rupture
velocity is lower than the Rayleigh velocity and, consequently,
lower than the shear-wave velocity. We have, therefore,
defined the maximum possible ruptured area. We discretize
the fault plane into several subfaults, and the point-source
approximation is imposed at the subfault scale.
For each of the two possible fault planes, the active fracture
area has a different shape. Fig. 8 shows a rupture propagation
towards the north-north-east for the two fault planes. The
shape and the area of the ruptured zone is very different in
the two cases. For the near-vertical plane, the rupture zone
has an elongated shape and may cover an area of 1 km2; for
the horizontal plane, the rupture area is almost circular and
much smaller
(0.4
km’). The up-dip rupture propagation
obtained for the vertical plane is consistent with the obser-
vation that many earthquakes initiate near the bottom of the
source area and then rupture propagates towards the surface
(Sibson 1982; Mori
&
Hartzell 1990).
Slip
inversion
In order to produce a more refined solution of the slip-velocity
distribution, we can use the amplitude information and perform
an inversion with the simulated annealing method to determine
the slip distribution on the two possible fault planes. In this
inversion, the rupture velocity is kept constant and a circular
rupture model is imposed. The beginning of rupture
is
taken
0
1996
RAS,
GJl
125,
768-780
Source investigation
of
a small event
775
0.0
0.1
0.2
0.3
0.4
0.5
Time(Sec)
t
0.0
0.1
0.2
0.3
0.4
0.5
Time(Sec)
Station
LIMN
Station
SERG
Station
MAW
0.0
0.1
0.2
0.3
0.4 0.5
Time(Sec)
Figure6.
Deconvolved
STF
at
the
three
stations
obtained
by
deconvolution
of
the
three
components together.
The bold
line represents the
average solution and
dashed
lines
the error
estimates.
as the beginning
of
the main pulse identified on the STF.
Consequently, we only require a relative time-scale
The space discretization
Ax
obeys the inequality
Ax
5
Vmin*At,
where
Kmin
is the minimum possible rupture
velocity (Herrero
1994)
and
At
is the same time-step as used
for the deconvolution process. The maximum slip velocity is
estimated by trial and error starting from initially high values
and decreasing them through numerical tests.
The misfit function for this inversion is expressed as follows:
3N
C=
C
1
(STF,,,(k,
a)-
STF,,,fk
n))',
(10)
k=l
n=l
where the index
k
is over the three stations and index
n
is
over
the number of points of the STF. The term STF,,, represents
the source time functions calculated by deconvolution using
expression
(7)
at a given station, and
STF,,,,
that obtained by
summation of slip velocities on the fault plane using eq.
(8).
As with deconvolution, we have developed a procedure to
estimate only the perturbation of the misfit function for the
modified subfault, reducing the computation time for the
simulated annealing process. Moreover, we perform the for-
ward problem very efficiently because instead of calculating
the synthetic seismogram at each station, we need only sum
the slip-velocity amplitudes delayed by the rupture and propa-
gation durations. This is the advantage of the two-step inver-
sion that we propose. In a small number
of
iterations, we
reach a good fit of the three apparent source time functions.
Another parameter has to be taken into account in this
model: the rise time of each subfault source time function. We
first assumed a step-like STF, which means that, in theory,
a
point on the fault reaches its maximum slip instantaneously.
Because
of
numerical discretization, the rise time we considered
is a multiple of
At.
We also considered models where the rise
time is longer for each subfault: then, the radiation emitted
from a given point on the fault plane involves
a
higher number
of
points in time on the seismograms.
RESULTS
We attempt to solve the problem using different rupture
velocities and different rise-time durations. Results
of
the
minimum-misfit values obtained for the two fault planes are
shown in Fig.
9.
A
minimum value is obtained for a rupture
velocity of
3
km
s-'
and a rise time equal to twice
At.
For
both possible fault planes, we invert the final slip-velocity
distribution with the simulated annealing method. The time
step
At
is equal to
0.03
s
and the spatial step
Ax
to
100
m.
In Figs
10
and
11
the distribution of cumulative slip at
three different rupture times is shown for subvertical and
subhorizontal fault planes, respectively. The planes are oriented
0
1996
RAS,
GJI
125,
768-780
776
F.
Courhoulrx
et
al.
Station
LIMN
1
Station
SERG
Station
MARM
0.0
0.1
0.2
0.3
0.4
0.5
0.6
0.7
0.8
0.9
1.0 1.1
0.0
0.1
0.2
0.3
0.4
0.5
0.6
0.7
0.8
0.9
1.0
1.1
0.0
0.1
0.2
0.3
0.4 0.5
0.6
0.7
0.8
0.9
1.0
1.1
Timefs) Time(sf Timefs)
Figure
7.
Observed (hold lines) and synthetic (thin lines)
seismograms
obtained by convolution
01
thc average
STF
and thc
EGF
at
each station.
Vertical scale
is
the
same
for
each component
of
a
station
along the strike and dip directions. The origin time, which is
associated with the nucleation,
is
represented by a black
diamond. These results show a possible rupture history. Along
both planes, the total active area is between 500 and
1100
mz,
which is much smaller than the value estimated with the limit-
isochron construction, and the rupture direction is towards
the north-north-east.
Along the subvertical plane, the spatial evolution
of
the
rupture is not continuous, with a jump from the nucleation
point to the maximum area
of
slip and almost no slip velocity
between them. The distribution of the final slip on the sub-
horizontal plane shows
a
more credible rupture pattern. In
this case, the rupture propagation
is
continuous from the
nucleation point
to
the edges of the fractured area. The
consistency
of
this last solution and the generally smaller value
of
the misfit function (see Fig. 9) suggest that the subhorizontal
fault plane was probably the active plane.
In order to obtain an absolute value for
slip
(the values
on Figs
10
and
I1
were scaled by a slip factor), the seismic
moment,
M,,
of the event was set equal to the moment derived
from the moment-magnitude relation (Thatcher
&
Hanks
1973):
(11)
The computation of seismic moments by Wajeman
ef
d.
(
1995)
from
six
stations gives an average value
of
1
x
lo2'
dyne cm.
We have also estimated the seismic moment using the
expression from Boatwright (1980); this gives a value of about
0.8
x
lo2' dyne cm. Using the definition of the seismic moment,
log
M"
=
l.SM,>
+
16.0.
M,
=
@A,
(12)
where
p,
the rigidity, is set equal to 3
x
10"
dyne cm2, we can
deduce a total average slip,
D,
over the fault plane. The static
stress drop is given by Kanamori
&
Anderson (1975) as:
AO
=
Cp(D/L)
,
(13)
where
C
is a geometrical factor of about 1.0 and
L
is the fault
dimension, quantities estimated by our analysis. Results for
stress drop, total active arca and avcrage total slip are shown
in
Table 1 for the two possible fault planes and two different
rise times.
The values are bounded by the uncertainties
of
the estimation
of
the effective active area on the fault. This gives
us
values of
the average total slip of between
0.1
and
1
cm and a stress
drop of between
I
and
10
bar for a rise time equal to
At,
and
a
stress drop that can reach
30
bar for a rise time equal to
twice
At.
We do not show results for longer rise times because
the misfit function is not satisfactory.
DISCUSSION AND CONCLUSION
The values that we obtain depend on the kinematic model
that we use. We apply a model where the energy is radiated
by discontinuities in the slip velocity, assuming a constant
rupture velocity and the same rise time for each point. We
chose the best value
of
this velocity using the misfit function.
With
a
smaller value, the area involved would have been
smaller and the stress drop higher.
We have also seen in Table
1
that the inversion is sensitive
to
the chosen rise-time value. Indeed. when the radiation
duration of a given point is very short, a higher number
of
8
1996
RAS,
GJI
125,
768-780
Source
invmtigution
of
u
smull
merit
777
Strike:
300
Strike:
88
2.0
1.5
1.0
0.5
0.0
4.5
.1.0
-1.5
7
-2.0 .1.5
-1.0
4.5
0.0
0.5
1.0
1.5
2.0
20
1.5
fl
0.5
"O
0.0
4.5
4.0
.IS
-2.0
2.0
1.5
1.0
0.5
0.0
4.5
.1.0
-1.5
-2.0
2o
W)
.20
.1.5
.l.O
4.5
0.0
0.5
1.0
1.5
Hypocentn
location
Figure
8.
Limit isochrons over the two fault planes. The rupture velocity is taken
as
the shear-wave velocity. Zones within dashed frames represent
the two areas that will be used
for
inversion.
active points
is
needed
to
fit
the data and consequently
the
the Patras Gulf area (Rigo
1994).
Indeed, the distribution
of
active fault plane has
to
be larger and the stress drop deduced aftershocks leads
us
to
believe that there
is
a subhorizontal
is
lower. For each case the stress drop remains very low; this
is
sliding zone in this area. Conclusions about the large-scale
consistent with other determinations for events
of
a similar tectonics cannot be obtained just by looking at small-scale
size (Mori
&
Hartzell
1990).
rupture phenomena, but these can provide an additional
Our results concerning the choice
of
the fault plane are argument in favour
of
a particular interpretation.
in good agreement with the seismotectonic deductions from In the present study, only three stations were available, but
0
1996
RAS,
GJI
125,
768 .780
778
F.
Courhoulex
et al.
Rise
Time
=
0.03s
Rise
Time
=
0.06s
Rise
Time
=
0.09s
3414
2
_1r4
I41
3
~~ _.___.~~
:2 22
3
-
_
._._
22
_
__
-
0
0
0
2.6
2.7
2.8
2.9 3.0
3.1
3.2
2.6
2.7 2.8 2.9 3.0 3.1
3.2
2.6
2.7 2.8 2.9 3.0
3.1
3.2
Rupfure
VelOcityf&m/s)
Rupture
Velocityh/s)
Rupture
Velocityfkm/s)
Figure
9.
Mistit
function
for
different rupture velocities and three different rise-time values. Results arc shown for the subvertical fault plane
(dashed line) and the subhorizontal fault plane (continuous line).
1
.a
krn
0.5
0.0
0.0
T=0.12s
T
=
0.24
s
0.5
kin
T
=
0.36
s
+
Nucleation point
0
50
100
150
200
250 300 350
400 450
500 550
Figure
10.
Cumulative slip distribution on the subvertical fault plane at three different rupture times obtained for a rupture velocity
of
3
km
s-’
and a rise time equal to
0.06
s.
The scale represents
a
slip factor.
they were especially well distributed in azimuth. This analysis
shows what kind
of
results this method can provide. Given
a
larger number of data, we could complicate the model that we
use for the forward problem. For example, it is possible to
consider
a
different rise-time value for each subfault STF,
or
a
non-constant rupture velocity.
The inversion method that we propose provides an analysis
tool
that can be used to investigate the rupture details of small
events. Using seismograms
of
a
smaller earthquake as empirical
Green’s functions eliminates the effects
of
propagation through
complex media, and makes
it
possible to separate propagation
and source factors on seismograms. The simulated annealing
method that we developed for deconvolution enabled
us
to
recover
a
positive and stable source time function at each
station with an error estimation. From these functions, we
were able to estimate the slip distribution on given fault planes
in an efficient way. This two-step inversion is simpler in terms
of
computational effort and more stable than inverting com-
plicated seismograms in one step. In fact, we can check the
spatial variation of the information we gather with the apparent
STF functions before starting the second-step procedure.
This method enabled
us
to highlight directivity effects and
provided arguments for choosing which of the two fault planes
determined
by
the focal mechanism was the active one.
A
good
azimuthal station coverage is essential in this study, and the
higher the number of stations we have, the better the resolution
of the problem.
With the simple kinematic rupture model that we employ
we can deduce the average active area
of
the fault and a
static stress-drop value. These values are compatible with
a
hypothesis
of
self-similar scaling, even for small earthquakes
(Aki
&
Richards
1980),
but we can not overrule
a
possible
breaking of scaling laws for small earthquakes from
our
study.
For example, the hypothesis of a constant fault area for small
earthquakes and then a decreasing stress drop cannot be
inferred from our work.
ACKNOWLEDGMENTS
We are grateful to
D.
Hatzfeld and
H.
Lyon-Caen, who directed
the field experiment, as well as to
K.
Macropoulos for his help.
We thank the people who worked on the
1991
Patras data set,
0
1996
RAS,
GJI
125,
768-780
0.5
km
0.0
-0.5
T
=
0.09
s
0.0
05
0.0
-0.5
05
km
T
=0.15s
0.0
Source investigution oja
small
event
T
=
0.27
s
779
05
0.0
-0.5
05
00
0.5
+
Nucleation point
0
50
100
150
200
250
300
350
400
450
500
550
600
Figure
11.
Cumulative slip distribution on the subhorizontal fault plane at three ditrerent rupture times obtained for a rupture velocity of 3 km
s-'
and a rise time equal to 0.06
s.
The scale represents a slip factor.
Table
1.
Area(km2)
Average slip(cm) Stress drop(bar)
Rise-tirne=Al Sub-vertical plane
0.1
<
A
<
0.25
0.12
<
D
<
0.33
0.7
<
Au
<
3.3
1.7
<
Au
<
9
Risetime=:!
x
At Sub-vertical plane
0.03
<
A
<
0.12
0.27
<
D
<
1.1 2.3
<
Au
<
19
2.8
<
Au
<
33
Sub-horizontal
plane
Sub-horizontal plane
0.05
<
A
<
0.15
0.02
<
A
<
0.1
0.22
<
D
<
0.66
0.3
<
D
<
1.6
M.P. Bouin,
H.
Le
Meur and especially A. Rigo, for accurate
focal mechanism determinations,
C.
Wajeman
for
moment
calculations and
H.
Lyon-Caen for her help in retrieving data.
We would also like to thank
0.
Scotti for
a
critical review and
the two anonymous reviewers
for
their accurate remarks. This
study was supported by DRM
of
the French Ministry for
Environment (SRETIE
90392),
INSU/CNRS through the
pro-
grammes PNRN
1994
and DBT-InstabilitCs and the Ministry
of
National Education through Jeune Equipe RUaDE.
Publication no.
2
de l'UnitC CNRS-UNSA Geosciences Azur.
REFERENCES
Aki,
K.
&
Richards, P., 1980.
Quantitative seismology: theory and
methods,
W.H. Freeman, San Francisco, CA.
Ammon, C., Velasco, A.
&
Lay,
T.,
1993. Rapid estimation
of
rupture
directivity: application
to
the 1992 Landers (Ms
=
7.4) and Cape
Mendocino (Ms
=
7.2) California earthquakes,
Geophys. Res. Lett
20,
97-100.
Bernard, P.
&
Madariaga, R., 1984. A new asymptotic method for the
modelling
of
near-field accelerograms,
Bull. seism.
Soc.
Am.,
74,
539-557.
Boatwright,
J.,
1980. Spectral theory for circular seismic sources: simple
estimates of source dimension, dynamic stress drop and radiated
energy,
Bull.
seism.
Soc.
Am.,
70,
1-28.
Cerny, V., 1985.
A
thermodynamical approach
to
the travelling
salesman problem,
J.
Optimisation Theory Appl.,
45,
41-51.
Courboulex, F., Virieux,
J.
&
Gilbert,
D.,
1996. On the
use
of cross-
validation theory and simulated annealing for deconvolution,
Bull.
seism.
Soc.
Am.,
in press.
Creutz, M., 1980. Monte Carlo study of quantized SU(2) gauge theory,
Phys. Rev.,
21,
2308-2315.
Feignier, B., 1991. How geology can influence scaling relations,
Tectonophysics,
197,
41-53.
Frankel, A.
&
Wennerberg, L., 1989. Microearthquake spectra from
the Anza, California, seismic network site response and source
scaling,
Bull. seism.
Soc.
Am.,
79,
581-609.
Fukuyama, E.
&
Irikura,
K.,
1986. Rupture process of the 1983 Japan
Sea (akita-oki) earthquake using a waveform inversion method,
Bull. seism.
Soc.
Am
76,
1623-1640.
Gibert,
D.
&
Virieux,
J.,
1991. Electromagnetic imaging and simulated
annealing,
J.
geophys. Rex,
96,
8057-8067.
Hartzell,
S.,
1978. Earthquake aftershocks as Green's functions,
Geophys. Res. Lett.,
5,
1-4.
Hartzell,
S.,
1989. Comparison of seismic waveform inversion results
for a rupture history
of
a
finite fault: application to the 1986
North Palm Springs, California, earthquake,
J.
geophys. Res.,
94,
7515-7534.
Hatzfeld,
D.
et al.,
1993. Subcrustal microearthquake seismicity and
fault plane solutions beneath the Helenic arc,
J.
geophys. Res.,
98,
Helmberger,
D.
&
Wiggins, R., 1971. Upper mantle structure
of
the
mid-western United States,
J.
geophys. Res.,
76,
3229 3245.
Herrero,
A.,
1994. Parametrisation spatio temporelle et spectrale
dessources sismiques: application au risque sismique,
Th2se
de
doctorat,
University of Paris 6, France.
Hough,
S.,
Seeber, L., Lerner-Lam, A,, Armbruster,
J.
&
Guo,
H.,
1991. Empirical Green's functions analysis of Loma Prieta after-
shocks,
Bull. seism.
Soc.
Am.,
81,
173771753,
Huang, M., Romeo,
F.
&
Sangiovanni-Vincentelli,
A,,
1986. An efficient
general cooling schedule for simulated annealing,
Proc.
IEEE
Int.
Conf.
Computer-Aided Design, Santa Clara,
381-384.
Jackson, J.
&
McKenzie,
D.,
1988. The relationship between plate
motions and seismic moment tensors, and the rates
of
active
deformation in the Mediterranean and Middle East,
Geophys.
J.
Int.,
9861 9870.
93,
45-73.
0
1996 RAS,
GJI
125,
768-780
780
F.
Courhoulex
et
al.
Jackson, J., Gagnepain, J Housman.
G
King,
G.,
Papadimitriou, P.,
Soufleris,
C.
&
Virieux,
J
1982.
Seismicity. normal faulting and the
geomorphological development
of
the gulf of Corinth (Greece): the
Corinth earthquakes
of
February and March 1981,
Earth
planet.
Sci.
Leti
57,
371 -397.
Kanamori,
11.
&
Anderson. D.L 1975. Theorical basis of some
empirical relations in seismology,
Bull.
,
1073
-
1095.
Kanamori,
H.,
Thio, H., Dreger,
D.,
Hauksson, E.
&
Heaton,
T.,
1992.
Initial investigation
of
the Landers California earthquake of the
28
June
1992
using TERRAscope,
Geophys.
Kcs.
Lett
19,
2267 2270.
Kirkpatrick,
S.,
Gellat,
J.
&
Vecchi.
M.,
1983. Optimization by
siinulated annealing.
Scirnw,
220,
671
680.
Lawson, C.L.
&
Hanson, R., 1974.
Solring Lrust
Squcirc.c
Prohlwis,
Prentice-Hall, Englewood Cliffs,
NJ.
Le Meur,
H
1994. Tomographie 3D de la crohte dans la region de
Patras (Grece),
PhD
thrsis,
University of Paris 7, France.
Lc Pichon.
X.
&
Angelier,
.I.,
19x7. Thc Hellenic arc and trench system:
ii
key to the evolution of the Eastern Meditcrrnnean area,
Trcronophysics,
60,
1
-42.
Lyon-Caen, H.
et
a/.,
1994. Seismotectonics and deformation of the
Gulf
of Corinth,
EOS.
Trans.
Am.
geophys.
Un.,
75,
116.
Metropolis,
N
Rosenbluth,
A.,
Rosenbluth,
M.,
Teller,
A.
&
Teller,
E
1953. Equation of state calculation by fast computing machines,
J.
Chem.
Php.
21,
1087-1092.
Mori.
J
1993. Fault plane determination for three small earthquakes
along the Sau Jacinto fault. California: search for cross faults,
J. geophqs.
Res.,
98,
7
1
1-723.
Mori,
J.
&
Hartzell.
S.,
1990.
Source inversion of the 1988 Upland.
California, carthquakc: dctcrmination
of
a
fault plane for
a
small
cvent,
Hull.
srisni.
SOC.
Am
80,
507-518.
Mueller,
C.,
1985.
Source pulse enhancement by deconvolution
of
an
empirical Green's function,
Geophys.
Res.
Lc'tt
12,
33-36.
Ori,
G.,
1989. Geologica history
of
the extensional basin of the Gulf
of
Corinth, Greece,
Geology,
17,
918-921.
Rigo,
A.,
1994. Etude sismotectonique et gtodtsiquc du golfe de
Corinthc (Gri-ce),
PhD
Th(~,si.s.
University
of
Paris, France.
Rothman,
D.,
1986.
Automatic estimation of large residual statics
corrections,
Geophysics.
51,
332-346.
Scholz, C., 1982. Scaling laws
for
large earthquakes: consequences for
physical models,
Bull.
seism.
Soc.
Am
72,
1-14.
Sibson, R.,
1982.
Fault zone models, heat
flow
and the depth distri-
bution
of
earthquakes
in
the continental crust of thc lJnited States.
Bull.
scivn.
Sot,.
Am.,
72,
15
1
~
163.
Spudich. P.
&
Frazer, L., 1984. Use
of
ray theory to calculate high
frequency radiation froin earthquake sources having spatially
variable rupture velocity and stress drop,
Bull.
seism.
Soc.
Am
74,
2061
2082.
Tarantola,
A,,
19x7. lnversc problem theory: methods
for
data
fitting
and modcl parametcr estimation, Elsevier, Ainstcrdam.
Thatcher, W.
&
Hanks,
T.,
1973. Source parameters of southern
California earthquakes,
J.
geophxs.
Res.,
78,
8547T8576.
Velasco,
A.,
Ammon, C.
&
Lay, T., 1994. Empirical Green function
deconvolution of broadband surface waves: rupture directivity
of
the
1992
Landers, California (Mw
=
7.3), earthquake.
Bull.
.
sot
Ant.
84,
735 ~750.
Wajeman, C., Bard. P Hatdeld, D., Diagourtas. D., Makropulos, K.
&
Gariel, J.C.,
1995.
Experimental tests on the empirical Green's
Function methods,
Proc.
5th Int.
Conf:
in
Seismic
Zonation.
Nice.
France.
Zollo,
A.
&
Bernard,
P.,
1991a.
Fault mechanisms from near source
data: joint inversion of
s
polarizations
and
f'
polarities,
(;rophy.s.
J.
bit
104,
441 451.
20110,
A.
&
Bernard, P., 1991b. How does an asperity break? New
elements from the waveform inversion
of
accelerograms for the 2319
UT.
October
15,
1979, Imperial Valley aftershock.
J.
grophys.
Res.,
96,549 573.
Zollo,
A.,
Capuano,
P.
6i
Singh.
S.,
1995. Usc of small earthquake
records to determine the source function of a larger earthquake: an
alternative method and an application,
Bull.
seism.
Soc.
Am.,
85,
1249-1256.
0
1996 RAS,
GJI
125,
768 780