Mass transfer of proteins in chromatographic media: Comparison of pure and crude feed solutions
Bạn đang xem bản rút gọn của tài liệu. Xem và tải ngay bản đầy đủ của tài liệu tại đây (1.64 MB, 11 trang )
Journal of Chromatography A 1676 (2022) 463264
Contents lists available at ScienceDirect
Journal of Chromatography A
journal homepage: www.elsevier.com/locate/chroma
Mass transfer of proteins in chromatographic media: Comparison of
pure and crude feed solutions
Markus C. Berg a, Jürgen Beck b, Alex Karner b, Kerstin Holzer b, Astrid Dürauer a,b,
Rainer Hahn a,b,∗
a
Austrian Center of Industrial Biotechnology, Muthgasse 18, Vienna 1190, Austria
Department of Biotechnology, Institute of Bioprocess Science and Engineering, University of Natural Resources and Life Sciences Vienna, Muthgasse 18,
Vienna 1190, Austria
b
a r t i c l e
i n f o
Article history:
Received 30 March 2022
Revised 17 June 2022
Accepted 18 June 2022
Available online 19 June 2022
Keywords:
Pore diffusion
Solid diffusion
Grafted media
Ion exchange chromatography
hFGF2
a b s t r a c t
Elucidation of intraparticle mass transfer mechanisms in protein chromatography is essential for process
design. This study investigates the differences of adsorption and diffusion parameters of basic human fibroblast factor 2 (hFGF2) in a simple (purified) and a complex (clarified homogenate) feed solution on
the grafted agarose-based strong cation exchanger Capto S. Microscopic investigations using confocal laser
scanning microscopy revealed slower intraparticle diffusion of hFGF2 in the clarified homogenate compared to purified hFGF2. Diffusive adsorption fronts indicated a strong contribution of solid diffusion to
the overall mass transfer flux. Protein adsorption methods such as batch uptake and shallow bed as well
as breakthrough curve experiments confirmed a 40-fold reduction of the mass transfer flux for hFGF2
in the homogenate compared to pure hFGF2. The slower mass transfer was induced by components of
the clarified homogenate. Essentially, the increased dynamic viscosity caused by a higher concentration
of dsDNA and membrane lipids in the clarified homogenate contributed to this decrease in mass transfer. Moreover, binding capacity for hFGF2 was much lower in the clarified homogenate and substantially
decreased the adsorbed phase driving force for mass transfer.
© 2022 The Authors. Published by Elsevier B.V.
This is an open access article under the CC BY license ( />
1. Introduction
Mass transfer of proteins in chromatographic media is a slow
diffusional process. Typically, different transport resistances appear
in adsorption systems with porous particles [1,2]. Firstly, proteins
must pass through a stagnant film around the particle before diffusional transport into the particle itself can occur. Properties of the
liquid phase surrounding each particle affect these external mass
transfer mechanisms. Concentration differences across the boundary layer and the film thickness define the impact of film resistance [2–4]. The type of diffusion mechanism is defined by the
structural properties of the chromatographic resin and buffer conditions as well as the protein characteristics. Pore diffusion is dominant for macro-porous resins which can be fully penetrated by a
protein of a size smaller than the pore structure. During pore diffusion, surface attachments and detachments can take place repeat-
∗
Corresponding author at: Department of Biotechnology, Institute of Bioprocess
Science and Engineering, University of Natural Resources and Life Sciences Vienna,
Muthgasse 18, Vienna 1190, Austria.
E-mail address: (R. Hahn).
edly. The main driving force of this mechanism is controlled by the
solute concentration gradient in the liquid phase of the pore. Solid
diffusion, on the other hand, occurs for proteins in the adsorbed
state. In contrast to pore diffusion, detachment does not typically
take place for adsorbed proteins. This phenomenon enables an enhanced mass transfer caused by an absorbed protein concentration
gradient. It is important to mention that other attributes such as
narrow pores or pores blocked by adsorption of large molecules
can lead to hindered diffusion [5].
Pore diffusion coefficients between 10−6 – 10−8 cm²/s and solid
diffusion coefficients ranging from 10−8 to 10−10 cm²/s have been
reported for various proteins [1,6]. The order of magnitude depends on the properties of the protein and the mobile phase as
well as characteristics of the stationary phase [1,7,8]. Besides conventional macro-porous chromatography resins, polymer grafted
media are frequently used for protein purification [2]. These special
chromatographic materials contain polymer chains grafted onto
the particle surface. Such modifications enhance binding capacity
as well as mass transfer, as compared to conventional media [9–
16]. According to Tao et al. [8], effective pore diffusion coefficients
that are greater than the diffusivity for proteins in free solution
/>0021-9673/© 2022 The Authors. Published by Elsevier B.V. This is an open access article under the CC BY license ( />
M.C. Berg, J. Beck, A. Karner et al.
Journal of Chromatography A 1676 (2022) 463264
the pore diffusion model can be obtained when Ds = 0 and vice
versa for the solid diffusion model when De = 0.
For column adsorption operations Eq. (1d) is replaced by:
can be achieved on dextran grafted resins for ion exchange processes. This result may be explained by a transport enhancement
facilitated by an electrostatic driving force or a coupling transport
of proteins and ions [2,9].
The mass transfer mechanisms of single or two component systems on ion exchange media as well as proteins on affinity resins
(such as protein A) have been previously investigated [1,7,17–21].
However, little data is available on diffusional adsorption processes
of proteins in complex solution such as clarified bacterial homogenates [22,23]. In general, most isoelectric points of E. coli host
cell proteins are in the acidic range [24]. This enables purification of positively charged recombinant proteins on cation exchangers with hardly any coeluting process-related impurities if binding
conditions are adjusted properly. In principle, this high selectivity
should allow the determination of protein mass transport parameters with single component adsorption models.
The aim of the present study was to elaborate the differences
in mass transfer mechanisms of purified basic human fibroblast
growth factor 2 (hFGF2) and a clarified homogenate containing
hFGF2 overexpressed in E. coli. This basic protein exhibits an isoelectric point of 9.6 at a molecular size of 17.2 kDa in monomeric
form [25,26] and is therefore well suited for the purification by
cation exchangers. For all our main investigations, the strong cation
exchange resin Capto S from Cytiva (Uppsala, Sweden) was chosen
as the stationary phase. This resin is based on an agarose backbone grafted with dextran inclusions [8,9]. Since host cell-related
impurities such as DNA and membrane lipids are present in the
clarified homogenate, dynamic viscosity is increased significantly
compared to the pure protein solution which affects the diffusion mechanisms [27,28]. For determining parameters describing
the mass transfer of the protein of interest, batch and packed bed
methods were performed.
εb
∂C
∂ q¯
∂C
∂ 2C
+ ( 1 − εb )
+u
= εb DL 2
∂t
∂t
∂z
∂z
with boundary conditions:
t = 0C = 0
(2a)
z = 0uCF = uC −
r = r p De
∂c
∂q
+ Ds
= k f (C − c )
∂r
∂r
(2c)
For a rectangular isotherm, an analytical solution for batch adsorption and film and pore diffusion control has been obtained by
Teo and Ruthven [30]:
1
C0 De t
= 1−
I2 − I1
qmax r p 2
Bi
(3)
with:
I1 =
1
1
√ tan−1
3
λ
I2 =
1
ln
3
=
VM qm
V C0
(1)
λ=
(1a)
1
λ3 + η3 λ + 1
λ3 + 1 λ + η
ln
6λ
+
with boundary conditions:
∂c
=0
∂r
(2b)
2.2. Analytical solutions for film and pore diffusion control
A general model for mass transfer for batch adsorption assuming parallel mass transfer of pore and solid diffusion mechanisms
within the bead pores as given by [29]:
r=0
∂C
∂z
where ε b is the extra-particle void fraction, z is the bed length
coordinate, DL is the axial dispersion coefficient and L is the bed
length.
2.1. General model for pore and solid diffusion
t = 0c = 0q = 0
εb DL
∂C
=0
∂z
z=L
2. Theory
∂q 1 ∂ 2
∂c
∂q
=
r
De
+ Ds
∂ t r2 ∂ r
∂r
∂r
(2)
−1
2η − λ
√
λ 3
3
− tan−1
2−λ
√
λ 3
λ3 + η3
λ3 + 1
(3a)
(3b)
(3c)
1/3
(3d)
η = (1 − F )1/3
(3e)
k f rp
De
(3f)
(1b)
Bi =
(1c)
where qmax is the maximum binding capacity, Bi is the Biot number, and F is the frictional approach to equilibrium.
The solutions for film mass transfer control are
3k f VM
VM dq¯
dC
= −
C − c|r=r p = −
dt
r pV
V dt
(1d)
3k f VM
C
= exp −
t
C0
rp V
C = C0t = 0
(1e)
and
and material balance:
3k f VM
q
1
=
1 − exp −
t
qm
rp V
where q is the solute concentration in particle, t is the time, r the
particle radial coordinate, De the effective pore diffusivity, Ds is the
effective solid diffusivity, c is the solute concentration in the pore
fluid, rp is the particle radius, C the solute concentration in the
bulk fluid, C0 is the initial protein concentration, VM is the volume
of the particles, V is the bulk solution volume and q¯ is the particleaverage solute concentration. A reduction of the general model to
(4)
(5)
For shallow-bed adsorption operations the solution is [29]:
ε p Det C0
r p 2 qm
2
=
1
1
1
1
−
1−
F − (1 − F )2/3
2
3
Bi
2
(6)
M.C. Berg, J. Beck, A. Karner et al.
Journal of Chromatography A 1676 (2022) 463264
A constant pattern solution for film and pore diffusion in column adsorption described by Weber et al. [31] is given as:
C
δ
=1−
exp {[−τ + ξ + 1 − ln (1 + δ )]/δ}
C0
1+δ
15
2η − 1
N pore (τ1 − 1 ) = √ tan−1
√
3
3
for
−
15
ln
2
1 + η + η2 −
5π
5
+
ln 1 − η3 + 1 − √
Bi
2 3
1
3
τ − ξ ≥ 1 − ln(1 + δ )
when δ ≤ 1.
τ is the dimensionless time and ξ is the bed length parameter.
These parameters are defined as:
(7)
where
τ1 =
ut
L
N pore =
− εb
=
ξ=
(7d)
CF
1/2
Re
ε
S c 1/3
hFGF2 was produced in Escherichia coli according to the procedure published by Sauer et al. [25]. BL21 cells containing hFGF2
were resuspended in 50 mM Na2 HPO4 /NaH2 PO4 pH 6.5 to yield
in a 60 gCDM/L suspension. The suspension was homogenized at
700/70 bar for 2 passages on a Niro Soavi PANDAPlus 20 0 0 (GEA,
Parma, Italy). Removal of cell debris was achieved by centrifugation and a filtration step on a 0.2 μm sterile filter (Fluorodyne EX
EDF, PALL, Dreieich, Germany).
Purification of hFGF2 was performed on a 10 mL Capto S column. The filtered homogenate (100 mL) was loaded and eluted
using a linear gradient ranging from 0 to 1 M NaCl. The protein
eluate was buffer exchanged via a PD-10 desalting column (Cytiva,
Uppsala, Sweden) into 50 mM Na2 HPO4 /NaH2 PO4 , 30 mM NaCl
pH 6.5. Both the clarified homogenate as well as the purified and
buffer exchanged protein solutions were used to conduct the experiments as described in the subsequent sections. A hFGF2 concentration of 2 mg/mL was chosen for all experiments unless otherwise stated.
(8)
2.3. Analytical solution for film and solid diffusion control
For solid diffusion control an analytical solution is given by
[32]:
π
2
∞
n=1
n 2 π 2 Ds t
1
exp −
2
n
r p2
(9)
Eq. (9) is valid for intraparticle mass transfer control if δ ≥ 1.
δ is the diffusion resistance parameter which determines the
controlling mechanism and is described as:
δ
1 k f r p C0
=
5 Ds qmax
3.2. Sodium dodecyl sulfate polyacrylamide gel electrophoresis
(SDS-PAGE)
(10)
SDS–PAGE was performed in an XCell SureLockTM Mini-Cell
Electrophoresis System (Thermofisher Scientific, Dreieich, Germany) with an EPS 301 power supply (Cytiva, Uppsala, Sweden). A
NuPage 4–12% BIS-Tris gel (Thermofisher Scientific, Dreieich, Germany) was used for separation. All samples were 10-fold diluted
in 50 mM Na2 HPO4 /NaH2 PO4 pH 6.5 prior to application onto the
gel. Separation was carried out according to the manufacturer’s directions after 5 μL of 4x sample buffer (Thermofisher Scientific,
Dreieich, Germany), 2 μL of DTT, and 13 μL of the diluted sample
aliquots were combined and an aliquot (14 μL) was loaded onto
the gels. The separated proteins were fixed with a solution containing 50% ethanol and 10% glacial acetic acid. Protein bands were
stained with Coomassie blue G 250 for 30 min. Destaining was
performed with a solution containing 25% ethanol and 8% glacial
acetic acid. Destained gels were scanned on an Epson Perfection V700 Photo scanner (EPSON, Meerbusch, Germany). SeeBlueTM
Plus2 pre-stained protein standard (7 μL) (Thermofisher Scientific,
Dreieich, Germany) was used as the molecular mass marker on
each gel.
An analytical solution for the column adsorption for external
mass transfer and solid diffusion has been obtained by Yoshida
et al. [33]:
C
1
= exp
C0
δ
(16)
3.1. Sample preparation
where Sh is the Sherwood number, Re is the Reynolds number and
Sc is the Schmidt number.
6
3 (1 − ε ) k f L
rp
u
3. Materials and method
where u is the superficial velocity, τ 1 is the dimensionless time
and CF is the feed protein concentration. The film mass transfer
coefficient kf for packed bed operation can be obtained from the
following correlation:
F =1−
(15)
(7c)
(1 − εb )qmax
Sh = 1.15
3k f C0
εL
t−
r p qmax
u
and
(7b)
1/3
C
CF
η = 1−
τ=
(7a)
15(1 − εb )De L
ur 2p
(14)
τ −ξ +δ−1−
1
δ
for
τ − ξ ≤ −δ + 1 +
1
δ
− ln
C
δ
=1−
exp
C0
1+δ
1+δ
(11)
δ
−τ + ξ − δ + 1 +
1
δ
ln
1+δ
δ
/δ
for
τ − ξ ≥ −δ + 1 +
1
δ
− ln
1+δ
δ
(12)
when δ ≥ 1, and:
C
= exp (τ − ξ − 1 )
C0
3.3. Adsorption isotherms
for
τ − ξ ≤ 1 − ln(1 + δ )
A 50 mM Na2 HPO4 /NaH2 PO4 30 mM NaCl pH 6.5 buffer was
used for slurry preparation of the Capto S resin (Cytiva, Uppsala,
(13)
3
M.C. Berg, J. Beck, A. Karner et al.
Journal of Chromatography A 1676 (2022) 463264
Sweden). Specific amounts of slurry were mixed with fixed volumes of either clarified homogenate consisting of hFGF2 or purified hFGF2. In general, the protein concentration of hFGF2 in both
matrices was set to 2–2.1 mg/mL. The resin-protein mixtures were
incubated in 2 mL vials at room temperature for 24 h on an endover-end rotator (Stuart SB3, Cole-Parmer, Stone, Staffordshire, UK)
at 13 rpm. Afterwards, all samples were filtered through 0.22 μm
syringe filters (Millex-GV PDFV, Merck Millipore, Darmstadt, Germany). The filtrate was then quantified via HPLC on a Propac WCX10 (Thermofisher Scientific, Dreieich, Germany) with the dimensions 4 mm x 250 mm. A linear gradient over 2.5 CV ranging from
0 to 1 M NaCl in 100 mM Na2 HPO4 /NaH2 PO4 pH 6.5 was applied
at a volumetric flow rate of 1 mL/min. The amount of bound hFGF2
per mL resin was determined by mass balance calculation. Equilibrium constant KL and maximum binding capacity qmax were determined by fitting the data to the Langmuir model.
Adsorption profiles were fitted to pore and solid diffusion models
Eqs. (6) and ((9)).
3.7. Confocal laser scanning microscopy
Fluorescent labeling of hFGF2 was performed with Rhodamine
RedTM – X dye (Thermofisher Scientific, Dreieich, Germany). Prior
to labeling, hFGF2 was transferred into 500 mM bicarbonate pH
8.5 buffer by using a PD-10 desalting column. labeling dye was
added into a 5 mL vial in a 1:3 dye: protein molar ratio and incubated for 1 h wrapped in aluminum foil. Unbound dye was then
removed by using a desalting column. A labeling ratio of 0.28 was
obtained. Labelled hFGF2 was then added to the protein solution in
a 1:40 mass ratio. Adsorption kinetic experiments were performed
with the labelled protein solutions as described above. Moreover,
microscopy images were recorded with a 40x dry objective and a
resolution of 512 × 512 pixels at a frequency of 400 Hz.
3.4. Adsorption kinetics
For all batch uptake experiments, a 10 mL glass beaker was
filled with 5 mL protein solution. The slurry of Capto S in 50 mM
Na2 HPO4 /NaH2 PO4 (0.078–0.15 mL) was added and stirred on a
magnetic stirrer at 300 rpm. Samples (150 μL) of the protein-resin
suspension were drawn at the predefined time points and immediately filtered through 0.22 μm syringe filters. The filtrate was then
quantified analogously as described for adsorption isotherms. The
film mass transfer coefficient kf was determined by a correlation
for external mass transfer [1,4]. Data obtained via adsorption kinetics were fitted to pore and solid diffusion models by applying
Eqs. (3)–(5) and (9).
Experiments at increased dynamic viscosity were conducted by
adding specific amounts of glycerol (Thermofisher Scientific, Dreieich, Germany) to the protein solutions. Further studies with pure
lysozyme as a model protein as well as Toyopearl Gigacap S (Tosoh,
Griesheim, Germany) and SP Sepharose FF (Cytiva, Uppsala, Sweden) as alternative stationary phases were performed analogously.
4. Results and discussion
4.1. Purification of hFGF2
Based on the purification procedure published by Sauer et al.
[25], a cation exchange chromatography system was selected to
capture the basic hFGF2. To increase capture efficiency the polymer grafted cation exchanger Capto S was chosen instead of CM
Sepharose FF and buffer concentration was reduced. Clarified homogenate containing hFGF2 was loaded onto a Capto S column. In
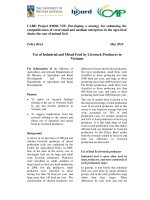
total, 40 mg of hFGF2 were loaded per mL resin. Fig. 1A shows
the absorbance and conductivity profiles of the capture step. A
gaussian-shaped elution peak was obtained without any visible
shoulders. Analysis of the collected fractions by SDS-PAGE revealed
a highly pure eluate fraction as shown in Fig. 1B, lane 14. No additional bands other than the one of monomeric hFGF2 were detected. Since most host cell components of E. coli strain BL21 are
negatively charged at the chosen buffer conditions hardly any impurities were captured and co-eluted in the desorption step. Increasing concentrations of hFGF2 could be detected in the flow
through fractions at the end of the loading step (lanes 3–13). Apparently, hFGF2 was loaded beyond the maximum binding capacity of Capto S. Nevertheless, replacing CM-Sepharose FF by Capto S
substantially increased capacity, and even more importantly, purity
of the eluate was very high. Due to this high selectivity, modeling
of the adsorption was simplified and competitive adsorption models, as described for hFGF2 capture by Kołodziej et al. [20], were
not required.
3.5. Breakthrough curve experiments
Columns packed with Capto S and SP Sepharose FF resin were
purchased from Repligen (Weingarten, Germany). Breakthrough
curves (BTC) were recorded on columns with 0.2 mL and 1.0 mL
column volume corresponding to column dimensions of 0.5/1 and
0.5/5 cm. A 50 mM Na2 HPO4 /NaH2 PO4 30 mM NaCl pH 6.5 buffer
was used for column equilibration. Residence time for all BTC experiments varied between 1 and 10 min. The breakthrough for
hFGF2 in the clarified homogenate was monitored by quantifying
collected fractions via HPLC on a WCX column as described above.
Analytical solutions including external mass transfer were used to
fit all breakthrough profiles for obtaining solid and pore diffusion
coefficients Eqs. (7) and ((11)–(14)).
4.2. Adsorption isotherm
A first estimation of the binding capacity was done by evaluating the capture run profile. Hence, for obtaining accurate values
for the maximum binding capacity qmax as well as for the equilibrium constant KL adsorption isotherms were established from
batch uptake measurements. Both purified hFGF2 and clarified homogenate containing hFGF2 were investigated. For pure hFGF2,
50 mM Na2 HPO4 /NaH2 PO4 30 mM NaCl pH 6.5 was chosen as the
buffer system which exhibited a comparable conductivity as determined for the homogenate (8 mS/cm). Fig. 2 shows the adsorption
isotherms including a fit of the Langmuir adsorption model to the
experimental data. Pure hFGF2 yielded in a maximum binding capacity of 100 mg/mL whereas a qmax of 24 mg/mL was determined
for hFGF2 in the clarified homogenate. Additionally, a 32-fold reduction of the equilibrium constant KL was obtained for the clarified homogenate containing hFGF2.
3.6. Shallow bed adsorption
Capto S resin (5 μL) was transferred into a HR 5/50 column
(Cytiva, Uppsala, Sweden). Silica beads (20 μL of 100 μm beads)
were added for emulating the conditions of a fixed bed [34]. Prior
to sample application the column was equilibrated with 50 mM
Na2 HPO4 /NaH2 PO4 30 mM NaCl pH 6.5. Protein solutions were
pumped onto the column in a circular manner at a flow rate of
1 mL/min. Elution of bound protein after specific timepoints was
achieved by applying a step gradient of 1.0 M NaCl in the equilibration buffer for 1 min. The amount of protein bound was determined by using a linear equation describing the correlation of
the absorbance signal at 280 nm and the protein concentration.
4
M.C. Berg, J. Beck, A. Karner et al.
Journal of Chromatography A 1676 (2022) 463264
Fig. 1. Capture run of clarified homogenate containing hFGF2 on Capto S (CV = 1 mL) (A). 40 mg hFGF2 per mL column volume were loaded. A linear gradient from 0 to
1 M NaCl in 50 mM Na2 HPO4 /NaH2 PO4 pH 6.5 over 4 CV was applied to elute the protein. (B) SDS-PAGE under reduced conditions with Coomassie staining of load, flow
through and eluate fractions of Capto S run shown in (A). Lane 1 molecular weight marker SeeBlue; Lane 2 clarified homogenate/load containing hFGF2 (black); Lane 3 to
13 corresponding to the flow through fractions (blue); Lane 14 represents the eluate fraction (green). Note that hFGF2 has a molecular weight of 17.2 kDa (For interpretation
of the references to color in this figure legend, the reader is referred to the web version of this article.).
Fig. 2. Adsorption isotherms of purified hFGF2 (A) and clarified homogenate containing hFGF2 (B) on Capto S. Absorbed concentration q was plotted against the fluid phase
concentration C. Solid curves represent fits with the Langmuir model.
4.3. Adsorption kinetics
agreement with the isotherm measurements, binding capacity for
hFGF2 in the clarified homogenate was much lower compared to
pure hFGF2. In addition, for both experimental methods, batch uptake and shallow bed adsorption, a significant decrease of the adsorption kinetics of hFGF2 on Capto S in the clarified homogenate
compared to purified hFGF2 was confirmed. For quantitative analysis of the uptake data, we followed a stepwise approach considering different contributions to the overall mass transport. For
that purpose, we used established correlations and structural parameters that had been previously determined. Analytical solutions for batch uptake are available for both mass transfer mechanisms, pore and solid diffusion as described in the theory section. These solutions have been derived assuming a rectangular
adsorption isotherm. For pure hFGF2, the isotherm is highly favorable but not for the clarified homogenate containing hFGF2. All experiments were performed at an hFGF2 concentration of 2 mg/mL
which yielded a constant separation factor of ∼ 0.15 for the clarified homogenate. To investigate if the analytical solution would
lead to a significant error, we compared the analytical to the numerical solution (Fig. A2 in supportive information). We found only
minor differences and as such the analytical solutions can be used
To gain an insight into the mass transfer mechanism, investigation by confocal laser scanning microscopy (CLSM) of the intraparticle mass transport was performed. In general, pore diffusion
and steep isotherms result in a shrinking core behavior with visible sharp fronts. In contrast, solid diffusion is distinguished by
diffusive profiles and fast progression to the center of the particle. As previously shown by Beck et al. [35], pore diffusion only
leads to diffusive fronts if the isotherm is extremely shallow (KL <
0.1). Fig. 3 shows the CLSM images of pure hFGF2 (A) as well as
hFGF2 in clarified homogenate (B). Both systems exhibit diffusive
fronts and progression to the particle center that occurred rapidly,
suggesting a significant contribution of solid diffusion to the mass
transfer. A difference in the mechanism between the two feed solutions is not apparent in this analysis, but it can clearly be seen
that mass transfer of hFGF2 in the clarified homogenate was substantially reduced.
Adsorption kinetics was analyzed via batch uptake in a stirred
tank as well as in a shallow bed adsorption system [34]. Experimental adsorption kinetics at 2.0 mg/mL are shown in Fig. 4. In
5
M.C. Berg, J. Beck, A. Karner et al.
Journal of Chromatography A 1676 (2022) 463264
Fig. 3. CLSM measurements of the adsorption process of purified hFGF2 (A) and clarified homogenate containing hFGF2 (B) on Capto S. hFGF2 was labelled with Rhodamine
Red-X. Measurement points from left to right: 30 s, 60 s, 120 s, 300 s, 600 s and 1800 s of incubation.
Fig. 4. Adsorption of purified hFGF2 ( ) and clarified homogenate containing hFGF2 (o) via batch uptake (A) and Shallow bed adsorption (B) on Capto S. hFGF2 concentration
was 2.0 mg/mL for both model systems. Solid lines represent a fit with the solid diffusion model (Eq. (9)).
as a good estimate. From a mechanistic point of view, a pore or
solid diffusion model assuming only a single mass transfer mechanism is not fully physically representative, as both diffusion mechanisms contribute to the overall mass transfer. Despite that, experimental data can be well approximated with both models and the
derived diffusion coefficients can be considered as apparent diffusion coefficients. Adsorption data shown in Fig. 4 were fitted with
both models yielding basically identical curves. For clarity, only the
solid diffusion model is plotted.
For the case of pore diffusion, an ab initio estimation of the effective pore diffusion coefficient De can be derived from characteristic parameters of the solute and the stationary phase, respectively
[1,32]:
De = ψ p ∗
ε p∗ D0
τ
pore diffusivity is reasonably low which is mainly attributed to
the small pore radius of 5 nm. Effectively, this is a truly theoretical value that only would apply in the case of sole pore diffusion.
Calculated De was then compared to effective pore diffusion coefficients derived from experimentally performed batch uptake and
shallow bed adsorption systems. Again, a maximum binding capacity qmax of 100 mghFGF2 /mLCaptoS was obtained for the pure protein
solution. After fitting the experimental data to the corresponding
model, an effective pore diffusivity of D˙ e of 1.4 ± 0.2 × 10⁻⁶ cm²/s
was determined, which was 34-fold higher compared to the De
calculated from Eq. (17). In accordance with the CLSM profiles, a
strong contribution of solid diffusion to mass transfer is supposed.
We followed the approach of Hunter et al. [29], interpreting the effective De determined with the pore diffusion model as an overall
mass transfer flux, which can be written as
(17)
D˙ e = De + Ds
In Eq. (17) ψ p is the hindrance parameters for pore diffusion,
εp the intraparticle porosity, D0 the free diffusivity of the protein
and τ is the tortuosity factor for intraparticle diffusion.
The hindrance parameter ψ p is proportional to the ratio of the
pore and protein radius and can be calculated by [1,36]:
qmax
C
(19)
Eq. (19) considers the coherence of two individual mass transfer
mechanisms where the first term represents pore diffusion and the
second term solid diffusion. As can be seen from Eq. (19), the effect
of solid diffusion depends on the magnitude of the solid diffusion
coefficient Ds and the driving force expressed as the ratio of qmax
over the initial protein concentration C [2].
To further investigate the individual solid diffusion contribution, the experimental data were fitted to a solid diffusion control
model (Eq. (9)). A solid diffusion coefficient Ds of 1.7 ± 0.1 × 10⁻⁸
cm²/s was determined for pure hFGF2 via batch uptake and shallow bed adsorption. Inserting all parameters (De , Ds , qmax and C)
into Eq. (19) yields D˙ e,calc of 1.4 × 10⁻⁶ cm²/s. This value is identical to the overall effective pore diffusivity D˙ e,exp obtained from the
experimental data and the fitting to the pore diffusion model.
ψ p = 0.865 ∗ (1 − λm )2 ∗ 1 − 2.1044 ∗ λm + 2.089 ∗ λ3m ∗ 0.984 ∗ λ5m
(18)
where λm is the ratio of pore over protein radius.
The free diffusivity D0 of hFGF2 can be estimated by the TynGusek equation [37] if the dynamic viscosity and temperature of
the solution are known. An intraparticle porosity of 0.74 and a tortuosity of 1.5 have previously been determined for Capto S [38].
Calculated parameters are listed in Table 1. Using Eq. (17) De was
estimated as 3.9 × 10⁻⁸ cm²/s for pure hFGF2. The calculated
6
M.C. Berg, J. Beck, A. Karner et al.
Journal of Chromatography A 1676 (2022) 463264
Table 1
Summary of the adsorption kinetics data obtained for purified hFGF2 and hFGF2 in the clarified homogenate via shallow bed adsorption and batch uptake
experiments. λm is the ratio of protein and pore radii. ψ p is the hindrance parameters for pore diffusion and τ is the tortuosity. D0 is the solution diffusivity.
The overall effective pore diffusivity D˙ e,calc was calculated by Eq. (19). The reported values for D˙ e,exp and Ds are arithmetic means and standard deviations
determined from batch uptake and shallow bed experiments.
Sample
Purified hFGF2
hFGF2 in cl. homog.
λm
0.418
ψp
0.076
τ
1.5
D˙ e, calc (cm²/s)
D0 (cm²/s)
−6
1.0 × 10
1.8 × 10⁻⁷
−6
1.4 × 10
6.8 × 10⁻⁸
D˙ e,exp (cm²/s)
Ds (cm²/s)
−6
1.4 ± 0.2 × 10
3.3 ± 0.3 × 10⁻⁸
1.7 ± 0.1 × 10⁻⁸
3.2 ± 0.3 × 10⁻⁹
Fig. 5. Breakthrough curves of purified hFGF2 (A) and clarified homogenate containing hFGF2 (B) on a Capto S column (CV = 1 mL) with 3 min residence time. Filled circles
(●) and filled squares ( ) represent experimental data at residence time of 3 min. Dotted lines represent prediction with pore diffusion model Eq. (7)) and dashed lines
represent prediction with solid diffusion model (Eqs. (11)–((14)) using parameters determined by batch uptake kinetics.
As with pure hFGF2, we conducted a quantitative analysis of the
mass transfer for hFGF2 in the clarified homogenate. Due to higher
dynamic viscosities of the solution an even lower hypothetical De
of 7.0 × 10⁻⁹ cm²/s was estimated. Again, the quantitative analysis
was compared to the effective diffusion coefficients derived from
experimental data. In contrast to pure hFGF2, a lower solid diffusion contribution was determined, which was due to the lower
maximum binding capacity and the lower Ds of 3.2 × 10⁻⁹ cm²/s.
Consequently, under these conditions, the overall mass transfer
flux was drastically reduced to D˙ e,exp = 3.3 × 10⁻⁸ cm²/s. This value
corresponded to half of D˙ e,calc which was based on the hypothetical
De calculated from Eq. (17).
A summary of the adsorption kinetics data obtained can be
found in Table 1.
fied homogenate, the experimentally observed early breakthrough
of hFGF2 at a residence time of 1 min was also well captured by
the model (Fig. 6B). To verify if this overprediction was specific for
pure hFGF2 on Capto S, a series of supporting experiments was
carried out. First, lysozyme adsorption on Capto S was studied at
the same experimental conditions. Lysozyme has a molecular mass
of 14.3 kDa and an isoelectric point (11.0) comparable to hFGF2.
Thus, adsorption properties were expected to be similar. In fact,
almost identical behavior in terms of batch uptake rate (Fig. 7A)
and protein breakthrough including overprediction by the model
was observed (Fig. 7B). Mass transfer parameters are included in
Table 2.
To further investigate this phenomenon, adsorption of pure
hFGF2 was studied on two other cation exchangers: Toyopearl Gigacap S has similar properties as Capto S, but with a polymethacrylate backbone and grafted surface extenders functionalized with
sulfopropyl modifiers. The batch uptake curve and fitting of the
experimental data yielded almost the same diffusion coefficients
as obtained for the Capto S resin, confirming the very fast uptake rates on grafted media. Diffusion coefficients are listed in
Table 2 and the uptake curve is provided in the supportive information (Fig. A3). We also investigated a macro-porous resin without grafted polymers, SP Sepharose FF (Fig. 8).. The batch uptake
was substantially reduced, and the diffusion coefficients obtained
from the fit were one order of magnitude lower as compared to
Capto S. Correspondingly, BTCs were less steep compared to those
obtained on the grafted media and exhibited a stronger dependence on velocity. The profiles were well predicted by the pore diffusion model for the most part of the mass transfer zone. A summary of the diffusivity values obtained for all methods and stationary phases used can be found in Table 2. Adsorption of basic
proteins on SP Sepharose FF has been investigated by several researchers. Dziennik et al. [39] have shown that the diffusion coefficients for lysozyme varied considerably with buffer conditions.
For higher ionic strengths, protein uptake was comparably fast as
on grafted media. Martin et al. [40] showed that the uptake rates
were also dependent on the protein characteristics, as shown for
4.4. Breakthrough curves
Predictions for column operation were made based on mass
transfer parameters derived from batch uptake kinetics. The calculated BTCs were then compared to experimental data of pure
hFGF2 Fig. 5A) and hFGF2 in clarified homogenate (Fig. 5B). Analytical solutions for column adsorption are available for both mass
transfer mechanisms (Eqs. (7) and ((11)–(14)). In Fig. 5A, the experimental breakthrough curve for pure hFGF2 is plotted against
predictions using Ds = 1.6 × 10⁻⁸ cm²/s for solid diffusion model
and D˙ e,exp = 1.2 × 10⁻⁶ cm²/s for the pore diffusion model. Film
mass transfer coefficients were calculated from the correlation as
given by [4]. It is evident that both models yielded almost identical breakthrough profiles. However, both models captured only the
first 30% of the experimental BTC and predicted faster mass transfer as occurred experimentally. In contrast, breakthrough of hFGF2
in clarified homogenate was very well predicted by both models
using Ds = 3.2 × 10⁻⁹ cm²/s and D˙ e,exp = 3.3 × 10⁻⁸ cm²/s, respectively (Fig. 5B). Further experimental runs were conducted at
varying residence times (Fig. 6). Predictions based on the mass
transfer parameters as used above yielded essentially the same
results with strong overprediction for pure hFGF2. For the clari7
M.C. Berg, J. Beck, A. Karner et al.
Journal of Chromatography A 1676 (2022) 463264
Fig. 6. (A) Breakthrough curve (BTC) of purified hFGF2 on Capto S column (CV = 0.2 mL) with varying residence time. Filled circles (●) represent residence time of 1 min.
Residence time of 3 min is represented as open circle (o). (B) Breakthrough curve of clarified homogenate containing hFGF2 on Capto S column (CV = 1 mL) with varying
residence time. Filled squares ( ) represent residence time 1 min. Residence time of 10 min represented as open squares ( ). Analytical solution for solid diffusion by Yoshida
et al. Eqs. (11)–((14)) used for data prediction is shown as dashed lines.
Fig. 7. Adsorption of lysozyme on Capto S (A). Solid diffusion model used for fitting data Eq. (9)). Breakthrough curve of lysozyme on Capto S (CV = 0.2 mL) with varying
residence time (B). Filled circles (●) represent residence time of 1 min. Residence time of 3 min is represented as open circle (o). Predictions via analytical solution for solid
diffusion by Yoshida et al. (Eqs. (11)–((14)) are shown as dashed lines.
Table 2
Summary of all mass transfer coefficients obtained for purified hFGF2 and clarified homogenate containing hFGF2 and additional experiments with lysozyme.
Mass transfer coefficient (cm²/s)
purified hFGF2
Method/Sample
Batch uptake on Capto S
Shallow-bed on Capto S
Batch uptake on Gigacap S
Batch uptake on
SP Sepharose FF
Cl. homogenate
lysozyme
D˙ e
Ds
D˙ e
Ds
D˙ e
Ds
1.3E-6
1.6E-6
1.2E-6
1.5E-7
1.6E-8
1.8E-8
1.4E-8
2.6E-9
3.0E-8
3.5E-8
3.0E-9
3.6E-9
2.0E-6
1.2E-8
lysozyme and cytochrome c. The latter had a diffusion coefficient
that was almost one order of magnitude higher than lysozyme although the molecular weight and the isoelectric point are very
similar. Apparently, the amino acid composition and the binding
strength can have an important impact on the adsorption properties. Taking all these factors and variations into account, the uptake
rates determined for hFGF2 on SP Sepharose FF in this work seem
very reliable.
Furthermore, we investigated if extra-column contributions
could be responsible for deviations of the experimental BTCs and
the model predictions shown in Figs. 5, 6A and 7B. We performed
BTCs under non-binding conditions and bypassing the column. As
shown in Fig. A1 in supportive information, extra-column effects
could not be responsible for the discrepancy as the upper part of
the BTCs reached the plateau rapidly without any tailing or washout effects. Bowes and Lenhoff [41] investigated protein adsorption
on grafted media including Capto S. Under weak binding conditions, and more pronounced for smaller proteins, they observed a
slow approach to equilibrium reflected by a tailing behavior in the
upper part of the BTC. They concluded that a rearrangement of the
initially bound proteins on the dextran layer could be responsible
for the observed effects. All of these studies are indicative of such
a behavior of pure hFGF2 and lysozyme on grafted media which
made the prediction of BTCs challenging. Tao et al. [8] predicted
BTCs of a mAb on Capto S by a solid diffusion model. However,
since mAb has a molecular mass of 150 kDa, solid diffusion coefficients were 3-fold lower than those we determined for the smaller
proteins hFGF2 and lysozyme. In contrast, when the uptake rates
8
M.C. Berg, J. Beck, A. Karner et al.
Journal of Chromatography A 1676 (2022) 463264
Fig. 8. (A) Batch uptake kinetics of purified hFGF2 on SP Sepharose FF. Pore diffusion model for rectangular isotherms used for fitting data (Eq. (3)). Breakthrough curve
experiments with hFGF2 on SP Sepharose FF (CV = 0.2 mL) (B). Filled circles (●) represent residence time of 1 min. Residence time of 3 min is represented as open circles
(o). Predictions via analytical solution for pore diffusion (Eq. (7)) are shown as dashed lines.
Fig. 9. Solid diffusion coefficients of purified hFGF2 in solutions adapted to different dynamic viscosities by adding glycerol (A). Solid diffusion coefficients of purified hFGF2
adapted to different dynamic viscosities against maximum binding capacities (B). Addition of 23 mg/mL BSA represented as (x). Dashed line represents Ds determined for
purified hFGF2 without additives and dotted line represents Ds of hFGF2 in clarified homogenate. Analytical solution for solid diffusion (Eq. (9)) was used for fitting the
experimental data. (C) Dynamic viscosities of different glycerol concentrations ( ), correlation of dynamic viscosity and clarified homogenates with varying cell dry mass
concentrations (●) as well as dynamic viscosity of purified hFGF2 represented as dotted line.
were lower, as was the case for hFGF2 in the clarified homogenate,
model predictions were accurate (Fig. 5B). It can be assumed that
the rearrangement effect, if occurring at all, had little impact on
the shape of the BTC.
Finally, we addressed the question of the cause for the reduced
mass transfer rate in the clarified homogenate. We identified that
the lower driving force, which is a major factor for solid diffusionbased mass transfer, was due to the low capacity. The question remains: why is the capacity so much lower compared to pure hFGF2
since Capto S was very selective for hFGF2 and the eluate fraction was highly pure? This outcome indicates very little competition from host cell proteins for binding, although the homogenate
contained around 25 mg/mL of proteins. To further prove the assumption that host cell proteins do not interfere with the mass
transfer rates, we spiked 23 mg BSA/mL to the pure hFGF2 solution and performed batch uptake experiments on Capto S. The
uptake data were then fitted with the solid diffusion model. As
can be seen in Fig. 9, Ds values and qmax were identical to pure
hFGF2 without BSA spiked. This suggests that other impurities are
responsible for the reduced mass transfer. E. coli homogenates contain numerous low molecular weight compounds in high concentrations which potentially were competing with hFGF2 adsorption.
On one hand the identification and further quantification of these
compounds is very difficult. On the other hand, even if the nature
and concentration of these compounds were known, the resulting
multi-component adsorption system would be extremely complex.
Furthermore, we investigated if the reduced Ds was caused by a
general decrease of diffusivity due to viscosity effects. Therefore,
specific amounts of glycerol were added to pure hFGF2 solutions
to emulate the dynamic viscosity of hFGF2 in clarified homogenate.
Batch uptake kinetics were recorded and qmax and Ds were determined. Fig. 9 shows the decrease of the solid diffusivity with increasing glycerol concentration. A glycerol addition of 44%, which
corresponded to the viscosity of clarified homogenate, yielded the
same Ds value as obtained for hFGF2 in the clarified homogenate.
Also, in this case, qmax was not affected. Overall, the glycerol spiking experiments supported the explanation that the reduction of
D0 is affected by higher viscosity. In combination with the reduced
driving force caused by lower qmax , the overall lower diffusivity of
hFGF2 in the homogenate was plausible. Moreover, process design
for a preparative capture step can easily be performed with either
model using the respective diffusion coefficients.
5. Conclusion
In general, mass transfer on the grafted chromatography
medium Capto S is very fast due to enhanced solid diffusion transport. We have shown that mass transfer of a protein from a clarified homogenate is significantly reduced when compared to a feed
solution of pure protein. The reduction of the transport rate from
the clarified homogenate was caused by two factors: (1) higher
viscosity intrinsically results in lower diffusion coefficients and (2)
the solid diffusion driving force is much reduced at lower maximum binding capacities, which was shown to be the case for
hFGF2 in the clarified homogenate. From an engineering point of
view, both diffusion models, the pore diffusion with an apparent
9
M.C. Berg, J. Beck, A. Karner et al.
Journal of Chromatography A 1676 (2022) 463264
pore diffusion coefficient as well the solid diffusion model, were
able to describe the experimental data. The models can easily be
applied for process design calculations and scale-up. It remains unclear which components are responsible for the reduced binding
capacity, as other host cell proteins do not adsorb. This factor will
be investigated in further studies.
[10] P. Pereira Aguilar, T.A. Schneider, V. Wetter, D. Maresch, W.L. Ling, A. Tover,
P. Steppert, A. Jungbauer, Polymer-grafted chromatography media for the purification of enveloped virus-like particles, exemplified with HIV-1 gag VLP,
Vaccine 37 (2019) 7070–7080, doi:10.1016/j.vaccine.2019.07.001.
[11] R. Liu, Q. Shi, Protein retention in dextran-grafted cation exchange chromatography: the influence of pHs, counterions and polymer structure, Chin. J. Chem.
Eng. 28 (2020) 1904–1910, doi:10.1016/j.cjche.2020.01.006.
[12] B.D. Bowes, H. Koku, K.J. Czymmek, A.M. Lenhoff, Protein adsorption and transport in dextran-modified ion-exchange media. I: adsorption, J. Chromatogr. A
1216 (2009) 7774–7784, doi:10.1016/j.chroma.2009.09.014.
[13] L. Yu, Y. Sun, Recent advances in protein chromatography with polymer-grafted
media, J. Chromatogr. A 1638 (2021), doi:10.1016/j.chroma.2020.461865.
[14] B.D. Bowes, A.M. Lenhoff, Protein adsorption and transport in dextran-modified
ion-exchange media. III. Effects of resin charge density and dextran content on
adsorption and intraparticle uptake, J. Chromatogr. A 1218 (2011) 7180–7188,
doi:10.1016/j.chroma.2011.08.039.
[15] L.L. Yu, S.P. Tao, X.Y. Dong, Y. Sun, Protein adsorption to poly(ethylenimine)modified Sepharose FF: I. A critical ionic capacity for drastically enhanced capacity and uptake kinetics, J. Chromatogr. A 1305 (2013) 76–84, doi:10.1016/j.
chroma.2013.07.014.
[16] S.H.S. Koshari, N.J. Wagner, A.M. Lenhoff, Effects of resin architecture and protein size on nanoscale protein distribution in ion-exchange media, Langmuir
34 (2018) 673–684, doi:10.1021/acs.langmuir.7b03289.
[17] R. Hahn, P. Bauerhansl, K. Shimahara, C. Wizniewski, A. Tscheliessnig, A. Jungbauer, Comparison of protein a affinity sorbents: II. Mass transfer properties, J.
Chromatogr. A 1093 (2005) 98–110, doi:10.1016/j.chroma.2005.07.050.
[18] J.T. McCue, G. Kemp, D. Low, I. Quiđones-García, Evaluation of protein-a
chromatography media, J. Chromatogr. A 989 (2003) 139–153, doi:10.1016/
S0 021-9673(03)0 0 0 05-0.
[19] L.K. Kimerer, B. Niu, T.M. Pabst, W. Zhai, A.K. Hunter, G. Carta, Chromatographic and adsorptive behavior of a bivalent bispecific antibody and associated fragments, J. Chromatogr. A 1648 (2021) 462181, doi:10.1016/j.chroma.
2021.462181.
[20] O. Khanal, V. Kumar, F. Schlegel, A.M. Lenhoff, Estimating and leveraging protein diffusion on ion-exchange resin surfaces, Proc. Natl. Acad. Sci. USA 117
(2020) 7004–7010, doi:10.1073/pnas.1921499117.
[21] J. Liang, G. Fieg, Q.H. Shi, Y. Sun, Single and binary adsorption of proteins on
ion-exchange adsorbent: the effectiveness of isothermal models, J. Sep. Sci. 35
(2012) 2162–2173, doi:10.10 02/jssc.20120 0101.
[22] M. Kołodziej, D.G. Sauer, J. Beck, W.K. Marek, R. Hahn, A. Jungbauer, A. Dürauer,
W. Piatkowski,
˛
D. Antos, Scale up of a chromatographic capture step for a clarified bacterial homogenate – influence of mass transport limitation and competitive adsorption of impurities, J. Chromatogr. A 1618 (2020), doi:10.1016/j.
chroma.2020.460856.
[23] W.K. Marek, D. Sauer, A. Dürauer, A. Jungbauer, W. Piatkowski,
˛
D. Antos, Prediction tool for loading, isocratic elution, gradient elution and scaling up of
ion exchange chromatography of proteins, J. Chromatogr. A 1566 (2018) 89–
101, doi:10.1016/j.chroma.2018.06.057.
[24] A.J. Link, K. Robison, G.M. Church, Comparing the predicted and observed
properties of proteins encoded in the genome of Escherichia coli K-12, Electrophoresis 18 (1997) 1259–1313, doi:10.1002/elps.1150180807.
[25] D.G. Sauer, M. Mosor, A.C. Frank, F. Weiß, A. Christler, N. Walch, A. Jungbauer,
A. Dürauer, A two-step process for capture and purification of human basic fibroblast growth factor from E. coli homogenate: yield versus endotoxin clearance, Protein Expr. Purif. 153 (2019) 70–82, doi:10.1016/j.pep.2018.08.009.
[26] C.G. Decker, Y. Wang, S.J. Paluck, Fibroblast growth factor 2 dimer with superagonist in vitro acitivity improves granulation tissue formation during wound
healing, Biomaterials 81 (2016) 157–168, doi:10.1016/j.biomaterials.2015.12.
003.Fibroblast.
[27] B. Balasundaram, D. Nesbeth, J.M. Ward, E. Keshavarz-Moore, D.G. Bracewell,
Step change in the efficiency of centrifugation through cell engineering: coexpression of Staphylococcal nuclease to reduce the viscosity of the bioprocess
feedstock, Biotechnol. Bioeng. 104 (2009) 134–142, doi:10.1002/bit.22369.
[28] C.C. Miller, The Stokes-Einstein law for diffusion in solution, Proceedings of
the Royal Society of London. Series A, Containing Papers of a Mathematical
and Physical Character 106 (740) (1924) 724–749, doi:10.1098/rspa.1924.0100.
[29] A.K. Hunter, G. Carta, Protein adsorption on novel acrylamido-based polymeric
ion exchangers. II. Adsorption rates and column behavior, J. Chromatogr. A 897
(20 0 0) 81–97, doi:10.1016/S0 021-9673(0 0)0 0865-7.
[30] W.K. Teo, D.M. Ruthven, Adsorption of water from aqueous ethanol, Ind. Eng.
Chem. Process Des. 25 (1986) 17–21.
[31] T.W. Weber, R.K. Chakravorti, Pore and solid diffusion models for fixed-bed adsorbers, AIChE J. 20 (1974) 228–238, doi:10.10 02/aic.69020 0204.
[32] R.H. Perry, D.W. Green, J.O. Maloney, Perry’s Chemical Engineers’ Handbook,
7th edition, McGraw Hill, 1997.
[33] H. Yoshida, T. Kataoka, D.M. Ruthven, Analytical solution of the breakthrough
curve for rectangular isotherm systems, Chem. Eng. Sci. 39 (1984) 1489–1497,
doi:10.1016/0 0 09-2509(84)80 0 07-X.
[34] R. Hahn, A. Tscheliessnig, A. Zöchling, A. Jungbauer, Shallow bed adsorption:
theoretical background and applications, Chem. Eng. Technol. 28 (2005) 1241–
1251, doi:10.10 02/ceat.20 050 0221.
[35] J. Beck, E. von Lieres, N. Zaghi, S. Leweke, G. Carta, R. Hahn, Patterns of protein adsorption in ion-exchange particles and columns: evolution of protein
concentration profiles during load, hold, and wash steps predicted for pore
and solid diffusion mechanisms, J. Chromatogr. A 1653 (2021), doi:10.1016/j.
chroma.2021.462412.
Declaration of Competing Interest
The authors declare that they have no known competing financial interests or personal relationships that could have appeared to
influence the work reported in this paper.
CRediT authorship contribution statement
Markus C. Berg: Conceptualization, Methodology, Formal analysis, Investigation, Data curation, Writing – original draft, Visualization. Jürgen Beck: Investigation, Data curation. Alex Karner:
Methodology, Formal analysis, Investigation. Kerstin Holzer:
Methodology, Formal analysis, Investigation. Astrid Dürauer: Conceptualization, Investigation, Methodology, Writing – review &
editing, Writing – original draft. Rainer Hahn: Conceptualization,
Investigation, Methodology, Writing – original draft.
Acknowledgment
The COMET center: acib: Next Generation Bioproduction is
funded by BMK, BMDW, SFG, Standortagentur Tirol, Government
of Lower Austria und Vienna Business Agency in the framework
of COMET - Competence Centers for Excellent Technologies. The
COMET-Funding Program is managed by the Austrian Research Promotion Agency FFG. We thank the colleagues M. Martinetz, N.
Hammerschmidt, S. Krahulec, M. Graf and C. Brocard of our company partner BI RCV for their scientific input in fruitful continuous
discussions. Furthermore, the authors thank Dr. Monika Debreceny
from the Imaging Center and the Doctoral School “BioProEng” for
their support.
Supplementary materials
Supplementary material associated with this article can be
found, in the online version, at doi:10.1016/j.chroma.2022.463264.
References
[1] G. Carta, A. Jungbauer, Protein chromatography, 2010. 10.1002/9783527630158.
[2] R. Hahn, Methods for characterization of biochromatography media, J. Sep. Sci.
(2012), doi:10.10 02/jssc.20120 0770.
[3] F.T. Sarfert, M.R. Etzel, Mass transfer limitations in protein separations using ion-exchange membranes, J. Chromatogr. A 764 (1997) 3–20, doi:10.1016/
S0 021-9673(96)0 0894-1.
[4] P.M. Armenante, D.J. Kirwan, Mass transfer to microparticles in agitated
systems, Chem. Eng. Sci. 44 (1989) 2781–2796, doi:10.1016/0 0 09-2509(89)
85088-2.
[5] J. Gutenwik, B. Nilsson, A. Axelsson, Effect of hindered diffusion on the adsorption of proteins in agarose gel using a pore model, J. Chromatogr. A 1048
(2004) 161–172, doi:10.1016/j.chroma.2004.07.052.
[6] W.M. Saltzman, R. Langer, Transport rates of proteins in porous materials with known microgeometry, Biophys. J. 55 (1989) 163–171, doi:10.1016/
S0 0 06- 3495(89)82788- 2.
[7] A. Matlschweiger, P. Fuks, G. Carta, R. Hahn, Hindered diffusion of proteins in
mixture adsorption on porous anion exchangers and impact on flow-through
purification of large proteins, J. Chromatogr. A 1585 (2019) 121–130, doi:10.
1016/j.chroma.2018.11.060.
[8] Y. Tao, G. Carta, G. Ferreira, D. Robbins, Adsorption of deamidated antibody
variants on macroporous and dextran-grafted cation exchangers: II. Adsorption
kinetics, J. Chromatogr. A 1218 (2011) 1530–1537, doi:10.1016/j.chroma.2011.01.
050.
[9] A.M. Lenhoff, Protein adsorption and transport in polymer-functionalized ionexchangers, J. Chromatogr. A 1218 (2011) 8748–8759, doi:10.1016/j.chroma.
2011.06.061.
10
M.C. Berg, J. Beck, A. Karner et al.
Journal of Chromatography A 1676 (2022) 463264
[36] H. Brenner, L.J. Gaydos, The constrained brownian movement of spherical particles in cylindrical pores of comparable radius. Models of the diffusive and
convective transport of solute molecules in membranes and porous media, J.
Colloid Interface Sci. 58 (1977) 312–356, doi:10.1016/0021-9797(77)90147-3.
[37] M.T. Tyn, T.W. Gusek, Prediction of diffusion coefficients of proteins, Biotechnol. Bioeng. 35 (1990) 327–338, doi:10.1002/bit.260350402.
[38] Y. Tao, E.X.P. Almodovar, G. Carta, G. Ferreira, D. Robbins, Adsorption kinetics
of deamidated antibody variants on macroporous and dextran-grafted cation
exchangers. III. Microscopic studies, J. Chromatogr. A 1218 (2011) 8027–8035,
doi:10.1016/j.chroma.2011.09.010.
[39] S.R. Dziennik, E.B. Belcher, G.A. Barker, A.M. Lenhoff, Effects of ionic strength
on lysozyme uptake rates in cation exchangers. I: uptake in SP sepharose FF,
Biotechnol. Bioeng. 91 (2005) 139–153, doi:10.1002/bit.20503.
[40] C. Martin, G. Iberer, A. Ubiera, G. Carta, Two-component protein adsorption
kinetics in porous ion exchange media, J. Chromatogr. A 1079 (2005) 105–115,
doi:10.1016/j.chroma.20 05.03.0 07.
[41] B.D. Bowes, A.M. Lenhoff, Protein adsorption and transport in dextran-modified
ion-exchange media. II. Intraparticle uptake and column breakthrough, J. Chromatogr. A 1218 (2011) 4698–4708, doi:10.1016/j.chroma.2011.05.054.
11