Hydroxylation methods for mesoporous silica and their impact on surface functionalisation
Bạn đang xem bản rút gọn của tài liệu. Xem và tải ngay bản đầy đủ của tài liệu tại đây (4.03 MB, 9 trang )
Microporous and Mesoporous Materials 317 (2021) 110989
Contents lists available at ScienceDirect
Microporous and Mesoporous Materials
journal homepage: />
Hydroxylation methods for mesoporous silica and their impact on
surface functionalisation
Tom F. O’Mahony a, b, Michael A. Morris a, b, *
a
b
School of Chemistry, Trinity College Dublin, Dublin, Ireland
AMBER Centre, Trinity College Dublin, Dublin, Ireland
A R T I C L E I N F O
A B S T R A C T
Keywords:
Mesoporous silica
SBA-15
OMS
Silica
Silanol
Silane
SEM
TEM
BET
NMR
APTES
APTS
Hydroxylation
Cleaning
Functionalisation
Grafting
Derivatisation
Pre-treatment
Silica supports used e.g. in chromatography, separation and bioassay lack complete efficacy unless they are
surface functionalised. Thus, chemistries are grafted to the surface to enhance their properties and capacity in
specific applications. Here, various strategies are examined for ‘cleaning’ and hydroxylation of SBA-15 meso
porous silica (as a high surface area exemplar) to sponsor efficient functionalisation through maximising surface
hydroxyl groups as the surface binding sites. Cleaning process effects on the mesoporous silica were studied using
transmission electron microscopy (TEM) and scanning electron microscopy (SEM). The physical properties were
characterised using N2 sorption and x-ray diffraction (XRD). The bulk and surface compositions were charac
terised by Fourier-transform infrared (FTIR) spectroscopy and 29Si nuclear magnetic resonance (NMR) spec
troscopy. Contact angle measurements were also taken, and the surface energy components calculated. Cleaning
of mesoporous SBA-15 was carried out using acids (piranha acid solution & nitric acid), ultraviolet/ozonolysis
and water. The surface area decreased after cleaning and the surface was found to be more active after cleaning
by determination of new available silanol groups and by making the surface more hydrophilic. NMR showed that
silica was cleaned as opposed to rehydroxylated as new silanol functional groups were not determined. Finally,
the mesoporous silica was functionalised with 3-(aminopropyl) triethoxysilane (APTS). Elemental analysis along
with NMR (13C and 1H) were used to determine the impact of cleaning. Cleaning influenced grafting by
increasing the potential loading of the silane examined. This study provides a facile approach to prepare orga
nosilicas for potential higher loading capacities.
1. Introduction
Ordered mesoporous silica (OMS) substrates and particulates are a
primary focus of research due to a wide variety of application areas
including adsorbents [1,2], drug delivery [3], catalysis [4,5], thera
peutics and imaging [6], sensors [7], gas capture [8,9] and storage [10,
11]. Interest derives from advantages such as variations of pore
morphology [12,13], high mechanical stability [14–16], adjustable pore
sizes [17–19] and high surface areas. Silica supports have particular
relevance due to ease of functionalisation by silane reagents. Due to
their high surface area, OMS materials offer opportunities for study and
developing greater understanding of mechanism as their high surface
area allows for easier detection of surface species.
In silica functionalisation, grafting of various alkyl or other func
tional groups takes place at surface hydroxyl sites [20,21] be this for any
application. Functionalisation is dependent on the presence of surface
silanol sites [Si–O–H] [22] with sites such as siloxane bridges [Si–O–Si]
largely inactive. Grafting of organosilanes (most notably 3-(amino
propyl) triethoxysilane or APTS) [15,23] is the most widely studied
method of functionalisation and acts as a precursor to a significant
number of intermediate or terminal functional groups (-NH2, –SH,
–COOH) [24,25]. APTS functionalisation is carried out across many
different application areas. Similar methodologies are used for chro
matography, enzyme immobilisation and small molecule separations
[26–28]. For gas sensing and storage, primary amine groups of e.g. APTS
provide sites for storage of gases including carbon dioxide [8,29]. As the
grafting of APTS is widely understood, it is determined that the basis for
proving the impact of cleaning methods has on grafting of any silane can
be shown by derivatisation with APTS. The use of more complex and
more niche silanes could be examined in future, but a general proof of
concept was chosen to prove efficacy of the discussed cleaning methods.
Key to effective functionalisation is a strong covalent bond between
* Corresponding author. School of Chemistry, Trinity College Dublin, Dublin, Ireland.
E-mail address: (M.A. Morris).
/>Received 10 December 2020; Received in revised form 27 January 2021; Accepted 16 February 2021
Available online 24 February 2021
1387-1811/© 2021 The Authors. Published by Elsevier Inc. This is an open access article under the CC BY license ( />
T.F. O’Mahony and M.A. Morris
Microporous and Mesoporous Materials 317 (2021) 110989
the support and the organosilane to increase efficiency and lifetime of
the material. Optimal conditions for functionalisation are vital for
reaching the maximum silane capacity and performance. Cleaning
methods are thought to play a crucial role in surface grafting, by
removal of contaminants and hydroxylation of the surface for silane
attachment [30]. Such methods parallel the cleaning of silicon wafers in
the semiconductor industry [31–34]. These cleaning methods include
washing and refluxing in piranha solution (sulphuric acid and hydrogen
peroxide combine with the formation of peroxymonosulfuric acid) and
other solutions, along with ultraviolet light and ozonolysis [35–37].
Other methods from the semiconductor industry are hydrofluoric acid
wash and plasma cleaning but these result in surface damage or add
preparation complexity to physical particles. In industry, grafting
methods can be lengthy, complex, and intricate and therefore unreliable
at scale. With this in mind, it is postulated that process efficiency could
be increased using effective pre-treatment methods.
Although silica pre-treatment has been examined previously, this indepth research, was focused to determine the impact of various silica
pre-treatment steps to define the relationship between cleaning, rehy
droxylation and changes in silane attachment. To achieve this, OMS was
synthesised and characterised. The silica was then cleaned by several
methods and studied. This cleaned material was then functionalised
with APTS, characterised, and compared to silica material which was
not cleaned prior to functionalisation. APTS was chosen as grafting
ligand as it is widely used in many different and varying applications.
APTS also can show the possibility of other more complex silanes in this
light.
oven at 110 ◦ C for 60 min for further study/use.
2.1.4. Functionalisation of mesoporous silica with silane
The cleaned materials were functionalised with APTS using the
following method. 1 g of dried silica (cleaned/not) was placed in a flask
containing 9.0% (v/v) solution of APTS in dimethyl sulfoxide (1.0 mL of
APTS in 10 mL DMSO) [40]. The reaction was carried out at 90 ◦ C for 60
min. The functionalised silica was then filtered, washed with DMSO,
propan-2-ol and DI water. The amine grafted SBA-15 was then dried in
the oven at 80 ◦ C until used.
2.2. Characterisation techniques
2.2.1. Electron microscopy
Scanning electron microscopy (SEM) was carried out using a Karl
Zeiss Ultra Plus field emission SEM (in-lens detection) with Gemini
column to provide detailed external surface morphology. The samples
were placed on carbon tape and then to a stainless-steel stub before
being placed in the instrument’s chamber. It was operated at 5 KeV.
Transmission electron microscopy (TEM) provided detailed images of
the internal structure of the synthesised mesoporous silica. The samples
were sonicated in HPLC grade water and dropped on support films of
lacey carbon with 200 mesh copper grids. The TEM used was a JOEL
2100 operating at 200 kV. All images were acquired in bright field
mode.
2.2.2. Contact angle measurements & surface energy calculations
Samples were pressed into disks to a pressure of 2 tonnes and
advancing contact angle (CA) measurements were recorded on a
custom-built system of each sample using 60 Hz sampling rate high
speed camera to examine the changes after the various stages outlined in
the introduction. Water (polar) and diiodomethane (non-polar) were
used to measure the contact angle of the droplets. A droplet size of 150
nL was used at a rate of 15 nLs− 1 using a 35-gauge needle for all disks
and both solvents. ImageJ software (dropsnake as a plugin) was used to
process the images and measure the advancing contact angle. Surface
energy calculations were determined using Fowkes’ theory.
2. Experimental
2.1. Materials & methods
2.1.1. Materials
Pluronic 123 (poly(ethylene glycol)-block-poly(propylene glycol)block-poly(ethylene glycol), tetraethyl orthosilicate (>99%), hydro
chloric acid (ACS reagent 37%), 3-(aminopropyl) triethoxysilane (99%),
sulphuric acid (ACS reagent 95–98%), nitric acid (ACS reagent 70%),
hydrogen peroxide solution (30%), 2-propanol (CHROMASOLV, for
high performance liquid chromatography [HPLC], 99.9%), dimethyl
sulfoxide (anhydrous 99.9%) were purchased from Sigma Aldrich,
Ireland.
2.2.3. Fourier transform infra-red (FT-IR)
Fourier transform infra-red spectroscopy was performed using a
Bruker Tensor II (mid-range extended with diamond UATR) and was
collected using an attenuated total reflection infrared accessory. Spectra
of the SBA-15 at various stages of the process were recorded in the range
250–4000 cm− 1.
2.1.2. Synthesis of SBA-15
The preparation of silica SBA-15 followed procedure reported by
Zhao et al. [34]. 8.0 g of Pluronic 123 was stirred in 60 mL of deionised
(DI) water at 40 ◦ C until fully dissolved. 116.5 mL of 2 molL-1 HCl was
added followed by dropwise addition of 17.6 mL TEOS (tetraethyl
orthosilicate). The reaction solution was transferred into a sealed bottle
and autoclaved at 90 ◦ C for 48 h without stirring. The white product was
filtered and washed with DI water. The solid was dried and calcined at
550 ◦ C for 6 h (heating rate 5 ◦ C min− 1). The term SBA-15 refers to a
calcined material.
2.2.4. N2 adsorption-desorption isotherms
The surface area, pore diameter, pore volume and pore size distri
butions were calculated using N2 sorption technique on a Micromeritics
Tristar II surface area analyser (Micrometrics, Norcross, GA, USA). The
specific surface area was calculated using the multi-point Brunauer,
Emmett and Teller (BET) method [41] in the relative pressure range
P/P0 = 0.05–0.3. The specific pore volume, pore diameter and pore size
distribution
curves
were
calculated
based
on
the
Barrett-Joyner-Halenda (BJH) method [42]. The sorption analysis car
ried out was measured at 77 K. Each sample was degassed under ni
trogen for 5 h at 200 ◦ C prior to analysis.
2.1.3. Cleaning of mesoporous silicas
1 g of SBA-15 was measured into a flask and 10 mL of nitric acid was
added. The solution was refluxed at 100 ◦ C for 60 min. The mixture was
filtered and rinsed with DI water. In a similar manner, SBA-15 was
treated with piranha solution (3:1 ratio of H2SO4 to H2O2 [38]). The
mesoporous silica was refluxed for 60 min at 100 ◦ C. Acid mixtures were
diluted to 150 mL with DI water and then filtered and rinsed with DI
water. Ultraviolet ozonolysis (UV/O3) was examined as it is widely used
to remove any organics on silicon wafer substrates [25] and silicon slabs
[39]. SBA-15 was placed on a glass plate and evenly spread as a thin
layer to ensure the same level of cleaning throughout the sample. As
controls, samples underwent no cleaning method and also after reflux in
de-ionized (DI) as acid treated samples. All samples were dried in an
2.2.5. Elemental analysis
Elemental analysis (Elementar vario EL cube elemental analyser) was
used to determine the percentage carbon and nitrogen in the sample. All
analyses were in triplicate.
2.2.6. Nuclear magnetic resonance (NMR)
Standard liquid phase NMR was carried out along with solid state,
magic angle spinning, MASNMR. The method followed for liquid phase
NMR was described by Thom´
e et al. [43]. An NMR stock solution was
2
T.F. O’Mahony and M.A. Morris
Microporous and Mesoporous Materials 317 (2021) 110989
produced by adding acetic anhydride (190 μL, 2.0 mmol) into a 10 mL
volumetric flask and was filled with D2O. Both phases were combined
before filling up to the mark. For the NMR measurements, the mass of
the mesoporous material (bare, cleaned or functionalised) was weighed
(100 mg) into a microtube with cap. The NMR stock solution was added
(100 μL) followed by 400 μL of 40% wt% NaOD/D2O. The microtube
was shaken for 30 min and allowed to stand for another 30 min to ensure
full dissolution of the mesoporous silica materials. The solution was
transferred to an NMR tube.
MASNMR data were recorded on a Bruker AVANCE II HD, using a
3.2 mm HX cross-polarisation (CP) magic angle spinning (MAS) probe.
The proton spectra used a one pulse sequence with a temperature of
20 ◦ C and a spin rate of 10 kHz. The silicon spectra used a standard cross
polarisation sequence with a magnitude of 60 kHz for the Si radio fre
quency field, 50 kHz for the proton decoupling field with a contact time
of 1 ms and a spin rate of 5 kHz with a temperature of 20 ◦ C. The carbon
spectra had a standard cross polarisation pulse sequence in a 60 kHz C
field. The proton decoupling field was 50 kHz with a contact time of 3 ms
and a spin rate of 10 kHz. The sample temperature was set at 20 ◦ C.
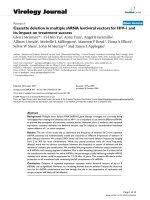
3.1.3. Electron microscopy
SEM images of different magnifications are seen in Fig. 1. The mor
phologies of the particles are of no defined shape but rather a range of
different sizes and shapes as seen in Fig. 1 (ii) where morphologies of
rods, spheres and pyramids can be seen. The particle size demonstrated
from the SEM images also show that all particles are smaller than 100
μm (length of the largest dimension). TEM images (Fig. 1(iv-v), show
highly ordered parallel pore channels. The images also show the ordered
hexagonal pore structure as the pores emerge from the surface. Using
imaging software, the average pore diameter measured was 5.0 nm and
pore walls were measured at 4.8 nm in close agreement with the results
obtained with N2 sorption measurements.
3.1.4. MASNMR
The Si29 MASNMR spectrum showed three peaks present as seen in
Fig. S3. The peak positions seen are − 91.4, − 100.5 and − 109.2 ppm
which can be assigned to the Q2, Q3 and Q4 peaks respectively [46]. The
peaks represent the number of oxygen bonds to that silicon atom. This is
demonstrated in Fig. S3. The integrals of the peaks show the relative
concentrations for the three different silicon environments.
2.2.7. X-ray diffraction (XRD)
X-ray diffraction (XRD) patterns have been recorded with a Bruker
D8 Advance diffractometer equipped with an un-monochromated Cu-Kα
source with a 1D detector which includes an energy discriminator which
filters out Cu-Kβ. Samples were ran in the low angle range from 0.5◦ to 5◦
(0.5◦ ≤ θ ≥ 5.0◦ ).
3.1.5. XRD
Powder X-ray diffraction was completed on SBA-15. It is shown in
Fig. S4 and shows the low angled spectrum of the sample with the
standard (1 0 0), (1 1 0) and (2 0 0) reflections typical of a hexagonal
mesoscopic structure [47,48].
3. Results and discussion
3.2. Analysis of cleaned SBA
3.1. Characterisation of SBA-15
As previously discussed, four cleaning methods are examined in this
study allowing comparison to as-calcined material.
3.1.1. N2 sorption (surface area & pore properties)
The N2 adsorption and desorption isotherm (see Fig. S1) of the
synthesised and calcined SBA-15 (SBA-cal) is type IV with a typical
hysteresis loop and a defined step seen at P/P0 of 0.4–0.6 that demon
strating the material contains mesopores. The surface area of the pro
duced material was measured at 612 m2g-1. The pore volume and pore
diameter were determined from the desorption plot which measured
0.56 cm3 g− 1 and 48 Å. These results are seen in Table 1.
3.2.1. N2 sorption (surface area & pore properties)
N2 sorption results are reported in Table 1. Fig. 2 displays the direct
impact of cleaning from the different methods by showing a reduction in
surface areas. It was observed that the surface area decreased after
cleaning with the different methods. This is a negative effect on the
materials as one of the key attributes of OMS materials are high surface
area. It is worth noting that extended cleaning times of 1–24 h, cause
further decreases in surface area and higher pore diameter for all
methods are seen.
The surface area decreases are assigned to pore volume and pore
diameter increase suggestive of some pore etching and a possible sec
ondary reaction step of condensation cross-linking of surface silanol
groups [49–51]. For all four cleaning methods there is an increase in
pore size of 2–4 Å compared to virgin SBA-15. The surface area
decreased noticeably less for ultraviolet/ozonolysis cleaning consistent
with a non-chemical, non-acidic method. Cleaning in water and piranha
solution causes the most significant decrease in surface area. This could
be due to two different reasons. With piranha and nitric acid solutions, it
3.1.2. FTIR
Typical spectra for calcined OMS SBA-15 material was observed in
Fig. S2. The SiO2 framework symmetric and anti-symmetrical vibrations
were seen at 803 and 1063 cm− 1. The torsion vibrations of the Si–O–Si
framework is also seen at 446 cm− 1 [44]. Silanol peaks (Si–OH) are also
observed and derive from the vibrational bending mode at 962 cm− 1
[45]. Adsorbed water is also seen in the data with a sharp peak at 1637
cm− 1 along with a broad peak seen at approximately 3400 cm− 1. Finally,
there is also a minor feature at 3740 cm− 1 due to the presence of silanol
groups [44].
Table 1
Physical properties of SBA-15, samples cleaned by the four methods and their corresponding properties after grafting with 3-aminopropyl triethoxysilane.
Sample
Cleaning Time
BET Surface Area
Pore Diameter (PDdes)
Pore Volume (PVdes)
BET Surface Area
Pore Diameter (PDdes)
Pore Volume (PVdes)
h
m2g-1
Å
cm3g-1
m2g-1
Å
cm3g-1
51
47
54
47
46
44
54
44
54
0.23
0.28
0.21
0.21
0.15
0.29
0.3
0.22
0.24
Cleaned
SBA-15
Nitric
Piranha
UV/Ozone
Water
1
24
1
24
1
24
1
24
Functionalised
612
585
542
564
488
608
606
548
487
48
50
51
49
52
48
49
50
51
0.56
0.57
0.56
0.55
0.58
0.56
0.57
0.56
0.57
3
152
193
151
148
108
211
201
162
158
T.F. O’Mahony and M.A. Morris
Microporous and Mesoporous Materials 317 (2021) 110989
Fig. 1. Electron microscopy of synthesised mesoporous silica, SBA-15: Scanning electron microscopy (SEM) images of varying magnification; (i) 100 μm; (ii) 10 μm;
(iii) 1 μm; Transmission electron microscopy (TEM) images showing the pore structures of (iv) lateral direction and (v) hexagonal pore structure. Imaging software
(ImageJ) was used on TEM images to demonstrate and measure (vi) the pore diameter and pore wall thickness of the mesoporous SBA-15.
continual increase of surface energy from 47 to 54 mJm− 2 for the polar
contributions. For the UV/ozone cleaned samples, a plateau in polar
contributions of 49 mJm− 2 after 1 h and 24 h cleaning cycle. In both
cases, little measurable change in dispersive interactions was observed
from both.
is suggested that the strongly oxidising conditions completely removes
any organics and may have an etching effect. With water it is suggested
that this is an absorption effect. Cleaning might cause physisorption of
water and blocking of smaller pores. These pores may not be cleared by
degassing. Smaller pore sizes may result from multilayers of water
condensing on cleaned pore walls.
3.2.3. NMR
1
H NMR data are presented in Table S2. The integral of the standard
acetate protons was used to normalise the change in HOD amount. In the
process of silica dissolution in NaOD/D2O, siloxane (Si–O–Si) bridges are
cleaved by the NaOD and produces a deuterated silanol (Si-OD). Silanols
(isolated or geminal) also interact with the NaOD/D2O by deprotonation
and add to the total HOD content which would also include any
deuterated amine. The HOD integral is based on the acetate concen
tration is shown in Fig. 4. The figure displays the HOD concentration
increases after cleaning with water (2.87 & 3.14 a.u.), piranha solution
(2.65 & 2.91 a.u.) and nitric acid (2.67 & 2.92 a.u.). There is a decrease
in HOD after UV/O3 (2.62 & 2.57 a.u.) and this could be due to damage
to the surface silanols and the material by the ozone radicals produced
during cleaning. The increase in HOD seen is due to an increase in free
silanols after cleaning. Another suggestive reason for the increase in
HOD could be due to adsorbed water. Piranha and nitric acid are wet
methods and any water present would lead to an increase in
3.2.2. Contact angle & surface energy measurements
Contact angles of the cleaned samples are reported in Table 2
together with the calculated surface energy measurements which show
the polar and dispersive interactions. The contact angles measured in
both water and diiodomethane have a degree of variation between
measurements of the same sample. This is because of the non-uniform
and highly porous surface of the pressed disk. The results still show
the influence of cleaning on the mesoporous silica. The surface energy
calculations are displayed in Fig. 3. The figure for nitric acid (a) illus
trates that there is little measurable difference in the polar contributions
or dispersive interactions. This would indicate that there is no significant
change in hydroxyl availability. The same trend is not seen with the
other cleaning methods. The piranha solution (b) and UV/ozone (c)
show a significant increase in the polar contributions after cleaning. This
suggests more surface hydroxyl groups available for interaction
compared to original SBA-15. For the piranha cleaned material there is a
4
T.F. O’Mahony and M.A. Morris
Microporous and Mesoporous Materials 317 (2021) 110989
percentages are normalised and achieved by assuming no change occurs
to the Q4 siloxanes concentration as this is expected to remain un
changed because of chemical inertness. Interesting results are seen in
Table S1 showing the normalised data based on the data in Table 3.
Cleaning with wet methods show a decrease in the isolated and geminal
silanols. This could be explained by the fact that water is involved in all
three methods and that water cannot be fully removed unless calcined
again and under vacuum [49]. The opposite is seen when cleaned with
ultraviolet/ozonolysis. An increase in Q3 and Q2 could indicate that
either the surface is being rehydroxylated or that the UV/O3 is damaging
Fig. 2. Surface area measurements using BET method. It demonstrates the
changes in surface area due to the different cleaning methods taken at 1 h and
24 h. The samples are nitric acid (square/black), piranha solution (circle/red),
UV/ozone (triangle/blue) and water (nabla/green). (For interpretation of the
references to colour in this figure legend, the reader is referred to the Web
version of this article.)
concentration of HOD. This could also be the reason as to why water
shows higher HOD compared with piranha solution and nitric acid.
Following cleaning experiments, several different outcomes are seen
using MASNMR. Details of this are shown in Table 3 which displays the
relative percentages of the peaks present after cleaning. Data is dis
played in this form for sample to sample comparisons. Firstly, it shows
the relative concentrations of the three silicon species for SBA-15 which
displays 17%, 69% and 14% for Q4, Q3 and Q2 peaks, respectively. The
Fig. 4. 1H NMR of HOD integral plotted against the cleaning time of the various
cleaning methods which include nitric acid (black), piranha solution (red),
ultraviolet/ozonolysis (blue) and water (green). (For interpretation of the ref
erences to colour in this figure legend, the reader is referred to the Web version
of this article.)
Table 2
Contact angle measurements and surface energy calculations for SBA-15 and cleaned samples.
Sample
Time (h)
H2O ( )
±
CH2I2 ( )
±
Dispersive
±
Polar
±
32.5
49.1
33.9
35.1
27.8
12
8.5
15.7
15.7
6.2
6.2
4.6
7.7
6.4
1.1
2.3
5.6
3.6
44.6
54.7
36.4
49.5
37
40.5
52.2
47.8
47.4
10.3
8.5
3.2
6.8
12.1
11.8
4.9
6.9
3.7
24
20.9
28.2
21.8
27.2
24.3
18.4
20.9
21.1
5.9
5.6
2.1
4.5
6.2
5.5
2.5
3.8
2.1
38.2
29.5
34.1
38.5
38.2
46.9
53.6
49
48.8
8.6
8.7
4.2
8.7
8.2
5.4
3.3
5.7
3.3
◦
SBA-15
Water
Nitric
Piranha
UV/Ozone
–
1
24
1
24
1
24
1
24
Surface Energy (mJ/m2)
Contact Angle Measurements (θ)
◦
Fig. 3. Surface energy measurements for cleaned SBA-15 samples broken down into their polar and dispersive interactions. These are based on their corresponding
contact angle measurements using the Owens-Wendt approach. The figure shows (i) Nitric acid (ii) Piranha solution (iii) UV/Ozone.
5
T.F. O’Mahony and M.A. Morris
Microporous and Mesoporous Materials 317 (2021) 110989
3.2.5. XRD
XRD was also used to examine the changes in the structure of the
cleaned SBA-15. In Fig. S4 there was no change in the pore structure
after either the 1 h cleaning or the 24 h cleaning of each of the four
cleaning methods. This was interesting as (especially with piranha for
the 24 h cleaned sample) it supports the suggestion that effects are
largely due to pore size expansion rather than morphological changes.
Table 3
29
Si solid-state NMR relative percentages of the various peaks.
Sample Name
SBA-cal
SBA-APTS
Nitric 1h
Nitric 24h
Piranha 1h
Piranha 24h
UVO3 1h
UVO3 24h
Water 1h
Water 24h
% Q Peak
Q4
Q3
Q2
Q4
17
–
Cleaned
18
22
20
20
16
16
18
19
69
14
70
69
68
70
69
72
68
69
12
9
11
10
16
13
14
12
–
48
49
Functionalised
48
47
50
45
56
42
47
49
49
48
49
49
50
48
48
49
Q3
Q2
4
5
5
2
4
3
2
3
3
3.3. Impact of cleaning on functionalisation
3.3.1. N2 sorption (surface area & pore properties)
As shown previously, cleaning reduces the surface area of the SBA-15
material and so too does functionalisation, which can be assigned to the
grafting of APTS in and around the pores. The results are shown in
Table 1. The large reduction in pore volume showed that functionali
sation is occurring for all samples. The largest decrease seen between the
original silica material and the related cleaned SBA-15 is from the 24 h
piranha grafted sample. Here the final material has a pore volume of just
0.15 cm3g-1 and a surface area of 108 m2g-1. All other pore volumes
approximately fall in between a range of 0.21–0.3 cm3g-1 and surface
areas 150–200 m2g-1.
Fig. S5 tracks the quantity of N2 adsorbed through the different
stages of the study from as calcined SBA-15 to piranha cleaned and
grafted SBA-15. The isotherms shift to lower relative pressure as the
SBA-15 material is progressed through the stages. This shows a decrease
in N2 adsorbed firstly due to cleaning using piranha solution and then a
further reduction due to grafting from APTS.
the surface of the silica. The latter would help explain why lower
grafting is seen compared with the other methods. Further, following the
UV/O3 treatment the surface could be passivated by CO2 or hydrocarbon
adsorption as seen for activated carbon and many plastic surfaces [52,
53].
3.2.4. FTIR
FTIR was used to examine all cleaned SBA-15 samples. In Fig. 5 it can
be seen that there are clear changes in the intensity of the silanol peak
(962 cm− 1 [45,54]). The peaks were normalised from the beginning of
the peak and compared. The spectra show that after cleaning there was
an increase in peak intensity. This suggests a potential increase in
number of silanols. For this study, this number was not quantified but
compared to as-calcined SBA-15 material. The data show there are slight
differences in intensities for each cleaning method. For instance, after
cleaning in piranha solution, the highest intensity was seen indicating
the highest number of silanol groups present. Another point to note is
that cleaning for 1 h and cleaning for 24 h showed the same intensity for
each of the four methods. This indicates that cleaning times could be
reduced to 1 h or less.
3.3.2. Elemental analysis
The main purpose for potentially cleaning silicas is to increase effi
ciency and robustness of grafting applications. Table 4 displays the re
sults following grafting with APTS. Unbonded SBA-15 (control sample)
showed a percentage carbon and nitrogen of 0.05 and 0.03%, respec
tively. For all grafted samples, the percentage carbon ranged from 6.7 to
8.7% and percentage nitrogen ranged from 2.0 to 2.8%. To show the
impact of cleaning, functionalisation on bare SBA-15 occurred with
percentage carbon and nitrogen values showing 6.95 and 2.27%
respectively. Percentage carbon shown in Fig. 6, demonstrates an in
crease on the control sample (no clean/black) for both nitric acid and
piranha solution. The UV/ozone and water samples show no increase in
percentage carbon for 1 h cleaned sample. The UV/ozone sample
cleaned for 24 h showed an increase from the control and a slight in
crease on the 1 h sample. The water sample produced a lower percentage
carbon than the control sample and the 1 h water cleaned sample. The
piranha solution, nitric acid and the UV/ozone cleaned samples all
increased their percentage carbon and therefore their grafting potential
with longer cleaning times. The highest grafting achieved was with
piranha solution cleaned SBA-15. It had the most effective grafting for
the 1 h and the 24 h cleaned sample. This 24 h value was seen at 8.68%.
Analysis of the percentage nitrogen results are seen in Fig. 7. Again,
the piranha solution achieved the highest percentage nitrogen (2.81%)
Table 4
Elemental analysis for carbon and nitrogen content for SBA-15 and cleaned
samples after functionalisation with APTS.
Fig. 5. FTIR Spectra of cleaned SBA-15 and calcined SBA-15. The figure shows
a wavenumber (962 cm− 1) associated with the presence of silanols in the ma
terial. The impact is seen by normalising the peak and showing the increase in
its relative intensity to the calcined SBA-15 sample. Included are calcined SBA15 (line/black), piranha solution (dash/red), nitric acid (dash-dot/blue), UV/
ozone (dash-dash-dot/green) and water (dash-dot-dash/magenta). (For inter
pretation of the references to colour in this figure legend, the reader is referred
to the Web version of this article.)
Sample
Time (h)
%C
±
%N
±
Control
SBA-15
Nitric Acid
–
0
1
24
1
24
1
24
1
24
0.05
6.947
7.317
7.775
7.724
8.68
6.928
6.71
6.94
7.417
0.02
0.227
0.046
0.049
0.031
0.495
0.443
0.156
0.128
0.086
0.03
2.271
2.53
2.135
2.446
2.81
2.479
2.01
2.1
2.61
0.02
0.085
0.017
0.048
0.012
0.141
0.153
0.12
0.081
0.105
Piranha Solution
Water
UV/Ozone
6
T.F. O’Mahony and M.A. Morris
Microporous and Mesoporous Materials 317 (2021) 110989
Note that statistical analysis was used to verify these conclusions. A
significant P-value was determined from the percentage carbon results
presented above. The P-value of the piranha sample cleaned for 24 h was
shown to be significantly different. It had a P-value of 0.035 which
showed this to be significantly different to the control sample. The other
samples after 24 h cleaning had P-values of 11.2, 39.2 and 16.0 for nitric
acid, water and UV/ozone cleaning, respectively.
3.3.3. NMR
After functionalisation, the presence of T peaks proves that suc
cessful grafting of APTS has occurred [55]. This can be seen in Fig. S6.
The results in this study show T2 and T3 peaks which indicate the ami
nopropyl group grafted to a central silicon with two adjacent O–Si (seen
at − 58 ppm) with one O–H and the aminopropyl group grafted to the
central silicon with three adjacent O–Si species (seen at − 66 ppm),
respectively [4]. The relative concentrations percentages are shown in
Table 3. The data shows grafting occurs at the isolated and geminal
silanols. If the same assumptions as before are taken some comparisons
can be made between samples. After grafting the relationship between
Q4 siloxane and Q3 isolated silanols changes from typically 1:3.5 to 1:1.
This dramatic difference shows the impact of grafting on the surface
hydroxyl groups. Similarly, after cleaning the ratio between Q4 to Q2 is
just less than 1:1. Cleaning methods such as piranha and nitric acid have
a ratio closer to 2:1 in terms of Q4:Q2. After grafting this ratio changes to
a minimum of 9:1 showing the significant change occurring to the
geminal silanols. The degree of modification is also calculated by
dividing the sum of the integral of the T peaks by the sum of the Q in
tegrals [43]. The value for the degree of modification was consistent
with an average at 37.5%.
NMR was carried out using both 1H and 13C probes. 1H NMR results
show that grafting has occurred as the presence of the alpha, beta and
gamma protons are seen. Labelling of hydrogens can be seen from
Table S2 where the positions of the peaks are described. An example
spectrum can be seen in Fig. S7. The two control samples SBA-15 (SBAcal) and the SBA-15 which was grafted but not cleaned (SBA-APTS) are
included. Examining the samples which are cleaned and then func
tionalised, the data shows that some increase their HOD amount and
some decrease. Interestingly, nitric acid samples increase their HOD
concentration, but piranha samples remain pretty much identical to the
related cleaned samples. Whereas ultraviolet/ozonolysis and water
samples decrease in their HOD concentrations. Higher grafting is
occurring for piranha solution and nitric acid cleaned samples compared
with the others. This agrees with the elemental analysis presented
above. More APTS means more amine groups and as these become
deuterated in excess D2O, this will add to the HOD contributions.
Carbon NMR was also carried out and the results are displayed in
Table S3. A spectrum can be seen in Fig. S8. The integrations are nor
malised to the methyl carbon and it is seen that the alpha and gamma
carbons have a higher number detected when compared to the beta
carbon. The values obtained are quite similar to each other, but it is clear
that the piranha cleaned samples show higher carbon concentrations
along with the water cleaned samples. Also worth noting that full hy
drolysis of the silane is occurring during functionalisation seen from the
fact that there are no carbon peaks detected where one would expect
ethoxy related carbon peaks (17 and 57 ppm) [43]. This shows some
insight into the mechanism of the grafting process.
Fig. 6. Elemental analysis of various SBA-15 samples functionalised with APTS.
The percentage carbon is measured for SBA-15 which was not cleaned (square/
black) and cleaned samples by nitric acid (circle/red), piranha solution (tri
angle/blue), water (diamond/green) and UV/ozone (star/gold). The error range
for each sample is also included. (For interpretation of the references to colour
in this figure legend, the reader is referred to the Web version of this article.)
Fig. 7. Elemental analysis of various SBA-15 samples functionalised with APTS.
The percentage nitrogen is measured for SBA-15 which was not cleaned
(square/black) and cleaned samples by nitric acid (circle/red), piranha solution
(triangle/blue), water (diamond/green) and UV/ozone (star/gold). The error
range for each sample is also included. (For interpretation of the references to
colour in this figure legend, the reader is referred to the Web version of
this article.)
for the 24 h cleaned sample compared with all other samples. The nitric
acid cleaned sample had the highest percentage nitrogen for 1 h dura
tions at 2.53%. Water also showed a high percentage nitrogen for the 1 h
sample (2.48%) which was slightly above the piranha solution cleaned
sample (2.45%). The control no clean sample showed a percentage ni
trogen of 2.27% which was higher than the 1 h UV/ozone sample whose
percentage nitrogen was 2.10%. As already mentioned, the piranha
cleaned sample grafted the largest quantity of APTS. As cleaning time
increased, a decrease was seen from both water (2.01%) and nitric acid
cleaned (2.14%) samples. Both samples fell below the control sample.
Also interesting was the large increase in the UV/ozone sample which
was just below the piranha solution at 2.61%. However, we suggest that
this is largely due to adventitious adsorption as mentioned.
4. Conclusion
The aim of the study was to gain insight into the effects of cleaning of
a silica material such as SBA-15. SBA-15, a mesoporous silica, was
synthesised and characterised. The physical properties were as cited and
as expected.
Cleaning of the silica surface does occur in acid. Piranha solution and
nitric acid do change the surface and increase availability of surface
hydroxyl groups. IR spectroscopy showed that cleaning of the material
7
Microporous and Mesoporous Materials 317 (2021) 110989
T.F. O’Mahony and M.A. Morris
increased the intensity of the silanol peak for all methods described.
Cleaning also demonstrated an increase in polar contribution to the
surface energies in turn making the surfaces more hydrophilic. Cleaning
did have an impact on the physical properties of the material by
decreasing surface areas. Piranha solution was the most effective at
these. Water cleans the silica surface but not to the same extent as
piranha and nitric acid. Ultraviolet/ozonolysis cleans but is less effective
due to a damaged surface and/or due to air passivation blocking silanol
sites. The other three methods do not show this as water is adsorbed to
the surface. These results therefore tell that the mesoporous silica is
cleaned by removing adsorbates and increasing availability of silanols
for functionalisation as opposed to producing more silanol groups. This
was shown by NMR.
After functionalisation of the cleaned samples investigated, the
cleaning methods were shown to significantly enhance the grafting of 3(aminopropyl) triethoxysilane. Elemental analysis showed piranha so
lution to be the most effective at increasing the APTS load. Decreases in
pore volume and diameter indicates that grafting is occurring inside the
pore framework. MASNMR showed that grafting occurs at the isolated
and geminal sites and can dramatically change the surface composition
to a 1:1 ratio of siloxane bridges to isolated silanols. Full hydrolysis of
the APTS also occurred during grafting as no ethoxy carbons were
detected using 13C NMR. The potential for enhancing the grafting ability
of silica materials by introducing a cleaning or pre-treatment step which
impacts positively on potential lifetime and efficiency of the material
has been shown.
[3]
[4]
[5]
[6]
[7]
[8]
[9]
[10]
[11]
CRediT authorship contribution statement
[12]
Tom F. O’Mahony: Conceptualization, Methodology, Validation,
Formal analysis, Investigation, Data curation, Writing – original draft.
Michael A. Morris: Funding acquisition, Writing – review & editing,
Supervision.
[13]
[14]
Declaration of competing interest
[15]
The authors declare that they have no known competing financial
interests or personal relationships that could have appeared to influence
the work reported in this paper.
[16]
Acknowledgements
[17]
This publication has stemmed from research conducted with the
financial support of Science Foundation Ireland under grant number
210036-16248. This code was distributed from AMBER Centre in Trinity
College Dublin. T. O’M gratefully acknowledges the technical assistance
provided from Dr Cian Cummins, Dr Ross Lundy and Brid Murphy for
technical advice and discussions. T. O’M also acknowledges the staff of
the Advanced Microscopy Laboratory (AML), Trinity College Dublin
especially Clive Downing for providing technical assistance. The author
would also like to thank Mr Mark Kavanagh, school of Natural sciences,
Trinity College Dublin for access using elemental analysis. The author
declares no competing financial interests.
[18]
[19]
[20]
[21]
[22]
[23]
Appendix A. Supplementary data
Supplementary data to this article can be found online at https://doi.
org/10.1016/j.micromeso.2021.110989.
[24]
References
[25]
[1] L.E. Blue, J.W. Jorgenson, 1.1μm Superficially porous particles for liquid
chromatography Part 2: column Packing and chromatographic performance,
J. Chromatogr., A 1380 (2015) 71–80, />chroma.2014.12.055.
[2] V.K. Langsi, B.A. Ashu-Arrah, J.D. Glennon, Sub-2-μm seeded growth mesoporous
thin shell particles for high-performance liquid chromatography: synthesis,
[26]
8
functionalisation and characterisation, J. Chromatogr., A 1402 (2015) 17–26,
/>S.K. Natarajan, S. Selvaraj, Mesoporous silica nanoparticles: importance of surface
modifications and its role in drug delivery, RSC Adv. 4 (2014) 14328–14334,
/>A.J. Crisci, M.H. Tucker, M. Lee, S.G. Jang, J.A. Dumesic, S.L. Scott, AcidFunctionalized SBA-15-type silica catalysts for carbohydrate dehydration, ACS
Catal. 1 (2011) 719–728, />T. Yokoi, Y. Kubota, T. Tatsumi, Amino-functionalized mesoporous silica as base
catalyst and adsorbent, Appl. Catal. Gen. 421–422 (2012) 14–37, />10.1016/j.apcata.2012.02.004.
J. Kim, H.S. Kim, N. Lee, T. Kim, H. Kim, T. Yu, I.C. Song, W.K. Moon, T. Hyeon,
Multifunctional uniform nanoparticles composed of a magnetite nanocrystal core
and a mesoporous silica shell for magnetic resonance and fluorescence imaging and
for drug delivery, Angew. Chem. Int. Ed. 47 (2008) 8438–8441, />10.1002/anie.200802469.
M. Punzet, D. Baurecht, F. Varga, H. Karlic, C. Heitzinger, Determination of surface
concentrations of individual molecule-layers used in nanoscale biosensors by in
situ ATR-FTIR spectroscopy, Nanoscale 4 (2012) 2431, />c2nr12038k.
V. Zelenak, D. Halamova, L. Gaberova, E. Bloch, P. Llewellyn, Amine-modified
SBA-12 mesoporous silica for carbon dioxide capture: effect of amine basicity on
sorption properties, Microporous Mesoporous Mater. 116 (2008) 358–364, https://
doi.org/10.1016/j.micromeso.2008.04.023.
M. Pardakhti, T. Jafari, Z. Tobin, B. Dutta, E. Moharreri, N. Saveh Shemshaki, S.
L. Suib, R. Srivastava, Trends in solid adsorbent materials development for CO 2
capture, ACS Appl. Mater. Interfaces 11 (2019) 34533–34559, />10.1021/acsami.9b08487.
Y. Yin, Z.-F. Yang, Z.-H. Wen, A.-H. Yuan, X.-Q. Liu, Z.-Z. Zhang, H. Zhou,
Modification of as synthesized sba-15 with pt nanoparticles: nanoconfinement
effects give a boost for hydrogen storage at room temperature, Sci. Rep. 7 (2017)
4509, />H.K. Chae, D.I. Siberio-Perez, J. Kim, Y. Go, M. Eddaoudi, A.J. Matzger,
M. O’Keeffe, O.M. Yaghi, A route to high surface area, porosity and inclusion of
large molecules in crystals, Nature 427 (2004) 523–527, />nature02294.1.
D. Kumar, K. Schumacher, C. Du Fresne von Hohenesche, M. Grün, K.K. Unger,
MCM-41, MCM-48 and related mesoporous adsorbents: their synthesis and
characterisation, Colloids Surfaces A Physicochem. Eng. Asp. 187–188 (2001)
109–116, />D. Zhao, Q. Huo, J. Feng, B.F. Chmelka, G.D. Stucky, Tri-, tetra-, and octablock
copolymer and nonionic surfactant syntheses of highly ordered, hydrothermally
stable, mesoporous silica structures, J. Am. Chem. Soc. 120 (1998) 6024–6036.
E.M. Borges, M.R. Euerby, An appraisal of the chemical and thermal stability of
silica based reversed-phase liquid chromatographic stationary phases employed
within the pharmaceutical environment, J. Pharmaceut. Biomed. Anal. 77 (2013)
100–115, />P. Zucca, E. Sanjust, Inorganic materials as supports for covalent enzyme
immobilization: methods and mechanisms, Molecules 19 (2014) 14139–14194,
/>J. Wang, H. Ge, W. Bao, Synthesis and characteristics of SBA-15 with thick pore
wall and high hydrothermal stability, Mater. Lett. 145 (2015) 312–315, https://
doi.org/10.1016/j.matlet.2015.01.113.
A. Katiyar, S. Yadav, P.G. Smirniotis, N.G. Pinto, Synthesis of ordered large pore
SBA-15 spherical particles for adsorption of biomolecules, J. Chromatogr., A 1122
(2006) 1320, />J.P. Thielemann, F. Girgsdies, R. Schlă
ogl, C. Hess, Pore structure and surface area
of silica SBA-15: influence of washing and scale-up, Beilstein J. Nanotechnol. 2
(2011) 110–118, />M. Thommes, R. Kă
ohn, M. Fră
oba, Sorption and pore condensation behavior of pure
fluids in mesoporous MCM-48 silica, MCM-41 silica, SBA-15 silica and controlledpore glass at temperatures above and below the bulk triple point, Appl. Surf. Sci.
196 (2002) 239–249, />L. Snyder, J. Kirkland, J.W. Dolan, Introduction to Modern Liquid
Chromatography, 2009.
K.K. Unger, Porous Silica its Properties and Use as Support in Column Liquid
Chromatography, Elsevier, 1979.
H. Bergna, W. Roberts, Colloidal Silica: Fundamentals and Applications, CRC Press
Taylor & Francis Group, 2007 papers2://publication/uuid/5C5D42D6-7FC8-488AAB81-151CFB1FF4A9.
M. Lazghab, K. Saleh, P. Guigon, Functionalisation of porous silica powders in a
fluidised-bed reactor with glycidoxypropyltrimethoxysilane (GPTMS) and
aminopropyltriethoxysilane (APTES), Chem. Eng. Res. Des. 88 (2010) 686–692,
/>D.R. Hristov, L. Rocks, P.M. Kelly, S.S. Thomas, A.S. Pitek, P. Verderio, E. Mahon,
K.A. Dawson, Tuning of nanoparticle biological functionality through controlled
surface chemistry and characterisation at the bioconjugated nanoparticle surface,
Sci. Rep. 5 (2015) 1–8, />N.S.K. Gunda, M. Singh, L. Norman, K. Kaur, S.K. Mitra, Optimization and
characterization of biomolecule immobilization on silicon substrates using (3aminopropyl)triethoxysilane (APTES) and glutaraldehyde linker, Appl. Surf. Sci.
305 (2014) 522–530, />D.a. Keane, J.P. Hanrahan, M.P. Copley, J.D. Holmes, M.a. Morris, A modified
Stober process for the production of mesoporous Sub 2 micron silica microspheres;
Applications in HPLC, J. Porous Mater. 17 (2010) 145–152, />10.1007/s10934-009-9274-7.
T.F. O’Mahony and M.A. Morris
Microporous and Mesoporous Materials 317 (2021) 110989
[27] F. Gritti, G. Guiochon, Comparison between the loading capacities of columns
packed with partially and totally porous fine particles. What is the effective surface
area available for adsorption? J. Chromatogr., A 1176 (2007) 107–122, https://
doi.org/10.1016/j.chroma.2007.10.076.
[28] J.O. Omamogho, J.P. Hanrahan, J. Tobin, J.D. Glennon, Structural variation of
solid core and thickness of porous shell of 1.7μm core-shell silica particles on
chromatographic performance: narrow bore columns, J. Chromatogr., A 1218
(2011) 1942–1953, />[29] J.J. Lee, C.-J. Yoo, C.-H. Chen, S.E. Hayes, C. Sievers, C.W. Jones, Silica supported
sterically hindered amines for CO2 capture, Langmuir 34 (2018), />10.1021/acs.langmuir.8b02472 acs.langmuir.8b02472.
[30] J. Nawrocki, The silanol group and its role in liquid chromatography,
J. Chromatogr., A 779 (1997) 29–71, />00479-2.
[31] F. Gao, A.V. Teplyakov, Challenges and opportunities in chemical functionalization
of semiconductor surfaces, Appl. Surf. Sci. 399 (2017) 375–386, />10.1016/j.apsusc.2016.12.083.
[32] C. Cummins, D. Borah, S. Rasappa, A. Chaudhari, T. Ghoshal, B.M.D. O’Driscoll,
P. Carolan, N. Petkov, J.D. Holmes, M.A. Morris, Self-assembly of polystyreneblock-poly(4-vinylpyridine) block copolymer on molecularly functionalized silicon
substrates: fabrication of inorganic nanostructured etchmask for lithographic use,
J. Mater. Chem. C. 1 (2013) 7941–7951, />[33] J. Cras, C. Rowe-Taitt, D. Nivens, F. Ligler, Comparison of chemical cleaning
methods of glass in preparation for silanization, Biosens, Bioelectron 14 (1999)
683–688, />[34] J. Ruz˙yłło, Electrochemical Society. Electronics Division., F. Electrochemical
Society, Meeting (192nd: 1997: Paris, Cleaning Technology in Semiconductor
Device Manufacturing, 1998.
[35] R.G. Acres, A.V. Ellis, J. Alvino, C.E. Lenahan, D.A. Khodakov, G.F. Metha, G.
G. Andersson, Molecular structure of 3-aminopropyltriethoxysilane layers formed
on silanol-terminated silicon surfaces, J. Phys. Chem. C 116 (2012) 6289–6297,
/>[36] A. Sarkar, T. Daniels-Race, Electrophoretic deposition of carbon nanotubes on 3amino-propyl-triethoxysilane (APTES) surface functionalized silicon substrates,
Nanomaterials 3 (2013) 272–288, />[37] C.J. Brinker, R. Sehgal, S.L. Hietala, R. Deshpande, D.M. Smith, D. Loy, C.S. Ashley,
Sol-gel strategies for controlled porosity inorganic materials, J. Membr. Sci. 94
(1994) 85–102, />[38] N. Aissaoui, L. Bergaoui, J. Landoulsi, P. Vi, Silane layers on silicon surfaces :
mechanism of interaction , stability , and influence on protein adsorption,
Langmuir (2012) 656–665, />[39] J. Landoulsi, M.J. Genet, S. Fleith, Y. Tour´e, I. Liascukiene, C. M´
ethivier, P.
G. Rouxhet, Organic adlayer on inorganic materials: XPS analysis selectivity to
cope with adventitious contamination, Appl. Surf. Sci. 383 (2016) 71–83, https://
doi.org/10.1016/j.apsusc.2016.04.147.
[40] K.K. Sharma, A. Anan, R.P. Buckley, W. Ouellette, T. Asefa, Toward efficient
nanoporous catalysts: controlling site-isolation and concentration of grafted
catalytic sites on nanoporous materials with solvents and colorimetric elucidation
of their site-isolation, J. Am. Chem. Soc. 130 (2008) 218–228, />10.1021/ja074128t.
[41] S. Brunauer, P.H. Emmett, E. Teller, Adsorption of gases in multimolecular layers,
J. Am. Chem. Soc. 60 (1938) 309–319, />4074706\rdoi: 10.1021/ja01269a023.
[42] E.P. Barrett, L.G. Joyner, P.P. Halenda, The determination of pore volume and area
distributions in porous substances. Computations from nitrogen isotherms, J. Am.
Chem. Soc. 73 (1951) 373–380.
[43] A.G. Thom´
e, F. Schroeter, P. Bottke, J. Wittayakun, F. Roessner, Facile
determination of the degree of modification of ordered mesoporous silica by liquid
phase NMR, Microporous Mesoporous Mater. 274 (2018) 342–346, https://doi.
org/10.1016/j.micromeso.2018.08.034.
[44] I.A. Rahman, M. Jafarzadeh, C.S. Sipaut, Synthesis of organo-functionalized
nanosilica via a co-condensation modification using (gamma)aminopropyltriethoxysilane (APTES), Ceram. Int. 35 (2009) 1883–1888, https://
doi.org/10.1016/j.ceramint.2008.10.028.
[45] V. Hern´
andez-Morales, R. Nava, Y.J. Acosta-Silva, S.A. Mac´Ias-S´
anchez, J.J. P´
erezBueno, B. Pawelec, Adsorption of lead (II) on SBA-15 mesoporous molecular sieve
functionalized with -NH2 groups, Microporous Mesoporous Mater. 160 (2012)
133–142, />[46] K. Albert, E. Bayer, Review - characterization spectroscopy, J. Chromatogr. 544
(1991) 345–370.
[47] M. Dulski, M. Laskowska, S. Sułowicz, T. Krzykawski, O. Pastukh, P.M. Zieli´
nski,
P. Pawlik, A. Nowak, Ł. Laskowski, The impact of the functionalization of silica
mesopores on the structural and biological features of SBA-15, Microporous
Mesoporous Mater. (2020) 110453, />micromeso.2020.110453.
[48] Y. Wang, M. Noguchi, Y. Takahashi, Y. Ohtsuka, Synthesis of SBA-15 with different
pore sizes and the utilization as supports of high loading of cobalt catalysts, Catal.
Today 68 (2001) 3–9, />[49] L.T. Zhuravlev, The surface chemistry of amorphous silica, Zhuravlev model,
Colloids Surfaces A Physicochem. Eng. Asp. 173 (2000) 1–38, />10.1016/S0927-7757(00)00556-2.
[50] M. Sulpizi, M.P. Gaigeot, M. Sprik, The silica-water interface: how the silanols
determine the surface acidity and modulate the water properties, J. Chem. Theor.
Comput. 8 (2012) 1037–1047, />[51] W.J. Van Ooij, D.Q. Zhu, G. Prasad, S. Jayaseelan, Y. Fu, N. Teredesai, Silane based
chromate replacements for corrosion control, paint adhesion, and rubber bonding,
Surf. Eng. 16 (2000) 386–396, />[52] E. Costa, G. Calleja, F. Domingo, Adsorption of gaseous hydrocarbons on AC, AIChE
J. 31 (1985) 9982–9991.
[53] X. Yuan, J.G. Lee, H. Yun, S. Deng, Y.J. Kim, J.E. Lee, S.K. Kwak, K.B. Lee, Solving
two environmental issues simultaneously: waste polyethylene terephthalate plastic
bottle-derived microporous carbons for capturing CO2, Chem. Eng. J. 397 (2020)
125350, />[54] F. Sevimli, A. Yilmaz, Surface functionalization of SBA-15 particles for amoxicillin
delivery, Microporous Mesoporous Mater. 158 (2012) 281–291, />10.1016/j.micromeso.2012.02.037.
[55] M. Ostwal, R.P. Singh, S.F. Dec, M.T. Lusk, J.D. Way, 3Aminopropyltriethoxysilane functionalized inorganic membranes for high
temperature CO2/N2 separation, J. Membr. Sci. 369 (2011) 139–147, https://doi.
org/10.1016/j.memsci.2010.11.053.
9