Enrichment and purification of peptide impurities using twin-column continuous chromatography
Bạn đang xem bản rút gọn của tài liệu. Xem và tải ngay bản đầy đủ của tài liệu tại đây (2.99 MB, 11 trang )
Journal of Chromatography A 1667 (2022) 462894
Contents lists available at ScienceDirect
Journal of Chromatography A
journal homepage: www.elsevier.com/locate/chroma
Tutorial Article
Enrichment and purification of peptide impurities using twin-column
continuous chromatography
Richard Weldon, Thomas Müller-Späth#,∗
ChromaCon AG, Technoparkstr. 1, Zurich CH-8005, Switzerland
a r t i c l e
i n f o
Article history:
Received 30 December 2021
Revised 8 February 2022
Accepted 9 February 2022
Available online 16 February 2022
Keywords:
Peptide purification
Continuous chromatography
N-Rich
Impurity isolation
Impurity profiling
a b s t r a c t
N-Rich is a twin-column chromatography process that enriches target compounds relative to other components in a mixture, thereby facilitating their isolation and characterization. This study demonstrates
the performance of N-Rich for isolation of Angiotensin II peptide impurities compared with standard analytical and preparative chromatography approaches. Peptides have diverse chemical properties and are
produced using a wide range of methods, resulting in products with complex impurity profiles. The characterization of impurities for clinical development is essential but obtaining high purity samples in sufficient quantities is often a difficult task when using standard chromatographic techniques. In contrast,
by using cyclic continuous chromatography with UV-based process control, N-Rich enables automatic oncolumn accumulation of target impurities while other compounds in the mixture are depleted. This has
multiple advantages compared to standard techniques. Firstly, at the end of the cyclic accumulation phase
the highly enriched target is eluted in one step with high purity and concentration. This means fewer
fractions for analysis are generated and up-concentration steps are reduced. Secondly, the purification
of target impurities using semi-preparative scale chromatography becomes viable, even if initial resolution is poor compared to analytical HPLC. This allows for very significant increases in productivity for
purification of difficult to isolate impurities.
This study demonstrates two N-Rich strategies:
Example 1: Purification of μg quantities of multiple Angiotensin II impurities with a >9-fold increase
in productivity compared to analytical HPLC.
Example 2: Specific isolation of 1 mg of a critical impurity at 88% purity. 79-fold increase in productivity and a 69-fold reduction in solvent consumption compared to analytical HPLC.
© 2022 The Author(s). Published by Elsevier B.V.
This is an open access article under the CC BY license ( />
1. Introduction
Therapeutic proteins, peptides and oligonucleotides are produced by chemical or biological synthesis. After synthesis, in addition to the active pharmaceutical ingredient, all drug products
include product-related impurities, process-related impurities, and
degradation products. According to ICH guidelines [1–3], impurities comprising >0.1% of the total drug product require identification and characterization as part of risk assessment regarding their
impact on patient safety and product efficacy. Based on this assessment, a product specification is defined with strict limits for
every impurity to guarantee product safety and efficacy. For complex molecules such as peptides, oligonucleotides and protein biologics, the number of impurities with abundance >0.1% can be
∗
#
Corresponding author.
E-mail address: (T. Müller-Späth).
considerable. A bottleneck to completing impurity characterization
is the lack of availability of highly purified material. Milligram
amounts of such material are often required for structural confirmation by NMR or X-ray crystallography, and biological studies for
toxicity, immunogenicity and pharmacokinetics can require even
more [4–6].
1.1. Standard isolation of impurities vs. N-Rich
To complete the task of impurity isolation, column chromatography is often the method of choice. However, even if a protocol
is well optimized, standard chromatographic methods have technical limitations leading to a tradeoff between productivity and
purity [7]. For example, standard HPLC techniques use stationary
phases with very small particle diameters combined with a low
sample load to maximize resolution and purity, but at the expense
of productivity. This approach is suitable for tentative identification
of impurities using very sensitive methods such as LC-MS but is
/>0021-9673/© 2022 The Author(s). Published by Elsevier B.V. This is an open access article under the CC BY license ( />
R. Weldon and T. Müller-Späth
Journal of Chromatography A 1667 (2022) 462894
Fig. 1. The N-Rich process is carried out as shown in the schematic. The black diagonal line indicates the steepness of the gradient (%B). Design: With the aid of software,
the boundaries for target recycling (blue, green) are set using a batch chromatogram as template. Four N-Rich methods are generated: Startup - Column 1 is loaded with
a full batch load. Enrichment - target compounds (blue, green) undergo “n” cycles of enrichment while undesirable compounds (red) are discarded as new feed is applied.
Each cycle of enrichment consisted of 2 switches. Each “switch” is composed of four phases of elution, P1, P2, P3 & P4 as shown in Fig. 1 table. A full description of the
enrichment process is detailed in the main text. Depletion – A single switch is carried out without loading new feed resulting in depletion of non-target compounds before
the final elution step. Elution + Fractionation – Finally, enriched target impurities are eluted with fractionation. To maximize resolution the final method uses a shallow
gradient, low flow rate, and double the bed height compared to the enrichment phase.
Table 1
Materials – Analytical, semi-preparative batch and N-Rich chromatography.
Method
Material
Description
Analytical HPLC
Column
Mobile phase A
Mobile phase B
Feed composition
Feed purity
Column
Mobile phase A
Mobile phase B
Feed composition
Feed purity
Column
Mobile phase A
Mobile phase B
In-line dilution buffer
Feed composition
Feed purity
˚ 1.7 μm, 2.1 mm x 50 mm)
ACQUITY UPLC Oligonucleotide BEH C18 Column (130 A,
7 vol% acetonitrile (Merck, 1.00030) / 0.1 vol% TFA (VWR UN2699) in water
90 vol% acetonitrile / 0.1 vol% TFA in water
1 mg/mL in Mobile phase A
92%
YMC Triart Prep C18-S (150 × 4.6 mm ID, S-10 μm, 12 nm)
5 vol% acetonitrile / 0.1 vol% TFA in water
50 vol% acetonitrile / 0.1 vol% TFA in water
2.1 mg/mL in Mobile phase A
92%
2x YMC Triart Prep C18-S (150 × 4.6 mm ID, S-10 μm, 12 nm)
5 vol% acetonitrile / 0.1 vol% TFA in water
50 vol% acetonitrile / 0.1 vol% TFA in water
1 vol% acetonitrile / 0.1 vol% TFA in water
2.1 mg/mL in Mobile phase A
92%
Semi-Preparative
Batch
N-Rich
less suited for production of μg or mg quantities required for more
detailed studies. To obtain larger quantities of target impurities
for characterization the conventional solution is to pool impuritycontaining fractions from multiple analytical HPLC runs until sufficient material has been accumulated. However, difficult to separate
or low abundant impurities can require hundreds or thousands of
analytical purifications over many weeks or months to generate
enough material. Alternatively, the impurity may need to be chemically synthesized and purified [4]. By contrast, semi-preparative
chromatography using stationary phases with larger particle diameter and higher loading capacities is ideal if an impurity is well
resolved from neighboring compounds. However, semi-preparative
chromatography often has insufficient resolution of critical target
impurities resulting in low purity fractions which leaves analytical
HPLC as the only viable standard chromatographic option.
N-Rich is a twin-column chromatographic process with the potential to improve upon standard methods by facilitating the recycling and enrichment of target compounds on-column, and in a
continuous manner. The process can be generally applied for the
isolation of impurities from complex mixtures using standard gradient purification methods as a starting point. For example, N-Rich
was successfully applied for monoclonal antibody (mAb) charge
variant isolation [8,9] using ion-exchange chromatography showing
a 30-fold decrease in the time required to obtain 10 mg compared
to analytical HPLC [9]. Moreover, the purity obtainable with N-Rich
was higher than the purity by analytical HPLC (95% vs. 85% purity).
2
R. Weldon and T. Müller-Späth
Journal of Chromatography A 1667 (2022) 462894
Table 2
Semi-preparative batch run parameters.
Semi-Prep. Batch Method
Column dimensions
Equilibration
Load
Gradient start
Gradient end
Strip
Re-equilibration
Equilibration
Loading
Wash after load
Gradient
Strip
Re-equilibration
Equilibration
Load
Wash after load
Gradient duration
Strip
Re-equilibration
Run time
Batch 1
[mL]
[%B]
[g/L]
[%B]
[%B]
[%B]
[%B]
[cm/h]
[cm/h]
[cm/h]
[cm/h]
[cm/h]
[cm/h]
[CV]
[CV]
[CV]
[CV]
[CV]
[CV]
[h:min]
0.525
0.25
7:20
Batch 2
Batch 3
5 (4.6 mm ID x 30 cm)
15
1.05
2.1
15
70
100
15
500
300
300
100
500
500
3
0.5
1
2
22
2
3
7:21
7:24
Batch 4
N-Rich Example 1 – Design Batch
N-Rich Example 2 – Design Batch
2.5 (4.6 mm ID x 15 cm)
15
8.4
0.525
8.4
15
85
100
15
500
300
300
300
500
500
3
4
0.25
4
2
25
8
10
2
3
8:30
0:44
1:04
Table 3
N-Rich run parameters.
Procedure
N-Rich Example 1
Method
Startup
Column dimensions
Equilibration
Feed load
Wash after load
Gradient start
Gradient end
In-line dilution
Strip
Re-equilibration
Equilibration
Loading
Wash after load
Gradient flow rate (initial)
Gradient flow rate (W-rec & P-collect)
Gradient flow rate (S-Rec)
Strip
Re-equilibration
In-line dilution flowrate (W-rec)
In-line dilution flowrate (S-Rec)
AutoPeak threshold
Equilibration
Load
Wash after load
Gradient duration
Strip
Re-equilibration
Cycles done
Feed processed
Buffer consumption
Run time (Method)
Run time (Procedure)
[mL]
–
[g/L]
[%B]
[%B]
[%B]
–
–
–
[cm/h]
[cm/h]
[cm/h]
[cm/h]
[cm/h]
[cm/h]
[cm/h]
[cm/h]
factor
factor
mAU
[CV]
[CV]
[CV]
[CV]
[CV]
[CV]
–
[mg]
[L]
[h:min]
[h:min]
IL Dil Buffer
0.525
15
–
–
–
–
–
600
200
200
–
–
–
–
–
–
–
–
3
0.25
2
–
–
–
1
1.32
0:11
Enrichment
N-Rich Example 2
Depletion
Elution
Startup
Enrichment
Depletion
2 × 2.5 (4.6 mm ID x 15 cm)
–
–
–
IL Dil Buffer
–
–
0.412
–
–
8.4
5.25
–
–
–
–
15
–
–
15
15
15
–
15
15
85
85
70
–
59
59
IL Dil Buffer IL Dil Buffer
–
–
IL Dil Buffer IL Dil Buffer
Mob pH-B
Mob pH-B
Mob pH-B
–
Mob pH-B
Mob pH-B
IL Dil Buffer IL Dil Buffer IL Dil Buffer
–
IL Dil Buffer IL Dil Buffer
–
–
–
600
–
–
200
–
–
300
300
–
–
–
–
300
–
–
300
300
100
–
300
300
253
253
–
–
130
130
199
199
–
–
216
216
500
–
600
600
600
600
600
600
500
–
600
600
2.57
2.57
–
–
–
–
3.55
3.55
–
–
3
3
390
390
–
–
–
–
–
–
–
3
–
–
0.196
–
–
4
2.5
–
–
–
–
2
–
–
8
8
22
–
6.32
6.32
2
2
2
–
2
2
3
3
3
–
3
3
18
1
1
1
8
1
36.96
0
0
21
210
0
3.03
1.08
19:21
0:37
7:06
0:26
7:11
0:27
27:15
16:04
Elution
–
–
–
15
55
–
Mob pH-B
IL Dil Buffer
–
–
–
100
–
–
500
500
–
–
–
–
–
–
25
2
3
1
0
8:00
1.2. The N-Rich process principle
So given the high utility of N-Rich for antibody charge variant isolation, this study aims to evaluate the potential of N-Rich to obtain
peptide impurities in a more productive way. In this study, reversephase chromatography was used to exploit displacement effects
[10,11] which are less pronounced in ion-exchange chromatography, but are very useful to obtain target compounds with high purity. In contrast to other twin-column chromatographic processes
such as Multicolumn Countercurrent Solvent Gradient Purification
(MCSGP) [12] or CaptureSMB [13], the N-Rich process is not designed to reach a cyclic steady state with multiple product elutions
for obtaining product with uniform concentration and purity. Instead, in N-Rich, the target compounds are accumulated from cycle
to cycle.
A step-by-step depiction of the N-Rich process principle is outlined in Fig. 1. The N-Rich design procedure is described below in
section 4.2. N-Rich is composed of four steps run as an uninterrupted procedure. The enrichment principle is detailed in the table
in Fig. 1. The table shows the activities of column 1 and column 2
during a single N-Rich switch:
Initial state – At the very beginning of an N-Rich run before
the enrichment phase begins, column 1 is pre-loaded in a startup
step while column 2 is clean. This pre-load allows non-target compounds to reach a cyclical steady state quicky which facilitates
their removal using UV-based dynamic process control. During the
3
R. Weldon and T. Müller-Späth
Journal of Chromatography A 1667 (2022) 462894
Fig. 2. Chromatograms of crude Angiotensin II (92% purity) comparing analytical HPLC and semi-preparative chromatography. ⱡ = “easy” to isolate impurity; (∗ ) = “difficult”
to isolate impurity. A - Analytical reversed phase (C18) HPLC. B – “Zoom in” of A. C - Semi-preparative (C18) chromatography comparing 3 different loads. D – “Zoom in” of
C. E - A fraction analysis of an Angiotensin II preparative batch chromatogram (8.4 g/L load). Critical target impurity (∗ ) is obtainable at a purity of 8%.
cyclical enrichment phase, column 1 is always fully loaded at the
completion of the prior switch, while column 2 requires cleaning
and regeneration to remove strongly adsorbing non-target impurities.
•
•
•
P1 (columns in parallel) - column 1 undergoes elution of
weakly adsorbing, non-target compounds to waste; column 2
simultaneously undergoes regeneration ready for the loading
steps in P2, P3 and P4.
P2 (columns interconnected for target recycling) – column 1
undergoes elution of weakly adsorbing target impurities (W),
recycled with in-line dilution directly to column 2. The in-line
dilution ensures re-adsorption of the target impurities on column 2.
P3 (columns in parallel) – column 1 undergoes elution of nontarget compounds (P) to waste; column 2 is simultaneously
loaded with new feed. This step allows enrichment of the tar-
•
get compounds relative to non-target compounds in the mixture. To maintain a switch-to-switch steady state, the quantity
of new feed applied is in equilibrium with non-target products
removed. The load required to achieve this is calculated with
the aid of software, based on the batch chromatogram and fraction analysis.
P4 - (columns interconnected for target recycling) – column 1
undergoes elution of strongly adsorbing target impurities (S),
recycled with in-line dilution directly to column 2. Again, the
in-line dilution ensures re-adsorption of the target impurities
on column 2.
At the conclusion of switch 1, both columns are immediately
ready for switch 2. Column 2 is now fully loaded and column 1 requires cleaning and regeneration. P1 – P4 are repeated as described
above, but with column positions interchanged (Fig. 1 table - yellow arrows). By alternating the position of column 1 and column 2
4
R. Weldon and T. Müller-Späth
Journal of Chromatography A 1667 (2022) 462894
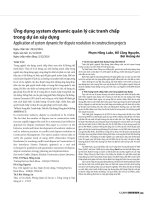
Fig. 3. A batch chromatogram is the starting point of N-Rich design. A – Example 1 uses a low load (0.5 g/L) and a resulting chromatogram with resolution of all impurities
except one species (∗ ) that co-elutes with the main compound. Two enrichment windows were applied covering the early eluting (blue) and late eluting (green) target
impurities. B - N-Rich example 2 was designed using a high load (8.4 g/L). Whilst overall resolution of impurities was reduced, the high load is advantageous for the specific
enrichment of target impurity (∗ ) that co-elutes with the tail of the main conpound peak (green). The higher load increased the area of the main compound peak (red) that
contains no target impurity (∗ ) thus allowing a higher load during the enrichment phase and higher productivity.
switch-to-switch, N-Rich can operate continuously resulting in the
incremental enrichment of the target impurities inside the system.
A single cycle of N-Rich is defined as 2 switches that includes 1
elution from each column and the enrichment phase is continued
for “n” cycles, until sufficient feed is processed.
Following completion of the enrichment step a depletion step
is carried out. This consists of a single switch without loading new feed so that only the enriched target compounds are
transferred to the next column before starting the final elution
step. This greatly reduces the amount of non-target compounds
present in the final elution step. Finally, the enriched target material is eluted with a very shallow gradient over two columns
in-series and the target material is collected with a fine fractionation. Thus, a high resolution of the enriched compounds is obtained, and the pure target material is collected by pooling suffi-
ciently pure fractions only once. Another benefit of the enrichment
process is that the impurity concentration in the collected fractions is much higher than compared to standard chromatographic
methods.
As a model for impurity isolation, we used crude Angiotensin
II as starting material. Angiotensin II is a human hormone which
functions as a vasoconstrictor and can be used as a medication to
treat hypotension. The therapeutic version is a synthetic 8-amino
acid peptide marketed under the brand name Giapreza®. Since the
peptide is relatively short, it is produced by solid phase peptide
synthesis (SPPS). In general, SPPS is a highly efficient process (97%
coupling reaction efficiency), but with many coupling steps and
just as many deprotections steps, it is common to generate many
impurities which differ from the target peptide in a minor way, for
example by missing a single intermediary amino acid. This study
5
R. Weldon and T. Müller-Späth
Journal of Chromatography A 1667 (2022) 462894
Fig. 4. N-Rich Example 1. Absorbance at 220 nm; column 1 – red line, column 2 – blue line; Regions of enrichment - blue & green shading, region of depletion - red shading.
A – Enrichment step – “Zoom out” - 18 Cycles enrichment phase. Inset - “Zoom in” of column 1 enrichment profile. B – Depletion step – 1 switch with no new feed. C Final elution step - 2 columns in series (2x bed height, 2x CV gradient, 0.5x flow rate compared to enrichment phase).
2.2. Batch and N-Rich chromatography
evaluates the twin-column N-Rich process compared to single column chromatography for generating large quantities of low abundant impurities from crude Angiotensin II obtained by SPPS.
Semi-preparative batch methods were carried out for comparison with N-Rich as well as to serve as the process design template
for N-Rich. Batch and continuous chromatography were carried out
using the Contichrom CUBE 30, a lab-scale twin column system
for continuous chromatography (ChromaCon AG, A YMC Company).
UV absorbance at A220 nm was recorded by external UV detectors (2x Knauer AZURA UVD2.1S, ADA00 + 0.5 mm flow cells,
A4069) located directly after each column outlet (UV1@220 nm
and UV2@220 nm respectively) and connected to the Contichrom
CUBE system. Table 1 details the column characteristics, buffer
composition and feed composition used for semi-preparative batch
chromatography and N-Rich runs. Table 2 gives an overview of
the method parameters used for semi-preparative batch runs and
N-Rich design runs (Batch 1, 2 & 3 = Fig. 2C and 2D. Batch
4 = Fig. 2E, N-Rich Design Batch = Fig. 3A and 3B). Table 3 gives
2. Methods
2.1. Analytics
Analytical HPLC chromatography was carried out using an Agilent 1290 series system set at 60 °C. Table 1 shows the column,
solvents and feed used in the method. The gradient parameters
and flow rate are detailed in Supplemental Table 1. Samples from
the Angiotensin II feed, the batch fractions & N-Rich fractions were
prepared for HPLC analysis by diluting 1:1 with water. Samples
were analyzed at a wavelength of A220 nm. Fraction concentrations were also calculated using the area under the curve (AUC)
measured from analytical HPLC.
6
R. Weldon and T. Müller-Späth
Journal of Chromatography A 1667 (2022) 462894
Fig. 5. N-Rich Example 1 – Analytical Evaluation. A – 11 enriched fractions were analyzed by HPLC, and chromatograms were overlayed with the feed profile. B – “Zoom in”
of the feed profile shows the level of impurities in the feed relative to the main Angiotensin II peak. The failure to enrich the early eluting impurity (∗ ) that co-elutes with
the main compound was notable. This impurity was targeted separately in N-Rich example 2. The table at the bottom of Fig. 5 indicates the total mass obtained per 1.5 mL
fraction.
an overview of the method parameters used for two N-Rich example runs shown in Fig. 4 and Fig. 6.
from a semi-preparative batch method (Fig. 2E). Note that, when
comparing analytical and semi-preparative scale, selectivity reversal of impurity (∗ ) was seen.
As loading was increased from 0.5 g/L to 1.0 and 2.0 g/L resin,
it was also observed that additional early eluting impurities (ⱡ,
Fig. 2D) were no longer resolved from the main compound peak
as the Langmuirian peak profile broadened to the left. This further
limits the utility of batch methods with a higher load than 0.5 g/L.
In conclusion, compared to analytical HPLC, semi-preparative batch
chromatography is limited due to a lack of resolution of early eluting target impurities (∗ , ⱡ). For later eluting impurities, loads up to
2 g/L did not severely impact the separation performance (Fig. 2C
and 2D, 250 – 350 min). For these late eluting impurities semipreparative batch chromatography could be a good alternative to
analytical HPLC.
Given the limitations of these standard chromatographic approaches, N-Rich was tested as an alternative process for impurity
production.
3. Results and discussion
3.1. Limitations of standard chromatography for impurity isolation
A high resolution analytical HPLC chromatogram of crude Angiotensin II purified using an analytical reversed phase C18 column
is shown in Fig. 2A and 2B. The purity of the crude material is 92%
and there are multiple low-level impurities present on either side
of the main compound peak. Whilst analytical HPLC provides excellent resolution of impurities and main compound, the very low
loading capacity of the analytical stationary phase severely limits
the productivity of HPLC for impurity production. Purification of μg
quantities of these impurities would require pooling of hundreds
of chromatographic runs, taking weeks of run time. As an alternative to analytical HPLC, semi-preparative chromatographic methods
give worse resolution due to the larger stationary phase particle diameters (10 μm compared to 1.7 μm). However, if sufficient resolution of impurities is achievable, this is a preferable option for impurity isolation as semi-preparative stationary phases are cheaper,
have a higher loading capacity and can run at high flow rates
with lower backpressure. Thus, the semi-preparative scale allows
for far higher productivity, provided that the target purity can be
achieved.
To explore the viability of semi-preparative chromatography for
Angiotensin II impurity isolation a high resolution batch method
was carried out. To maximize resolution, the method utilized a
very shallow gradient, a low flow rate and longer columns than
analytical HPLC (Fig. 2C and 2D). While a generally good resolution
was achievable with a load of 0.5 g/L (the lower limit at which impurities remained detectable), compared to analytical HPLC, a critical target impurity (∗ ) completely co-eluted with the main compound peak (Fig. 2B vs. 2D). This impurity, which was well resolved
in analytical HPLC, had a resulting purity of only 8% in fractions
3.2. N-Rich design procedure
Two complementary N-Rich designs were tested. N-Rich was
firstly used to purify a broad spectrum of Angiotensin II peptide
impurities simultaneously and then used in a more targeted way
to accumulate one difficult to isolate impurity (∗ ).
A pre-requisite to design N-Rich is to generate a single column
batch “design” chromatogram using the Contichrom CUBE system.
An N-Rich design method serves as a template for the cyclical enrichment step and is typically optimized for productivity rather
than very high resolution, since high resolution is only advantageous in the final elution and fractionation step and not required
in the impurity accumulation step of the process. After running the
design method, the resulting chromatogram (Fig. 3A and 3B) was
imported into the N-Rich design software (N-Rich wizard, a module within the Contichrom CUBE operating software). Using the
wizard, the gradient (15%B to 85%B) of the chromatogram was then
7
R. Weldon and T. Müller-Späth
Journal of Chromatography A 1667 (2022) 462894
Fig. 6. N-Rich Example 2. Absorbance at 220 nm; Column 1 – red line, Column 2 – blue line; Regions of enrichment - green shading, Region of depletion - red shading. A 8 Cycle enrichment phase. B - Final elution through 2 columns in series (2x bed height, 2x CV gradient, 0.5x flow rate compared to enrichment phase).
divided into 4 phases, as described in Fig. 1., using five adjustable
section borders (Fig. 3A and 3B, t1-t5). Once section borders for
impurity recycling and non-target compound removal were configured, the wizard automatically determined the necessary load
per switch and in-line dilution factors (Table 3). In addition, NRich example 1 required a UV-threshold-based control set point
(AutoPeak) to trigger main compound removal to waste. This was
necessary to stabilize performance by compensating for small deviations in the retention time that occur during a long, multi-cycle
enrichment phase. Upon finalization of the method parameters, the
N-Rich wizard automatically created four methods as described in
Fig. 1 and outlined in Table 3. (Startup, Enrichment, Depletion &
Final Elution).
trum of impurities in one procedure (Fig. 3A). A total of 18 enrichment cycles were run to process 38.2 mg of feed, after which the
concentration of the impurities on column was sufficiently high
to carry out the depletion and final elution steps Fig. 4.A shows
the results of the enrichment phase where cyclical overlays were
used to visualize the accumulation of the impurities. The load applied per switch was in equilibrium with the main compound removed (red shaded area) so as impurities accumulate, the main
peak is always in steady state. The UV-based process control successfully compensated for changes in the retention time Fig. 4.B
shows the final switch without feeding (depletion) before the final
elution step was carried out (Fig. 4C). Total processing time was
≈27 h.
A clear increase in resolution was seen between the depletion
step and the final elution step due to the use of a high-resolution
method. Also evident in the final elution step is the depletion of
the main compound peak relative to the target impurities and this
results in very little of the Angiotensin II main compound present
3.3. Example 1: N-Rich for broad isolation of Angiotensin II impurities
N-Rich example 1 used a small load of 0.4 g/L resin per switch
to maximize resolution with the aim of accumulating a broad spec8
R. Weldon and T. Müller-Späth
Journal of Chromatography A 1667 (2022) 462894
Fig. 7. N-Rich Example 2 – evaluation of enriched fractions by analytical HPLC. A – Quantification of product vs. critical impurity (∗ ) using analytical HPLC, overlayed with
final N-Rich elution chromatogram. The % purity of the target is reported next to the data labels for each fraction. B – Analytical HPLC overlay of input feed vs. fraction with
highest enrichment of critical impurity (∗ ) (90% pure). The table shows the % purity, mass recovered, and % yield of the highest purity fraction vs. a pool of 3 high purity
fractions.
in any of the impurity fractions. The fractions were collected and
analyzed for purity using analytical HPLC.
Fig. 5 shows an analytical overlay of 11 fractions containing
enriched impurities compared to the original feed. Most regions
of the chromatogram were enriched except for two impurities
(4 & 5(∗ )) which were co-eluting with the main compound and
sent to the waste. Impurity 5(∗ ) was targeted separately in NRich example 2 below. Depending on the starting abundance of
a particular impurity in the feed, between 13 μg and 58 μg was
obtained after N-Rich fractionation. The purity of the 3 weakly
adsorbing impurities was between 80% - 94%, whereas strongly
adsorbing impurities were overlapping with their neighbors resulting in lower purities between 48% and 75%. In theory, purity of these strongly adsorbing impurities could be further im-
proved by using a shallower gradient in this region of the chromatogram and collecting smaller fractions in the final elution
step.
By comparison, a well optimized analytical HPLC method used
to accomplish the same task (assuming 50-μg load per run, a
30 min run time, a high purity of 85–95%), would require >500
chromatography runs and 10 days of continuous running time (>9x
longer than N-Rich). Finally, a high-resolution semi-preparative
batch method would give similar purity to N-Rich, but with a load
of 0.5 g/L per run, a total of 15 runs taking 4.6 days would be
required to complete the task (4x longer than N-Rich), and the
pool concentration would be 15x lower, meaning up-concentration
(with potential sample loss) would be an essential step before subsequent analysis.
9
R. Weldon and T. Müller-Späth
Journal of Chromatography A 1667 (2022) 462894
Fig. 8. Process performance comparison of optimized analytical HPLC, semi-preparative batch chromatography, and N-Rich chromatography for the purification of 1 mg of
critical impurity (∗ ), in terms of purity, processing time and solvent consumption.
In summary, N-Rich example 1 shows that a broad enrichment
strategy facilitates fast purification of μg quantities of multiple
peptide impurities simultaneously and produced at higher concentration than analytical or semi-preparative batch chromatography.
This is ideal for generating samples for tentative characterization
using, for example, MS analysis. For generating larger quantities
with high purity, the following N-Rich example demonstrates a
second approach.
(56% recovery). Possibly, additional cycles would further improve
purity, but that remains to be tested.
HPLC, semi-preparative batch, and N-Rich chromatography were
compared in terms of purity, processing time and solvent consumption (Fig. 8) to obtain 1 mg impurity (∗ ) that is present at
0.8% content in the starting material. The analytical HPLC method
used in the comparison represents a hypothetical, optimized analytical HPLC allowing a loading of 50 μg per HPLC run. The actual
HPLC method used in the experimental part of this study was not
well adapted for the task of impurity production because a load of
<1 μg per HPLC run (very low) had been used. For the hypothetical
HPLC method, achievement of 90% purity, 100% yield and 30 min
run time were assumed. Nevertheless, even when using this “bestcase” HPLC method, 2500 runs including fractionation would be
required to complete the task, taking 52 days of straight operation
and using 75 Liters of solvent. As demonstrated experimentally, NRich completes the task within 16 h (79-fold faster) using about 1.1
Liters of solvent (69-fold less), achieving 88% purity. For the sake
of completeness, the performance of semi-preparative batch chromatography is also shown in Fig. 8, although this process delivers
the target compound at far lower purity (8%).
In summary, N-Rich example 2 shows excellent results, isolating the target impurity in one step at semi-preparative scale and
with a high purity. In addition, whereas scaling analytical HPLC requires parallelization of the task using multiple HPLC systems or
packing of larger columns with very expensive analytical stationary phase, N-Rich is scalable to larger column dimensions using
a single system if necessary and works with cost-effective semipreparative stationary phases. For example, a 20-fold increase in
scale can be obtained simply by increasing the column inner diameter from 0.46 cm to 2 cm, and with no need for extra equipment besides columns. The two examples show that by a simple
change of the process design (i.e. by selecting a different region
of the chromatogram for enrichment, see Fig. 3A, Fig. 3B), the NRich process can be focused to purify on a specific impurity that
was inaccessible with a previous design, exploiting displacement
effects.
3.4. Example 2: N-Rich for targeted isolation of a specific Angiotensin
II impurity
In the second example, N-Rich was designed with one enrichment window (Fig. 3B) targeting a single critical impurity (∗ ) that
was not recoverable in N-Rich example 1. This impurity was resolved in analytical HPLC, but co-elutes with the main compound
when using semi-preparative batch chromatography, giving a purity of only 8% (Fig. 2E). N-Rich example 2 used a far higher load
per cycle compared to N-Rich example 1, with a total of 231 mg
of feed processed, of which 1.8 mg was the target impurity (∗ ).
The high load greatly facilitated the productivity of the method,
minimizing the number of cycles needed to enrich the target sufficiently. 8 cycles of targeted enrichment were carried out and it
was notable that almost no perceptible change in the UV profile
was visible (Fig. 6A). After enrichment, a switch without feeding
(depletion step) was carried out, and a final elution step was done
using a high-resolution method with fractionation (Fig. 6B). Total
processing time was ≈16 h.
Following fraction analysis, the relative mass of main compound
and impurity (∗ ) was plotted against the chromatographic profile
(A220 nm) of the final elution step (Fig. 7A). The % purity of the
target (∗ ) is shown next to the data labels. We can clearly see a
large accumulation of the target (∗ ) relative to the main compound
and the main compound was almost completely displaced from
this region of the chromatogram. As can be seen in Fig. 7B, the
purity of the target is 90% in the purest fraction compared to 0.8%
in the feed. Moreover, this is a 11-fold improvement in purity compared to a semi-preparative batch method which gave a purity of
8% (Fig. 2E).
The table in Fig. 7 shows that the yield of the target impurity is
19% at 90% purity, with a total mass of 0.3 mg obtained. By pooling
3 fractions, purity is slightly less at 88% but with 1 mg obtainable
4. Conclusion
The advantages of N-Rich continuous chromatography over traditional methods for Angiotensin II peptide impurity isolation were
10
R. Weldon and T. Müller-Späth
Journal of Chromatography A 1667 (2022) 462894
shown in two examples and can be summarized as follows. Firstly,
N-Rich enables the use of semi-preparative scale resins with a high
loading capacity to complete a task that is usually carried out using analytical resins. Thus, a high productivity and high resolution
are achievable in one procedure, eliminating the tradeoffs of traditional methods. Secondly, the buffer savings are also proportional
to the productivity increase, leading to huge reduction in solvent
consumption compared to analytical HPLC. Thirdly, target impurities generated from N-Rich elute at a far higher concentration
compared to analytical HPLC or batch chromatography, reducing
the time required for subsequent up-concentration steps. Fourthly,
the single step elution protocol of N-Rich eliminates the need to
carefully monitor fraction quality from “n” number of HPLC runs
thus reducing potential fraction pooling errors. Finally, the problem of longer term storage, handling and stabilization of multiple
fractions generated during a multi-run analytical HPLC project is
also solved.
The barrier to use N-Rich includes the need to procure specialized lab-scale equipment and training. In addition, the setup of an
N-Rich procedure, while greatly facilitated with software, can require extra effort upfront to characterize the impurity profile of
a preparative batch “design” method needed to design an N-Rich
procedure.
Overall, this study demonstrates that N-Rich is a highly productive process that enables the isolation of large quantities of peptide impurities with the high purity required for detailed structural analysis, safety and efficacy studies, or for generation analytical standards. Provided that sufficient starting material is available,
the process represents an attractive alternative to targeted synthesis and purification of impurities.
Declaration of Competing Interest
The authors declare that they have no known competing financial interests or personal relationships that could have appeared to
influence the work reported in this paper.
Acknowledgments
The supply of Angiotensin II by Bachem AG (Bubendorf,
Switzerland) is greatly appreciated.
Supplementary materials
Supplementary material associated with this article can be
found, in the online version, at doi:10.1016/j.chroma.2022.462894.
References
[1] ICH Q3C and ICH Q3C(M): Residual solvents, in: I.C.f.H.o.T.R.f.P.f.H. Use (Ed.)
2002.
[2] ICH Q3A (R): Impurities in new drug substance, in: I.C.f.H.o.T.R.f.P.f.H. Use (Ed.)
2006.
[3] ICH Q3B (R): Impurities in new drug product, in: I.C.f.H.o.T.R.f.P.f.H. Use (Ed.)
2003.
[4] F. Qiu, D.L. Norwood, Identification of pharmaceutical impurities, J.
Liq. Chromatogr. Relat. Technol. 30 (5–7) (2007) 877–935, doi:10.1080/
10826070701191151.
[5] B. Ramachandra, Development of impurity profiling methods using modern analytical techniques, Crit. Rev. Anal. Chem. 47 (1) (2017) 24–36, doi:10.1080/
10408347.2016.1169913.
[6] K.M. Alsante, S. Ahuja, Handbook of isolation and characterization of impurities
in pharmaceuticals, 2003.
[7] S. Golshan-Shirazi, G. Guiochon, Optimization of experimental conditions in
preparative liquid chromatography: trade-offs between recovery yield and production rate, J. Chromatogr. A 536 (1991) 57–73, doi:10.1016/S0021-9673(01)
89236-0.
[8] S.Y. Jing, C. Shi, H.Y. Leong, J.J. Yuan, D. Gao, H.B. Wang, S.J. Yao, D.Q. Lin, A
novel twin-column continuous chromatography approach for separation and
enrichment of monoclonal antibody charge variants, Eng. Life Sci. 21 (6) (2021)
382–391, doi:10.10 02/elsc.2020 0 0 094.
[9] E. Bigelow, Y. Song, J. Chen, M. Holstein, Y. Huang, L. Duhamel, K. Stone,
R. Furman, Z.J. Li, S. Ghose, Using continuous chromatography methodology
to achieve high-productivity and high-purity enrichment of charge variants for
analytical characterization, J. Chromatogr. A 1643 (2021) 462008, doi:10.1016/
j.chroma.2021.462008.
[10] G. Guiochon, A. Felinger, D.G. Shirazi, Fundamentals of preparative and nonlinear chromatography, Elsevier (2006).
[11] L. Aumann, A. Buttè, M. Morbidelli, K. Büscher, B. Schenkel, Modeling of
the chromatographic solvent gradient reversed phase purification of a multicomponent polypeptide mixture, Sep. Sci. Technol. 43 (6) (2008) 1310–1337,
doi:10.1080/01496390801941026.
[12] R. Weldon, J. Lill, M. Olbrich, P. Schmidt, T. Müller-Späth, Purification of
a GalNAc-cluster-conjugated oligonucleotide by reversed-phase twin-column
continuous chromatography, J. Chromatogr. A 1663 (2022) 462734, doi:10.1016/
j.chroma.2021.462734.
[13] M. Angarita, T. Müller-Späth, D. Baur, R. Lievrouw, G. Lissens, M. Morbidelli,
Twin-column CaptureSMB: a novel cyclic process for protein A affinity chromatography, J. Chromatogr. A 1389 (2015) 85–95, doi:10.1016/j.chroma.2015.02.
046.
Author contributions
Richard Weldon: Conception or design of the work, Data collection, Data analysis and interpretation, Drafting the article
Thomas Müller-Späth: Data analysis and interpretation, Critical
revision of the article.
Authorship statement
All persons who meet authorship criteria are listed as authors,
and all authors certify that they have participated sufficiently in
the work to take public responsibility for the content, including
participation in the concept, design, analysis, writing, or revision
of the manuscript
Funding
Funding for this study was provided by Chromacon AG.
11