Báo cáo Y học: Fluorescence study of the high pressure-induced denaturation of skeletal muscle actin pdf
Bạn đang xem bản rút gọn của tài liệu. Xem và tải ngay bản đầy đủ của tài liệu tại đây (379.83 KB, 8 trang )
Fluorescence study of the high pressure-induced denaturation
of skeletal muscle actin
Yoshihide Ikeuchi
1
, Atsusi Suzuki
2
, Takayoshi Oota
2
, Kazuaki Hagiwara
2
, Ryuichi Tatsumi
1
, Tatsumi Ito
1
and Claude Balny
3
1
Department of Bioscience and Biotechnology, Graduate School of Agriculture, Kyushu University, Fukuoka, Japan;
2
Department of Applied Biological Chemistry, Faculty of Agriculture, Niigata University, Japan;
3
INSERM Unite
Â
128,
IFR 24, CNRS, Montpellier, France
Ikkai & Ooi [ Ikkai, T. & O oi, T . (1966) Biochemistry 5, 1551±
1560] made a thorough study of the eect of pressure on
G- and F-actins. However, all of the measurements in their
study were made after the release of p ressure. In the present
experiment in situ observations were attempted by using
eATP to obtain f urther detailed kinetic and thermodynamic
information about the behaviour of actin under pressure.
The dissociation rate constants of nucleotides from actin
molecules ( the decay curve of the intensity o f ¯uorescence of
eATP -G-actin or eADP±F-actin) followed ®rst-order
kinetics. The volume changes for the denaturation of G-actin
and F-actin were estimated to be )72 mLámol
)1
and
)67 mLámol
)1
in the p resence of ATP, respectively. Ch anges
in the intensity of ¯uorescence of F-actin whilst under
pressure suggested that eADP±F-actin was initially depoly-
merize d to eADP±G-actin; subsequently there was quick
exchange of the eADP for free eATP, and then polymer-
ization occurred again with the liberation of phosphate from
eATP bound to G-actin in the presence of excess ATP. In t he
higher pressure range (> 250 MPa), the partial collapse of
the three-dimensional structure of actin, which had been
depolymerized under pressure, proceeded immediately after
release of the nucleotide, so that it lost the ability to exchange
bound ADP with external free ATP and so was denatured
irreversibly. An experiment monitoring eATP ¯uorescence
also demonstrated that, in the absence of Mg
2+
-ATP, the
dissociation of
1
actin-heavy meromyosin (HMM) complex
into actin and HMM did not occur under high pressure.
Keywords: a ctin; denaturation; dissociation; ¯uorescence;
heavy meromyosin; high pressure.
Actin, the major protein in muscle, is composed of two
domains that are separated by a cleft in which one molecule
of ATP or ADP and one divalent cation are present [1].
Actin undergoes transformation from a monomeric form
(G-actin) to a long, helical polymer (F-actin). This conver-
sion of G- to F-actin can be induced by the addition of
neutral salt a nd is coupled with dephosphorylation of ATP
into ADP and inorganic phosphate. Generally, the G ® F
transformation can be repeated by cycling the experimental
salt concentration in the presence of ATP [2]. The sites
responsible f or polymerizatio n a re present i n t he upper
region of the actin molecule, designated as the Ôpointed endÕ
and also i n the bottom region known as a Ôbared endÕ (i.e.
polymerization is due to end-to-end interaction) [3]. Actin
becomes unstable if it loses bound nucleotides and divalent
cations [4]. This results in irreversible denaturation. There-
fore, ATP is considered to contribute to the promotion of
polymerization and the stabilization of the actin structure
[5,6].
Pressure exerts a great in¯uence on t he properties of
proteins by rearrangement and/or destruction o f noncova-
lent bonds such as hydrogen bonds, hydrophobic and
electrostatic interactions, which normally stabilize the
tertiary structure of proteins [7]. There are some reports
describing the effect of hydrostatic pressure on intact muscle
®bres and a ctin±myosin interaction [8,9]. In addition,
Garica et al.[10]andCrenshawet al. [11] reported the
effect of hydrostatic pressure on the equilibrium of actin
polymerization.
The direct effect of pressure on G- and F -actins was ®rst
investigated by Ikkai & Ooi [12], and they reported the
following results: (a) a ctin is irreversibly denatured
> 150 MPa without ATP, but > 250 MPa with ATP.
The amount of protein denatured by pressure is dependent
on the initial protein concentration; (b) ATP protects actin
from pressure-induced denaturation; (c) a reversible F ® G
transformation occurs with release of ADP and P
i
in the
presence of ATP under pressure; (d) a volume change for
the F-actin ® G-actin transformation is estimated to be
)82 mLámol
)1
of monomer from the pressure denaturation
curve although it is considered questionable whether the
value may be indicative of the in vivo DV of assembly.
However, it must be borne in mind that all of the
measurements reported from that study were obtained only
after release of pressure. Therefore it is most important to
make measurements under pressure in order to get accurate
detailed thermodynamic information on the p ressure-
induced denaturation of actin.
Correspondence to Y. Ikeuchi, Department of Bioscience and
Biotechnology, Faculty of Agriculture, Kyushu University,
6-10-1, Hakozaki, higashi-ku, Fukuoka, 812-8581, Japan.
Tel./Fax: +81 92 642 2950, E-mail:
Abbreviations: HMM, heavy meromyosin; NaPP
i
,
sodium pyrophospate.
(Received 9 July 2001, revised 17 October 2001, a ccepted 7 November
2001)
Eur. J. Biochem. 269, 364±371 (2002) Ó FEBS 2002
The aim of the presen t study was to complete a study of
F ® G transition and denaturation of actin under pressure.
Use of a Hitachi F2000 ¯uorospectrophotometer equipped
with a pressure pump and vessel allowed in situ observation
of actin behaviour under pressure.
MATERIALS AND METHODS
Protein preparations
Actin preparations from rabbit skeletal m uscle w ere
obtained from a ceto ne dried powder according to the
procedure o f Pardee & Spudich [13]. Unless used i mmedi-
ately, G-actin with ATP was stored at )20 °Cafter
lyophilization. Myosin was extracted with Guba±Straub
solution from rabbit s keletal m uscle according to the
method of Perry [14] and heavy meromyosin (HMM) was
obtained by limited trypsin digestion of myosin [15]. 1:N
6
-
ethenoadenosine 5 ¢-triphosphate ( eATP) was synthesized
from ATP (Sigma Co.) according to t he method of Secrist
et al. [16]. eATP-labelled G-actin was prepared as described
by Waechter & Engel [17]. T he stoichiometry of t he
binding of eATP was determined according to the proce-
dure of Miki et al.[18].eATP-G-actin was converted into
eADP±F-actin by adding 50 m
M
KCl (polymerization),
and then dialysed against a large volume of cold 50 m
M
KCl, 0.2 m
M
dithiothreitol, 1 m
M
NaN
3
and 10 m
M
Tris/
HCl (pH 7.5).
Tris/HCl buffe r was selected because of i ts negligible
effect of pressure on pH values. Protein concentration was
measured using the extinction coef®cient at 280 nm for a
1% solution of 6.47 for HMM [19] and at 290 nm for a 1%
solution of 6.6 for ATP-G-actin [20].
High pressure apparatus
High pressure devices used for this study consisted of a
thermostated high pressure vessel equipped with sapphire
windows and a pump capable of raising pressure to
400 MPa (Teramecs Co., Ltd, Kyoto, Japan). The vessel
was placed in the light beam of a Hitachi F2000 spectro-
¯uorometer. A quartz cuvette containing sample solutions
was placed inside the vessel.
Fluorescence spectroscopy
Fluorescence measurements w ere made in a Hitachi F2000
¯uorospectrophotometer, inside which the high-pressure
vessel was placed. Temperature was maintained by circu-
lating water from a temperature-controlled bath. The
¯uorescence spectra were quanti®ed by specifying the centre
of spectral mass [21]. The excitation wavelength for the
intrinsic ¯uorescence spectrum was 295 nm which excites
tryptophan residues in the actin molecule.
To determine the kinetics of the p ressure-induced dena-
turation of eATP G-actin (or eADP±F-actin), samples were
kept at elevated pressure s, and the changes in the ¯uores-
cence intensity under pressure were monitored. The excita-
tion wavelength was s et to 360 nm and em ission was
recorded at 410 nm [17,22]. The relative ¯uorescence
intensity was plotted as function of pressure time as shown
below. We ®tted the data to the ®rst-order reaction scheme
usingdata®ttingprogram(
KALEIDAGRAPH
,Abelbeck
Software) to evaluate the apparent denaturation rate
constant (k). The value of volume change was obtained by
plotting lnk vs. pressure [7].
RESULTS AND DISCUSSION
In situ
pressure-induced changes in spectrum and the
centre of spectral mass of the intrinsic ¯uorescence
of ATP-G-actin
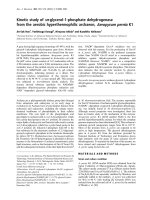
Following pressure increase, a red shift in the spectra with a
decrease in the intrinsic ¯uorescence intensity of G-actin was
observed (Fig. 1, inset). Fig. 1 shows the changes in the
centre of spectral mass of intrinsic ¯uorescence spectrum of
G-actinwithATP(0.5mgámL
)1
, p H 7.5) in a pressure
range from 0.1 MPa to 400 MPa at a ®xed temperature of
20 °C. The transition of the curve of the centre of spectral
mass occurred between roughly 250 and 350 MPa and the
curve reached plateau near 400 MPa. However, the decom-
pression curve did not correspond with the curve observed
upon pressure elevation, indicating that G-actin was
irreversibly denatured even in the presence of ATP under
pressures a s high as 400 MPa although ATP was thought to
play a role in s tabilizing actin structure [6].
288
290
292
294
296
298
300
0 100 200 300 400
Center of Mass /100, cm
-1
Pressure (MPa)
Compression
decompression
0
20
40
60
80
100
120
140
250 300 350 400 450
Fluorescence intensity
Wavelength (nm)
1
2
4
5
3
6
Fig. 1. Fluorescence spectra of G-actin under
various pressure conditions. 1, 0.1 MPa; 2,
100 MPa; 3, 200 MPa; 4, 300 MPa; 5,
400 MPa; 6, return from 400 MPa to
0.1 M Pa (dotted line). In set: the pressure
dependence of the centre o f s pectral mass of
G-actin intrinsic ¯uoresce nce. (d), Com-
pression; (m), decompression. Excitation
wavelength, 295 nm; emission range,
300±400 nm; temperature, 20 °C. Protein
concentrat ion, 0 .5 mgámL
)1
in 2 m
M
Tris/HCl pH 7.5, 0.2 m
M
ATP, 0.2 m
M
dithiothreitol, 0.2 m
M
CaCl
2
,1m
M
NaN
3
.
Ó FEBS 2002 Pressure-induced denaturation of actin (Eur. J. Biochem. 269) 365
In situ
pressure-induced changes in the ¯uorescence
spectra of eATP-G-actin and eADP±F-actin
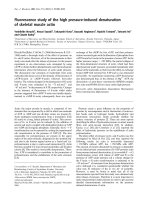
We attempted in situ observation of the behaviour of actin
under p ressure by using eATP w hich emits strong ¯uores-
cence at 410 nm when i t b inds to actin. The chemical
structure of eATP is illustrated in i nset of Fig. 2 [16]. The
¯uorescence emission spectra of eATP-G-actin, eADP±F-
actin and the eATP buffer are displayed in Fig. 2, which
shows that the intensity of ¯uorescence at 410 nm of eATP-
G-actin was higher than that of eADP±F-actin. Both actins
and eATP buffer showed an increase in intensity of
¯uorescence when exposed to a p ressure of 250 MPa.
However, the increase of intensity of ¯uorescence of eATP
buffer itself was much smaller than that of eATP bo und to
G-actin. Therefore, the increase of ¯uorescence seems to b e
due mainly to the conformational change of actin under
pressure.
In situ
pressure-induced changes in the intensity
of ¯uorescence of epsilon nucleotides bound
to G- and F-actins
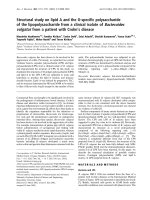
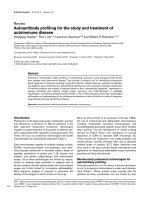
Fig. 3 shows changes in the relative intensity of ¯uorescence
of eATP-G-actin a nd eADP±F-ac tin i n the presence of
eATP as the pressure was raised from 0.1 MPa to 400 MPa.
The Y-axis is calibrated i n values relative to the intensity at
0.1 MPa. In F-actin the relative intensity increased with a
rise in pressure to around 230 MPa, then reached a plateau.
On a f urther increase in pressure, it decreased gradually in a
relatively lower pressure range and steeply in a higher
pressure range. At 400 MPa it d ropped a lmost t o the same
level as the eATP buffer. Thus, the decrease in intensity of
¯uorescence evidently corresponded to the dissociation of
eADP bound to F-actin. For G-actin a pattern similar to
that of F-actin was obtained except that the intensity h ad
already begun to decrease at the time the pressure reached
230 MPa. This indicates that F-actin is somewhat more
resistant to pressure than is G-actin.
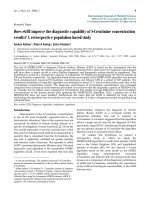
The time course of change in the relative intensity of
¯uorescence of eATP-G-actin under pressures of 100, 200
and 300 MPa is illustrated in Fig. 4. At 100 MPa, the
intensity increased slightly upon pressure elevation, but it
did n ot change while the pressure was maintained at
100 M Pa. After release of pressure, the intensity immedi-
ately returned to its original level. This indicates that the
conformational change of G-actin pressurized at 100 MPa
350 400 450 500 550 600
Wavelength (nm)
1
2
3
4
5
6
+
N
N
N
N
O
H
H
OH
H
OH
CH
2
H
O
POPOPHO
NH
OOO
O
-
O
-
O
-
1, N
6
-ethenoadenosine
5'-triphosphate ( -ATP)
300
250
200
150
100
50
0
Fluorescence intensity
ε
Fig. 2. Variation in ¯ uorescence spectra of eATP-G-actin and
eADP±F-actin at 0.1 MPa or 250 MPa. 1, G-ac tin with eATP at
0.1 M Pa; 2, F-actin with eADP at 0.1 MPa; 3, G- ac tin with eATP at
250MPa;4,F-actinwitheADP at 250 MPa; 5, buer w ith eATP
at0.1MPa;6,buerwitheATP at 250 MPa. E xcitation wavelen gth,
360 nm; emission range, 380±580 nm; temperature, 20 °C. G-actin
solution contained 2 mgámL
)1
G-actin, 2 m
M
Tris/HCl pH 7.5,
0.2 m
M
eATP, 0.2 m
M
dithiothreitol, 0.2 m
M
CaCl
2
,1m
M
NaN
3
.
F-actin solution contained 2 mgámL
)1
F-actin, 10 m
M
Tris/HCl
pH 7.5, 50 m
M
KCl, 0.2 m
M
eATP, 0.2 m
M
dithiothreitol, 0.2 m
M
CaCl
2
,1m
M
NaN
3
. Inset sh ows th e che mical stru cture of eATP [16].
0
0.5
1
1.5
0 500 1000 1500
Relative fluorescence intensity
Time (sec)
230 MPa
250 MPa
275 MPa
300 MPa
350 MPa
400 MPa
Fig. 3. Change in the relative ¯uorescence intensity of G-actin and
F-actin as pressure was elevated from 0.1 to 400 MPa. Solid line,
G-actin; dotted line, F-actin. Excitation wavelength, 360 nm; emission
range, 4 10 nm; temperature, 20 °C. Protein concentration, 2 mgámL
)1
in 2 m
M
Tris/HCl pH 8.0, 0.2 m
M
eATP, 0.2 m
M
dithiothreitol,
0.2 m
M
CaCl
2
,1m
M
NaN
3
. The pressure was maintained for 3min
after reaching the indicated pressure as indicated by the arrows.
Fig. 4. Time courses of change in the relative ¯uorescence intensity of
eATP-G-actin under various pressures. The experimental conditions
were the same as in Fig. 3. Filled arrowh eads show the point at which
the designated p ressure was reached and open a rrowhead s s how the
start of decompression.
366 Y. Ikeuchi et al. (Eur. J. Biochem. 269) Ó FEBS 2002
is fully reversible, which was also con®rmed by measure-
ment of the ¯uorescence spectrum (data not shown). O n t he
other h and, the relative intensity of ¯uorescence d ecreased
slowly at 200 MPa and rapidly at 300 MPa (the protein was
held at these constant pressures) and, in this instance, it did
not return to the initial level after release of the pressure.
To estimate the volume change of G-actin during
denaturation, the time dependence of the relative intensity
of ¯uorescence o f eATP-G-actin was investigated under
pressures ranging from 200 M Pa to 400 M Pa at 25 MPa
intervals (Fig. 5). The decrease in the intensity when
pressure was kept c onstant actually re¯ects the dissociation
of eATP from G-actin. As s hown in Fig. 5 , c hange i n t he
relative intensity of ¯uorescence obeyed ®rst-order kinetics.
Assuming that the dissociation rate constant of eATP from
actin corresponds to its denaturation rate, the volume
change for the denaturation was estimated to be )72 mLá
mol
)1
in the p resence of ATP. This is in the same range as
the value reported by Ikkai & Ooi [12] who estimated the
value from irreversible pressure-induced denaturation after
release of pressure and by Garcia et al.[10]whocalculated
the value from the pressure dis sociation curve o f a ctin
subunits.
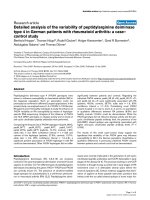
Fig. 6 s hows the time dependen ce of the relative intensity
of ¯uorescence of eADP±F-actin in t he presence of 0.2 m
M
eATP a nd 50 m
M
KCl at several pressure values. The
intensity of ¯uorescence continued to increase as the
pressure was elevated, and it i ncreased for some time even
after the inten ded pressure was r eached (i.e. a thermal effect
due to compression). The extent of increase in intensity was
dependent on the pressure applied. This may be a ttributable
to the i ncrease in t he amount of depolymerized actin
because eATP bound to G-actin generates stronger ¯uor-
escence than eADP±F-actin (see F ig. 2). No notable
alterations in the intensity were observed while pressures
ranging from 0.1 to 240 MPa were maintained. This
suggests a rapid reassociation of depolymerized actin
subunits into eADP±F-actin (i.e. the G«F equilibrium).
The intensity began to decrease as soon as the pressure
reached 250 MPa ( data not shown). When the time
dependence of change in t he intensity of eADP±F-actin at
several pressure values above 250 MPa was investigated, the
decrease in intensity obeyed ®rst-order kinetics as in the case
of G-actin [23]. The volume change for the denaturation of
eADP±F-actin was )67 mLámol
)1
, which was close to that
of G-actin (see Fig. 5).
Effect of pressurization on the exchangeability
of nucleotides bound to actin with free nucleotides
Fig. 7 shows the exchange of eATP bound to G-actin with
free eATP or ATP in the s olvent at 100 MPa where G-actin
is not denatured (Fig. 4). In the presence of eATP, the
¯uorescence intensity showed no change under conditions
of contstant pressure, whereas in the presence of ATP its
decrease with time was exponential. Both actins exposed to
a pressure of 100 MPa for 5 min showed the same DNase I
inhibition capacity (one of the biochemical properties of G-
actin [ 24,25]) after re lease of pressure (data not shown). T his
implied that the decrease in the intensity of ¯uorescence in
the presence of ATP was not attributable to the denatur-
ation of G-actin. Rather these data would represent the
rapid exchange between the bound and the free nucleotides
at relatively low p ressure such a s 100 MPa.
eADP bound to F-actin is not easily exchanged with free
nucleotides at the normal atmospheric pressure unless
external force is applied [2]. Hence, to determine whether
eADP bound to F-actin is capable of exchanging nucleo-
tides under pressure, a similar experiment as in t he case of
eATP-G-actin was conducted (Fig. 7, inset). The result
indicated that eADP bound to F-actin could be replaced by
the free ATP in the pressure range at which the irreversible
denaturation does not take place (see Fig. 6).
F-actin, in contrast with G-actin, is not denatured even in
the presence o f E DTA. ED TA will deprive G-actin of
divalent cation leading to a quick irreversible denaturation
0
0.2
0.4
0.6
0.8
1
0 50 100 150 200 250 300 350
Relative fluorescence intensity
Pressure time (sec)
1
2
3
4
5
6
7
8
9
Fig. 5. Logarithm of the relative ¯uorescence intensity of eATP-G-actin
as a function of pressure time at various pressures. The solid lines sh ow
the best curve ®t of a ®rst ord er k inetics. Th e experimental conditions
were the same as in Fig. 3. The 1 to 9 represent the pressure intensities
at intervals of 25 MPa from 200 MPa up to 400 MPa. Each ¯uores-
cence intensity was expressed relative to the value at the start of decline
in ¯uorescence intensity.
0
0.5
1
1.5
2
2.5
3
3.5
0 50 100 150 200 250 300 350 400
Time (sec)
0.1
50
100
125
150
180
200
230
240
250
Holding pressure
Relative fluorescence intensity
(MPa)
Fig. 6. Time courses of change in the relative ¯uorescence intensity of
eADP±F-actin under various pressures from 0.1 to 250 MPa. Protein
concentration, 2 mgámL
)1
in 10 m
M
Tris/HCl pH 7.5, 0.2 m
M
eATP,
50 m
M
KCl, 0.2 m
M
dithiothreitol, 0.2 m
M
CaCl
2
,1m
M
NaN
3
.
Ó FEBS 2002 Pressure-induced denaturation of actin (Eur. J. Biochem. 269) 367
[4]. Subsequently ¯uorescence measurements of eADP±F-
actin were made in the presence and absence of EDTA and
ATP to con®rm the dissociation±association equilibrium of
actin u nder pressure. Fig. 8 shows the time dependence o f
¯uorescence intensity of eADP±F-actin at 0.1 MPa ( see
inset) or 100 MPa. No change in the intensity was observed
even upon maintaining p ressure constant at 100 MPa
regardless of whether E DTA was present or not. T his result
could be interpreted as follows: eADP±F-actin was ®rst
depolymerized to eADP±G-actin, quickly exchanged its
eADP for external free eATP, and then polymerized again
accompanying the liberation of phosphate from eATP
bound to G-actin. That is to say, the c ycling F ® G ® F
transformation (F«G equilibrium under a certain pressure)
is thought to occur without denaturation in the pressure
range used (see Fig. 12). In a higher pressure range, above
250 MPa (Fig. 9), it was inferred t hat t he partial collapse of
the three-dimensional s tructure of actin, depolymerized
under pressure, proceeds immediately after release of the
nucleotide, so that it loses the exchangeability of bound
ADP with external free ATP. EDTA promoted t he release
of eADP bound to depolymerized G-actin, leading t o
random aggregation after release of pressure because n eutral
salt ( 50 m
M
KCl) was present in the s olution ( see b elow) [4].
Effect of pressurization on the behaviour
of the actin-HMM complex
Ikkai & Ooi [26] found that, in the absent of ATP, turbid
solutions of actomyosin became transparent with increasing
pressure (< 250 MPa). This phenomenon was not inter-
preted as being due to the dissociation of actin and myosin
under pressure. Then in situ observations were made by
monitoring the ¯uorescence of an eADP bound actin±
HMM (the products of myosin digested by trypsin) complex
to clarify whether or not the dissociation of the actin±HMM
complex occurs under pressu re (Figs 10 and 11).
When eATP, but no Mg
2+
,was present in t he solution, in
which conditions actin did not d etach from th e actin±HMM
complex, little change in the ¯uorescence occurred up to
250 MPa (solid line in Fig. 10). This suggested that HMM
prevented F -actin from its dep olymerization a nd subse-
quent denaturation. On an increase in pressure, the intensity
began to decrease, which means that denaturation o f actin
was occurring (see Fig. 5), but its rate was relatively slow
compared that of F-actin alone (dotted line in Fig. 10). As
shown in F ig. 10, the behaviour of actin in the actin±HMM
complex was quite different from that of F-actin alone,
indicating that the actin±HMM complex did not disso ciate
under relatively low pressure (P < 250 MPa). That was
deduced because if t he dissociation of actin from the
complex (subsequent to depolymerization) happened under
pressure, then the intensity of ¯uorescence would h ave been
increased accompanying an increase of free eADP± G-actin
as the pressure was e levated (Figs 2 and 6).
0
0.2
0.4
0.6
0.8
1
1.2
1.4
0 200 400 600 800 1000
Time (sec)
100 MPa
Relative fluorescence intensity
0.8
0.9
1
1.1
1.2
0 200 400 600 800 1000
Time (sec)
0.1 MPa
Relative fluorescence
intensity
Fig. 8. Eect of EDTA on t he release of eADP bound to F-actin with or
without free eATP at 0.1 MPa (inset) and 100 MPa. Protein concen-
tration, 2 mgámL
)1
in 10 m
M
Tris/HCl pH 7.5, 0.2 m
M
eAT P, 50 m
M
KCl, 0.2 m
M
dithiothreitol, 1 m
M
EDTA, 1 m
M
NaN
3
. The other
experimental conditions were th e same as in Fig. 3. Solid line, with ou t
EDTA; dotted line, with EDTA.
0
0.5
1
1.5
2
0 200 400 600 800 1000
Time (sec)
250 MPa
Relative fluorescence intensity
1
2
3
4
5
Fig.9. EectofEDTAonthereleaseofeADP bound to F-actin with
and w ithout free eATP at 250 MPa. T he experimental conditions were
the same as in F ig. 8. 1, W ith eATP; 2 , without eATP ; 3, with EDTA
and eAT P; 4, with EDTA, without eATP; 5, buer.
Fig. 7. Exchange of eATP bound to G -actin by free eATP or A TP in the
solvent under pressure at 100 MPa. Thesamplesweredilutedtoa®nal
concentration of 2 mgámL
)1
with a solution containing eATP (solid
line) or A TP (dotted line) immediately before m onitoring of the ¯uo-
rescence in tensit y. Prote in co ncentration, 2 mgámL
)1
in 2 m
M
Tris/
HClpH7.5,0.2m
M
eATP or ATP, 0.2 m
M
dithiothreitol, 0.2 m
M
CaCl
2
,1m
M
NaN
3
. Inset represents exchange of eADP bound to
F-actin by free eATP or ATP under pressure. The experimental con-
ditions w ere the same as in the case of G-actin except that F-actin was
subjected to 200 MPa pressure.
368 Y. Ikeuchi et al. (Eur. J. Biochem. 269) Ó FEBS 2002
The effect of Mg
2+
-sodium pyrophospate (NaPP
i
)on
the behaviour of actin in the actin±HMM complex (1 : 1
molar ratio where actin ®lament was saturated by HMM
molecules) under pressure was investigated (Fig. 11). I t
should be noted that in this case eATP is not present in the
solution and Mg
2+
-NaPP
i
is capable of dissociating actin±
HMM complex without its hydrolysis. When F-actin
without HMM was pressurized, it began to denature at
low pressure (150 MPa), as compared to the result shown
in Fig. 3, because of a lack of eATP (line 1 in Fig. 11). This
suggests that A TP had a protective effect against denatur-
ation when F-actin was under pressure as pointed out by
Bombardier et al.[6]andIkkai&Ooi[12].When
pyrophosphate withou t M g
2+
was add ed to the actin±
HMM solution, the change in ¯uorescence intensity was
small up to 200 MPa, as shown in Fig. 10, because the
actin±HMM complex did not dissociate under such con-
ditions (line 2 in Fig. 11). On the other hand, in the
presence of Mg
2+
-NaPP
i
, where the actin±HMM complex
can be dissociate d, and in the absence of eATP i n the
external solution, the ¯uorescence intensity began to
decrease prior to reaching 200 MPa ( line 3 in Fig. 11).
When the molar ratio of actin to HMM was reduced from
1 : 1 to 1 : 10,
2
the decay in the intensity of ¯uorescence
proceeded immediately after reaching 100 MPa (line 4 in
Fig. 11), indicating the rapid depolymerization of F-actin
and subsequent its denaturation. This result was unexpect-
ed but might h ave been due to the d epolymerizing effect of
a small amount of HMM, which s timulated fragmentation
of F-actin, as reported by Ikeuchi et al. [27]. Interestingly,
higher pressures (> 350 MPa), the intensities of ¯uores-
cence of HMM alone an d the actin±HMM complex with a
large amount of HMM increased (lines 2, 3 and 5 in
Fig. 11). This reason is not clear, but might arise from the
large conformational change of the HMM molecule itself
under h igh pressure.
In order to explain a decrease in the turbidity of the
actomyosin system under pressure Ikkai & Ooi [26] had
proposed another possibility. This was that t he actin±HMM
complex c ould b e dissociated by pressure even without ATP
although whether or not depolymerization of actin pro-
ceeded prior to the dissociation of t he complex was obscure.
However, our present data did not support this idea as
stated above (Fig. 10). The different interpretation regard-
ing the dissociation of acto-HMM under pressure could be
explained by t he difference in the HMM/F-actin molar r atio
used. Namely, Ikkai & Ooi [26] measured the turbidity of
acto-HMM solution under conditions at which t he
binding between F -actin a nd HMM w as not saturated
(F-actin : HMM 5 : 1) unlike our conditions
(F-actin : HMM 1 : 1). Therefore, the changes in the
turbidity reported by them were presumed to be a ttributable
mainly to the depolymerization o f F -actin which was
unbound to HMM. If this is true, i t may be understandable
to interpret the phenomenon as the dissociation of acto-
HMM. However, such a change in the turbidity (i.e.
dissociation of acto-HMM) is probably not observed when
the binding between F-actin and HMM is fully saturated
(our condition). Although we do not have a satisfactory
explanation for the nondissociation of acto-HMM under
pressure as yet, ou r interpretation is that the association of
actin and HMM, which are in the rigor complex, is so strong
as to resist high pressure ( P < 250 MPa). O f course,
further studies with respect to this point are needed.
0
100
200
300
0 100 200 300 400 500
Time (sec)
100 MPa
150 MPa
200 MPa
250 MPa
300 MPa
275 MPa
375 MPa
400 MPa
350 MPa
Fluorescence intensity
Fig. 10. Change in the ¯uorescence intensity of F-actin or acto-HMM
complex in the presence of eATP as pressure was elevated from 0.1 to
400 MPa. Dotted line, F-actin; solid line, acto-HMM complex. Pro-
tein concentration, 3.4 mgámL
)1
HMM (10 l
M
)and/or0.42 mgámL
)1
F-actin (10 l
M
)in10m
M
Tris/HCl pH 7. 5, 50 m
M
KCl, 2 m
M
eATP,
0.2 m
M
dithiothreitol, 0.2 m
M
CaCl
2
,1m
M
NaN
3
. The pressure was
kept for approximately 30±60 s after reaching the indicated pressure as
shown by the arrows.
0
50
100
150
0 100 200 300 400 500 600 700 800
Time (sec)
250 MPa
200 MPa
300 MPa
400 MPa
350 MPa
150 MPa
1
2
3
4
5
Fluorescence intensity
Fig. 11. Change in the ¯uorescence intensity of F-actin, acto-HMM
complex and HMM with and without Mg
2+
-NaPP
i
as pressure was
elevated from 0.1 to 400 MPa. 1, F-actin alone (10 l
M
)with1m
M
MgCl
2
and 2 m
M
NaPP
i
(dotted line); 2, acto-HMM complex (actin/
HMM ratio 1 : 1) with 2 m
M
NaPP
i
; 3, acto-HMM comp lex (actin/
HMM ratio 1 : 1) with 1 m
M
MgCl
2
and 2 m
M
NaPP
i
;4,acto-HMM
complex (actin/HMM ratio 10 : 1) with 1 m
M
MgCl
2
and 2 m
M
NaPP
i
;5,HMMalone(10l
M
)with1m
M
MgCl
2
and 2 m
M
NaPP
i
(dotted l ine). The other exp erimental conditions were the same as i n
Fig. 10 except that eATP was not p resent in the solution. The pressure
was kept for approximate ly 2 min after reaching the indicated p ressure
shown by the arrows.
Ó FEBS 2002 Pressure-induced denaturation of actin (Eur. J. Biochem. 269) 369
On the other hand, the behaviour of the actin±HMM
complex in the presence of Mg
2+
-NaPP
i
(i.e. under
dissociation conditions) was different from that in the
absence of ATP. That is, the actin±HMM complex
evidently d issociated into actin and HMM because the
¯uorescence intensity rapidly decreased prior to reaching
200 MPa (lines 3, 4 in F ig. 11). I kkai & Ooi [ 26] have
reported that t he dissociation of the actin±HMM complex
was quite possible in the presence of ATP under pressure
because of the reduction of Mg-activated ATPase and
pressure > 150 MPa was required to induce a signi®cant
dissociation of the complex. In any event HMM protects
denaturation of F-actin up to 200 MPa in the absence of
ATP (compare line 1 and line 2 in Fig. 11), whereas high
pressure under conditions that favour actin±HMM complex
dissociation (or in t he presence of Mg
2+
-NaPP
i
or
Mg
2+
-ATP) promotes the denaturation of actin following
the dissociation of actin±HMM complex (lines 3, 4 in
Fig. 11).
In conclusion, the dissociation rates of nucleotides from
the a ctin molecule (i.e. the decay curve of the ¯uo rescence
intensity o f eATP-G-actin) obeyed good ®rst order kinetics
(Fig. 5 ). The volume change for the d enaturation, calculat-
ed from their rate constants, was close to that obtained b y
Ikkai & Ooi [12] who estimated it after release of pressure.
In addition the denaturation of G-actin under pressure is
coupled with loss in the exchangeability of bound ATP
against f ree ATP ( Figs 7±9). T he present r esults mostly
veri®ed their data and speculations (i.e. the value of volume
change, protecting e ffect of A TP on denaturation, repoly-
merization and so on), but we emphasize that our in situ
experiments show more direct and clearer evidence
3
for those
facts t han the ex situ experiment by Ikkai & Ooi [12]. On the
other hand, information obtained from t he ¯uorescence
measurements of the a cto-HMM system ( Fig. 10) was
contradictory to the idea of Ikkai & Ooi [26] that the acto-
HMM complex in the absence of Mg
2+
-ATP dissociates
into actin and HMM under pressure. The reason for the
discrepancy was mentioned a bove.
Apart from the ¯uorescence experiments, we attempted
spectroscopic measurement such as NMR and also bio-
chemical assays of actin after pressure release. Although
details of the data are discussed elsewhere [23], the disap-
pearance of a characteristic
1
H NMR signal at 2.06 p.p.m.,
which is c onsidered to originate from the methyl proton of
methionine in the vicinity of the DNaseI binding site in actin
[28], and the loss i n b iochemical activity (DNase I i nhibition
capacity) were almost identical. The DNaseI binding site is
located o n the surface of t he actin molecule [1]. Taking these
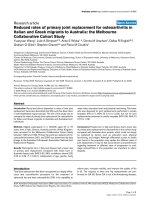
facts into account, we have inferred that the rapid collapse of
the three-dimensional structure around the upper region
known as the Ôpointed endÕ (e.g. burying into the i nside of the
molecule) i s caused following the dissociation o f the bound
nucleotide (ATP). T he scheme of the pressure-induced
denaturation process of actin in the presence of ATP is
shown in Fig. 12 on a basis of present observations.
ACKNOWLEDGEMENTS
This study was supported in part by a Grant-in-Aid for Scienti®c
Research from the Ministry of Education, Science, Sports and C ulture
of Japan (No. 10460118). We thanks Dr Goodenough, University of
Reading, UK, for reading this manuscript.
REFERENCES
1. Kabsh,W.,Mannherz,H.G.,Such,D.,Pai,E.F.&Holmes,K.C.
(1990) Atomic structure of the actin: Dnase I complex. Nature 347,
37±44.
2. Oosawa,F.&Kasai,M.(1971)Actin.InSubunits in Biological
Systems (Timashe, S.N. & Fasman, G.D., eds) part A , pp. 261±
322. Dekker, N ew York.
3. Pollard, T.D. (1986) A ctin and actin-binding proteins. A critical
evaluation of mechanisms and function. Annu. Rev. Biochem. 55,
987±1035.
4. Lewis, M.S., Maruyama, K., Carroll, W.R., Kominz, D.R. &
Laki, K. (1963) Physical propeties and polymerization reactions of
native and inactivated G-actin. B i och em ist ry 2, 34±39.
5. Carlier, M F. (1989) Role of nucleotide hydrolysis in the
dynamics of actin ®laments and microtubules. Int. Rev. Cytol 1,
139±170.
6. Bombardier, H., Wong, P. & Gicquaud, C. (1997) Eect of nu-
cleotides o n the den aturation of F-actin: a d ierential scanning
calorimetry and FTIR spectroscopy study. Biochem. Biophys.
Res. Commun. 236, 798±803.
7. Mozhaev, V.V., Heremans, K., Frank, J., Masson, P. & Balny, C.
(1996) High pressure eects on protein structure and function.
Proteins 24, 81±91.
8. Fortune, N.S., Geeves, M.A. & Ranatunga, K .W. (1991) T ension
responses to rapid pressure release in glycerinated rabbit muscle
®bers. Proc. Natl Acad. Sci. USA 88, 7323±7327.
9. Fortune, N.S., Geeves, M.A. & Ranatunga, K.W. (1994) Con-
tractile activation and force generation in skeletal rabb it muscle
®bres eects of hydrostatic pressure. J. Physiol. 474, 283±290.
10. Garcia, C.R.S., Amaral, J.A., Abrahamsohn, P. & Verjovski-
Almeida, S. (1992) D issociation of F-actin induced by hydrostatic
pressure. Eur. J. Bioche m. 209, 1005±1011.
ADP
A
D
P
A
D
P
A
D
P
A
D
P
A
D
P
A
D
P
ADP
ATP
250 MPa < P
250 MPa > P
(with or without
EDTA)
depolymerised
actin
repolymerisation
(with neutral salt)
rapid exchange
ADP
ATP
Pi
rapid release
of ADP
depolymerised actin
denatured
actin
random aggregation
after release of pressure
[1]
[2]
[3]
Fig. 12. Schematic interpretation of the
behaviour of F-actin in the presence of free ATP
under pressure. In brief: 1, below 250 MPa,
once depolymerized actin is repolymerized
with or without EDTA if A TP is fully present;
2, above 250 MPa F-actin is ®rst depolymer-
ized and is then denatured with the rapid
release of ADP. If EDTA is present, this step is
accelerated; 3, after release of pressure, ran-
dom aggregation of denatured actin occurs.
370 Y. Ikeuchi et al. (Eur. J. Biochem. 269) Ó FEBS 2002
11. Crenshaw, H.C., Allen, J.A., Ske en, V., Harris, A. & Salmon, E.D.
(1996) Hydrostatic pressure has d ierent eects on the assembly of
tubulin, actin, myosin II, vinculin, talin, v imentin, and cytoske r-
atin in mammalian tissue. Exp. Cell Res. 227, 285±297.
12. Ikkai, T. & Ooi, T. (1966) The eects of pressure on G±F trans-
formation of actin. Biochemistry 5, 1551±1560.
13. Pardee, J.D. & Spudich, J.A. (1982) Puri®cation o f muscle actin.
In Methods in Cell Biology (Wilson, L., ed.), Vol. 24, pp. 271± 289.
Academic Press, New York.
14. Perry, S.V. ( 1951) Th e adeno sinetriphosphatase activity of myo-
®brils isolated from skeletal muscle. Biochem. J. 48, 257±265.
15. Lowey, S . & Cohen, C. (1962) Studies on the structure of myosin.
J. Mol. Biol. 4, 293±308.
16. Secrist, J.A. III,, Barrio, R., Leonard, J. & Weber, G. (1972)
Fluorescent modi®cation of adenosine-containing coenzymes.
Biological activities and spectroscopic properties. Bioc h emi stry 11,
3499±3506.
17. Waechter, F. & Engel, J. (1975) The kinetics of t he exchange of
G-actin-bound 1:N
6
-ethenoadenosine 5¢-triphosphate with ATP
as followed by ¯uorescence. Eur. J. Biochem. 57, 453±459.
18. Miki, M., Ohnuma, H . & Mihashi, K. (1974) Interaction of a ctin
water e-ATP. FEBS L ett. 46, 17±19.
19. Young, D .M., Himmelfarb, S . & Harrington, W.F. (1965) On the
structural assembly of the polypeptide chains of heavy meromy-
osin. J. Biol. Chem. 240, 2428±2436.
20. Mannherz, H.G., Goody, R.S., Konrad, M. & N owak, E. (1980)
The interaction of bovine pancreatic deoxyribonulease I and
skeletal muscle actin. Eur. J. Biochem. 104, 367±379.
21. Ruan,K.,Lange,R.,Meersman,F.,Heremans,K.&Balny,C.
(1999) Fluorescence and FTIR study of the pressure-induced
denaturation of bovine pancreas trypsin. Eur. J. Biochem. 265,
79±95.
22. Neidl, C. & Engel, J. (1979) Exchange of ADP, ATP and 1: N
6
-
ethenoaden osine 5¢-triphosphate at G- actin. Eur. J. Biochem. 101,
163±169.
23. Ikeuchi, Y., Suzuki, A ., Oota, T ., Hagiwara, K . & Balny, C. (2001
4
)
Behavior of actin u nder high pressure. In Trends in High Pressure
Bioscience and Biotechnology (Hayashi, R., ed.). Elsevier Science,
Amsterdam, In press.
24. Swezey, R.R. & Somero, G.N. (1982) Polymerization thermody-
namics and structural stabilities of skeletal muscle actins from
vertebrates adapted to dierent temperatures and hydrostatic
pressures. Biochemistry 21, 4496±4503.
25. SchcË ler, H., Lindberg, U., Schutt, C.E. & Karlsson, R. (1999)
Thermal unfolding of G-actin monitored with the DNase I-inhi-
bition assay stabilities of actin isoforms. Eur. J. Bioc hem. 267, 476±
486.
26. Ikkai, T . & Ooi, T. (1969) The eects of pressure on actomyosin
systems. Biochemistry 8, 2615±2622.
27. Ikeuchi, Y ., Iwamura, K., M achi, T., Kakimoto, T. & Suz uki, A.
(1992) Instability of F-actin in the absence of ATP: a s mall amount
of myosin destabilizes F-actin. J. Biochem. 111, 606±613.
28. Heintz, D., Kany, H. & Kalbitzer, H.R. (1996) Mobility of t he
N-terminal segment of rabbit skeletal muscle F-actin detected
by
1
Hand
19
F nuclear magnetic resonance spectroscopy. Bio-
chemistry 35, 12686±12693.
Ó FEBS 2002 Pressure-induced denaturation of actin (Eur. J. Biochem. 269) 371