Viscometric study of chitosan solutions in acetic acid/sodium acetate and acetic acid/sodium chloride
Bạn đang xem bản rút gọn của tài liệu. Xem và tải ngay bản đầy đủ của tài liệu tại đây (361.72 KB, 6 trang )
Carbohydrate Polymers 133 (2015) 245–250
Contents lists available at ScienceDirect
Carbohydrate Polymers
journal homepage: www.elsevier.com/locate/carbpol
Viscometric study of chitosan solutions in acetic acid/sodium acetate
and acetic acid/sodium chloride
Cristiane N. Costa a , Viviane G. Teixeira b , Marcia C. Delpech a , Josefa Virginia S. Souza a ,
Marcos A.S. Costa a,∗
a
b
Universidade do Estado do Rio de Janeiro, Instituto de Química, R. São Francisco Xavier, 524, Maracanã, 20550-900 Rio de Janeiro, RJ, Brazil
Universidade Federal do Rio de Janeiro, Instituto de Química, Av. Athos da Silveira Ramos, 149, 21941-909, Rio de Janeiro, RJ, Brazil
a r t i c l e
i n f o
Article history:
Received 22 April 2015
Received in revised form 29 June 2015
Accepted 30 June 2015
Available online 13 July 2015
Keywords:
Chitosan
Single-point determination
Solvent quality
Molecular weight determination
a b s t r a c t
A viscometric study was carried out at 25 ◦ C to assess the physical–chemical behavior in solution and
¯ v ) of chitosan solutions with different deacetylation degrees, in two
the mean viscometric molar mass (M
solvent mixtures: medium 1—acetic acid 0.3 mol/L and sodium acetate 0.2 mol/L; and medium 2—acetic
acid 0.1 mol/L and sodium chloride 0.2 mol/L. Different equations were employed, by graphical extrapolation, to calculate the intrinsic viscosities [Á] and the viscometric constants, to reveal the solvent’s quality:
Huggins (H), Kraemer (K) and Schulz–Blaschke (SB). For single-point determination, the equations used
were SB, Solomon–Ciuta (SC) and Deb–Chanterjee (DC), resulting in a faster form of analysis. The values
¯ v were calculated by applying the equation of Mark–Houwink–Sakurada. The SB and SC equations
of −M
¯ v and the Schulz–Blachke constant (kSB ),
were most suitable for single-point determination of [Á] and −M
equal to 0.28, already utilized for various systems, can also be employed to analyze chitosan solutions
under the conditions studied.
© 2015 Elsevier Ltd. All rights reserved.
1. Introduction
Chitosan is a linear polysaccharide obtained by alkaline deacetylation of chitin. Chitin is a linear homopolymer composed
poly-[ → 4)-N-acetyl--D-glucosamine-(1→] (Rinaudo, 2006). Chitosan is a cationic linear polysaccharide composed essentially of
(1 → 4)-linked -D-glucosamine units together with some proportion of N-acetyl--D-glucosamine units (Peniche, Arguelles-Monal,
Peniche, & Acosta, 2003), i.e. chitosan is derived from chitin by (partial) deacetylation. The two biopolymers are distinguished from
each other mainly by their solubility in acidic aqueous solutions. An
important parameter of the molecular structure of these materials
is the deacetylation degree, or the percentage of glucosamine units
in the chitosan molecule. The copolymer is generally accepted as
being chitosan when the deacetylation degree is greater than 50%
(Rinaudo, 2006).
The efficacy of chitosan depends on its molar mass and polydispersion. If the molar mass is known and there is good understanding
of the conformation of the polymer in the solvent medium, the
∗ Corresponding author. Tel.: +55 21 2334 0563.
E-mail address: (M.A.S. Costa).
/>0144-8617/© 2015 Elsevier Ltd. All rights reserved.
rheological and mechanical properties can be estimated (Kassai,
2007).
In infinitely diluted solutions, the polymer–solvent interactions
can provide information on the hydrodynamic volume of the chain
in the solvent and the dimensions of the macromolecule. Capillary viscometry is an easily executed but laborious experimental
method that supplies this information. Hence, there is strong interest in developing experimental and mathematical methods that
can simultaneously reduce the time of experimental determination
of these parameters and provide results with small error margin
(Delpech, Coutinho, Souza, & Cruz, 2007; Delpech & Oliveira, 2005;
Delpech, Coutinho, & Habibe, 2002a; Delpech, Coutinho, & Garcia,
2002b; Mello, Delpech, Fernanda, & Albino, 2006, 2005; Silva, Mello,
Delpech, & Costa, 2013).
The intrinsic viscosity [Á] is considered a measure of the volume of a single polymer molecule in an ideal condition. Therefore,
¯ v ) is determined from the
the mean viscometric molar mass (−M
intrinsic viscosity [Á], which in turn can be obtained by graphical
extrapolation, in an infinite dilution model, by applying various
mathematical equations, like those developed by Huggins (H),
Kraemer (K) and Schulz–Blaschke (SB) (Eqs. (1)–(3), respectively).
(Huggins, 1942; Kraemer, 1938; Schulz & Blaschke, 1941).
Ásp
= [Á]h + kh [Á]2h c
c
(1)
246
C.N. Costa et al. / Carbohydrate Polymers 133 (2015) 245–250
lnÁr
= [Á]k − kk [Á]2k c
c
Ásp
= [Á]sb + ksb [Á]sb Ásp
c
(2)
(3)
where Ár = relative viscosity or viscosity ratio (Ár = t/to , being
to the efflux time of the solvent and t the efflux time of the
solution in a given concentration), Ár − 1 = Ásp (Ásp = specific
viscosity), Ásp /c = Áred = reduced viscosity or viscosity number,
c = concentration, [Á]h = limc → 0 Ásp /c = intrinsic viscosity or limiting
viscosity number of Huggins, [Á]k = limc → 0 lnÁr /c = intrinsic viscosity or limiting viscosity number of Kraemer, [Á]SB = limÁsp → 0
Ásp /c = intrinsic viscosity or limiting viscosity number of
Schulz–Blaschke, and kh , kk and kSB = coefficients of Huggins,
Kraemer and Shulz–Blaschke, respectively.
Experimental results show that kh < 0.50 and kk < 0 indicate good
solvents, while kh > 0.50 and kk > 0 indicate poor solvents (Delpech
et al., 2007, 2002a, 2002b; Delpech & Oliveira, 2005; Mello et al.,
2006, 2005; Silva et al., 2013).
Combining Eqs. (1) and (2) and starting from the premise
that kh + kk = 0.5, Solomon and Ciutˇa (1962) obtained Eq. (4) to
determine the intrinsic viscosity by a single point, using a single
concentration value.
[Á]sc =
2 Ásp − ln Ár
1/2
(4)
c
Eq. (5) was proposed by Deb and Chanterjee (1968) as an expression of intrinsic viscosity, also determined from a single point.
[Á]dc =
3lnÁr + 3 / 2Á2sp − 3Ásp
c
1/3
(5)
Eqs. (4) and (5) are therefore independent of constants, unlike
Eqs. (1)–(3), allowing direct calculation without the need for various concentration values for extrapolation. Eq. (3) (Shulz–Blaschke)
also is widely used for single-point determination, using the
fixed value of 0.28 for kSB , which according to the literature is
adequate for many polymer–solvent–temperature systems (AbdelAzim, Atta, Farahat, & Boutros, 1998; Delpech et al., 2007, 2002a,
2002b; Delpech & Oliveira, 2005; Khan, Gupta, & Bhargava, 1983;
Mello et al., 2005, 2006; Schoff, 1999; Silva et al., 2013).
Using a single concentration value substantially reduces the
time necessary to conduct the experiment, making the application of these equations very attractive both among researchers
and industrial technicians, for quality control. However, for the
results of intrinsic viscosity measurements using equations with
a single point to be validated, the polymer–solvent–temperature
system first needs to be studied by graphical extrapolation. The
single-point equations are then employed, choosing the lowest
concentration value, i.e., the one nearest zero concentration. An
error analysis based on the percentage difference between the
values obtained by graphical extrapolation and by single-point
determination is then carried out to choose the best equation. The
equation of Huggins is generally employed as the base for the calculations (Delpech et al., 2007, 2002a, 2002b; Delpech & Oliveira,
2005; Mello et al., 2006, 2005; Silva et al., 2013).
The intrinsic viscosity of a polymer in a given solvent increases
with the polymer’s molar mass. This relation is the base for the
viscometric method to assess the molar mass of a polymer from
the equation of Mark–Houwink–Sakurada (MHS):
¯v
[Á] = K M
a
(6)
¯ v is the mean viscometric molar mass while K and a
Here −M
are the viscometric constants, which vary in function of the nature
of the solvent, temperature and chemical structure of the poly´ & Mencer, 2005; Moreira, Silva, Wang, &
mer (Matusinovií, Rogoˇsic,
Balogh, 2004; Robinson, Holladay, Hash, &Puettl, 1982; Simionescu,
Loan, & Simionescu, 1987).
Various parameters affect the intrinsic viscosity of chitosan,
such as concentration, molar mass, solvent, temperature, shear
rate, chemical structure of the polymer and deacetylation degree
of the chitosan. In the case of polyelectrolytes, as is the case of chitosan in acidic media, the degree of dissociation of the ionic groups
also is an important factor that must be considered. For chitosan
in solution and polyelectrolytes in general, the presence of ionic
groups in their structures leads to expansion of the polymer chains
due to the electrostatic repulsions, causing in increase in viscosity.
However, the addition of a salt to the aqueous solution of polyelectrolytes triggers a reduction of the electrostatic repulsion, leading
to a conformation that is neither excessively extended nor excessively entangled, diminishing the viscosity (Cho, Heuzey, Bégin, &
Carreau, 2006; Desbrières, Martinez, & Rinaudo, 1996).
The literature describes the use of different dilution media and
the importance of determining the molar mass to estimate the
rheological and mechanical properties of chitosan. Kassai (2007)
calculated the viscometric constants K and a of the MHS equation
for chitosan samples in different solvents and at varied temperatures, while Canella and Garcia (2001), Chen, Liu, Chen, and
Chen (2008) and Yomota, Miyazaki, and Okada (1993) determined
the intrinsic viscosity of chitosan by extrapolation of data on
viscosity at infinite dilution, according to the equation of Hug¯ v ), through the
gins and the mean viscometric molar mass (−M
Mark–Houwink–Sakurada equation.
Physical–chemical studies of the solvent quality and determination of the best equation to calculate the intrinsic viscosity and
molar mass from a single point have been described for various
polymer–solvent–temperature systems (Delpech et al., 2007,
2002a; 2002b; Delpech & Oliveira, 2005; Mello et al., 2006, 2005;
Silva et al., 2013). To the best of our knowledge, there are no
reports in the literature of this type of study of polymers based
on chitosan. Therefore, the aim of this work was to investigate
the viscosimetry, at 25 ◦ C, of chitosan samples with different
acetylation degrees to verify the quality of the solvent medium and
to ascertain the best equation to calculate the both the intrinsic
viscosity and mean viscometric molar mass from a single point. We
used two aqueous media as solvents. These aqueous media were
selected because they are most commonly found in the literature.
Medium 1 was composed of a mixture of acetic acid 0.3 mol/L and
sodium acetate 0.2 mol/L while medium 2 consisted of acetic acid
0.1 mol/L and sodium chloride 0.2 mol/L (Canela & Garcia, 2001).
2. Experimental
2.1. Purification of the chitosan
Approximately 1 g of commercial chitosan sample (acquired
either from Polymar, deacetylation degree 85%—sample C1, or from
Aldrich, deacetylation degree 93%—sample C2) was dispersed in
300 mL of an aqueous solution of acetic acid (Vetec Química Fina
Ltda.) at 0.5 mol/L and the system was kept under stirring for 24 h.
The resulting solution was filtered through Whatman no. 40 filter paper (8 m) and then through a cellulose acetate membrane
with 0.45 m pores (Millipore), under low pressure. An aqueous
solution of 10% sodium hydroxide (Vetec Química Fina Ltda.) was
then added to the filtered solution until precipitation of the chitosan. The precipitated polymer was separated by centrifugation
and was washed repeatedly with distilled water until neutral pH.
Then it was washed with mixtures of water and ethanol (Vetec
Química Fina Ltda.) in proportions of 3:1, 1:1, 1:3 and also in absolute ethanol (Vetec Química Fina Ltda.). The product obtained was
dried in an oven at 60 ◦ C for 48 h (Canela & Garcia, 2001).
C.N. Costa et al. / Carbohydrate Polymers 133 (2015) 245–250
247
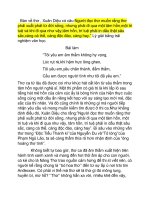
Fig. 1. Log Ásp versus log c[Á] for chitosan C1 in (a) CH3 COOH 0.1 mol/L/NaCl 0.2 mol/L and (b) CH3 COOH 0.3 mol/L/CH3 COONa 0.2 mol/L. Log Ásp versus log c[Á] for chitosan
C2 in (c) CH3 COOH 0.1 mol/L/NaCl 0.2 mol/L and (d) CH3 COOH 0.3 mol/L/CH3 COONa 0.2 mol/L.
2.2. Determination of viscosity and molar mass
To determine the intrinsic viscosity, [Á], the chitosan samples,
identified as C1 and C2, were dissolved in an aqueous medium
(medium 1) of acetic acid and sodium acetate (Vetec Química
Fina Ltda.) (CH3 COOH 0.3 mol/L/CH3 COONa 0.2 mol/L) or another
aqueous solution (medium 2) of acetic acid and sodium chloride
(Merck S.A.) (CH3 COOH 0.1 mol/L/NaCl 0.2 mol/L), to obtain a chitosan concentration of 0.003 g/mL. While preparing the solution,
the polymer was kept under stirring for approximately 18 hours
to assure complete solubilization of the macromolecules in the
medium employed. The solvents were then filtered through a cellulose acetate membrane with pore size of 0.45 m and the chitosan
solution was filtered through Whatman no. 40 filter paper (8 m)
and then a cellulose acetate membrane with the same pore size.
The viscometric parameters were measured at 25 ± 0.05 ◦ C
using a Ubbelohde C529 capillary viscometer with capillary diameter of 0.63 mm, in a ThermoHaake DC30 temperature controlled
bath apparatus. The experimental determination of the intrinsic
viscosity, by extrapolation, was performed by timing the flow of
the solvents (to ), and the flow of the initial stock solution and of
five dilutions from it. The flow time values, employed to determine
intrinsic viscosities values employing Eqs. (1)–(3), corresponded
to the average of at least five time measurements with variation
lower than 0.09%. In the single-point determinations (Eqs. (3)–(5)),
the solution with lowest concentration was chosen (Delpech et al.,
2002a, 2002b).
3. Results and discussion
Fig. 1 presents the ratio between log Ásp and log c[Á] obtained
for chitosan samples C1 and C2, respectively, in the two media
studied, at 25 ◦ C, applying the intrinsic viscosity value provided
by Huggins’ equation. The parameter c[Á] (dimension with the
lowest coil overlap parameter, where c is the concentration) can be
defined as the total volume occupied by novel polymers, i.e., c[Á]
is the fraction, by volume, of the polymer present in the solution.
This parameter is independent of the polymer’s type and molar
mass. We observed a linear relation for all the samples analyzed,
indicating that all determinations were obtained in a Newtonian
regime, a range in which the viscosimetry data are valid (Mello
et al., 2006, 2005; Silva et al., 2013).
Table 1 reports the intrinsic viscosity values related to all the
equations and Table 2 shows the viscometric constants obtained
for the two chitosan samples (C1 and C2).
The values of kh for chitosan C1 in both media fit in the range
of good solvents. In counterpart, the values of kh for chitosan
C2 indicate stronger polymer–polymer interaction and weaker
polymer–solvent interaction. Unlike flexible polymers, polysaccharides have more rigid structures, so the values of kh are normally
higher (Wang & Xu, 1994). This difference in the Huggins’ constant
values can be explained by the structural differences between the
chitosan samples (C1 and C2). Chitosan C2 has a deacetylation
degree (DD) of 93% while the degreed of chitosan C1 is 85%.
Chitosan is a cationic electrolyte, and in an acidic solution the
charge density along the main chain increases with rising DD,
resulting in a more expanded conformation of the chain with a
smaller number of entanglements, making it stiffer. The movement
of the individual chains is restricted with the increase in the number of entanglements. As the polymer’s concentration increases,
the disentangled chains cannot form new entanglements due to
their lack of mobility. The reduction of viscosity in the presence
of NaCl can be explained by the fact that sodium acetate already
greatly diminishes the electrostatic repulsion (Brant, 2008).
The values found for the constant kk were negative for the
two chitosan samples, indicating there was good solubilization
of the polymer chains. However, the values of kh + kk for chitosan C2 tended to be higher than 0.5 for the two media studied,
248
C.N. Costa et al. / Carbohydrate Polymers 133 (2015) 245–250
Table 1
Intrinsic viscosity values for chitosan samples C1 and C2 in the systems CH3 COOH 0.3 mol/L/CH3 COONa 0.2 mol/L (medium 1) and CH3 COOH 0.1 mol/L/NaCl 0.2 mol/L (medium
2).
d (mol/L)
Medium
Intrinsic viscosity [Á] (mL/g)
Ha
Chitosan C1
1
2
Chitosan C2
1
2
a
b
c
d
Ka
SBa
SBb
SCc
DCc
0.2
0.2
44.97
20.53
44.69
21.16
46.23
21.58
45.26
21.99
44.85
21.80
46.44
22.46
0.2
0.2
101.29
34.84
131.31
40.34
157.56
46.62
140.31
42.89
146.37
43.76
161.71
47.46
H = Huggins; K = Kraemer; M = Martin; SB = Schulz–Blascke-calculated by graphical extrapolation.
SB = Schulz–Blascke (kSB = 0.28)-calculated by single-point determination.
SC = Solomon–Ciuta; DC = Deb–Chanterjee-calculated by single-point determination.
= Ionic force (Kassai, 2007).
Table 2
Viscometric constants calculated for chitosan samples C1 and C2 in the systems
CH3 COOH 0.3 mol/L/CH3 COONa 0.2 mol/L (medium 1) and CH3 COOH 0.1 mol/L/NaCl
0.2 mol/L (medium 2).
Medium
Viscometric constants
Chitosan C1
1
2
Chitosan C2
1
2
kh
kk
ksb
kh + kk
0.33
0.59
−0.15
−0.07
0.23
0.35
0.48
0.65
1.21
1.19
−0.08
−0.09
0.19
0.21
1.28
1.28
kh —Huggins’ constant; kk —Kraemer’s constant; kSB —Shulz–Blaschke constant.
providing evidence of poor solubilization and that the media used
did not have sufficiently high polarity to overcome the effects of
interaction among the chains of this polymer.
For single-point determination we used the equations of
Solomon–Ciuta (SC) and Deb–Chanterjee (DC) (Eqs. (4) and (5),
respectively). We also performed a test using Eq. (3), from
Shulz–Blasche (SB), in this case attributing the value of 0.28 to
the respective constant (kSB ) (Abdel-Azim et al., 1998; Delpech
& Oliveira, 2005; Delpech et al., 2002a, 2002b; Khan et al., 1983;
Schoff, 1999).
The SC and DC equations have been used based on the premise
that kh + kk = 0.5 (Abdel-Azim et al., 1998). However, as shown in
Table 2, in this work kh + kk varied from 0.2 to 1.28. Nevertheless,
the values found for [Á]SC were near those obtained by graphical
extrapolation ([Á]h , [Á]k and [Á]SB ) (Table 1).
Table 3 presents the percentage differences ( %) calculated
for the intrinsic viscosity values obtained from the equations of
Kraemer, Schulz–Blascke, Solomon–Ciuta and Deb–Chanterjee,
when compared with those produced by the equation of Huggins, i.e., how much these former values deviated from the base
value, chosen from Huggins’ equation, most often used for these
Table 3
Percentage differences ( %) obtained for the intrinsic viscosity values calculated
by graphical extrapolation: equations of Kraemer (K) and Schulz–Blaschke (SB);
and by single-point determination with the equations of Schulz–Blaschke (SB),
Solomon–Ciuta (SC) and Deb–Chanterjee (DC), employing as reference the intrinsic
viscosity of Huggins [Á]h .
Medium
Chitosan C1
1
2
Chitosan C2
1
2
Graphical extrapolation
Single-point determination
K
SB
SB
SC
DC
−0.62
3.07
2.80
5.11
0.64
7.11
−0.27
6.19
3.27
9.40
29.23
15.79
55.55
33.81
38.52
23.11
44.51
25.60
59.65
36.22
calculations (Abdel-Azim et al., 1998; Delpech et al., 2007, 2002a,
2002b; Delpech & Oliveira, 2005; Mello et al., 2006, 2005; Khan
et al., 1983; Schoff, 1999).
% = 100
[Á]
[Á]h
− 100
For the values obtained in medium 1 (CH3 COOH
0.3 mol/L/CH3 COONa 0.2 mol/L) and medium 2 (CH3 COOH
0.1 mol/L/NaCl 0.2 mol/L), comparison of the intrinsic viscosity values obtained from the equations of Schulz–Blascke (SB) and
Solomon–Ciuta (SC), employed in the single-point determination
method, showed a tendency to lower percentage differences in
relation to the values obtained from the Schulz–Blascke (SB)
equation by graphical extrapolation, although the employment of
the SB equation is connected to the value of a constant (kSB = 0.28).
It can be seen in Table 3 that the SB equation in general produced
the smallest deviations from the values obtained by extrapolation
with Huggins’ equation, producing a better result and making its
application more advisable for the systems studied, in both solvent
systems, a finding that also validates the use of the constant 0.28.
It is also important to observe that the sum kh + kk = 0.5 did not
occur for either of the samples analyzed (Table 3), principally for
chitosan C2. Nevertheless, both [Á]SC and [Á]DC presented values
near [Á]h , [Á]k and [Á]SB , which were obtained by graphical extrapolation, with the lowest percentage differences being for sample C1.
Therefore, the application of the SC and DC equations for this chitosan in the two solvents systems analyzed is not restricted to this
Table 4
Values of K and ˛ found in the literature for the solvent systems CH3 COOH
0.3 mol/L/CH3 COONa0.2 mol/L (medium 1) and CH3 COOH 0.1 mol/L/NaCl 0.2 mol/L
(medium 2) (Canella & Garcia, 2001; Campana-Filho et al., 2007; Kassai, 2007; Moura
et al., 2011; Mutalik et al., 2006; Qun & Ajun, 2006; Santos et al., 2003).
Solvent
K (mL/g)
˛
Medium 1
Medium 2
0.93
1.81 × 10⁻³
0.76
0.74
Temperature: 25 ◦ C.
Table 5
Mean viscometric molar mass for chitosan samples C1 and C2 in CH3 COOH
0.3 mol/L/CH3 COONa 0.2 mol/L (medium 1) and CH3 COOH 0.1 mol/L/NaCl 0.2 mol/L
(medium 2).
Medium
(mol/L)
pH
Molar mass (g/mol)
1
2
Chitosan C1
0.2
0.2
4.7
2.9
1.6 × 10²
3.0 × 10⁵
1
2
Chitosan C2
0.2
0.2
4.7
2.9
4.8 × 10²
6.1 × 10⁵
C.N. Costa et al. / Carbohydrate Polymers 133 (2015) 245–250
249
Table 6
Intrinsic viscosity of Huggins [Á]h and molar mass (expressed in g/mol) of chitosan obtained by viscometry.
Medium
[Áh ] (mL/g)
Mean viscometric molar mass (g/mol)
¯v
M
h
¯v
M
k
¯v
M
SB
¯v
M
SB
¯v
M
SC
¯v
M
DC
Chitosan C1
1
2
44.97
20.53
1.6 × 10²
3.0 × 10⁵
1.6 × 10²
3.1 × 10⁵
1.7 × 10²
3.2 × 10⁵
1.7 × 10²
3.3 × 10⁵
1.6 × 10²
3.2 × 10⁵
1.6 × 10²
3.4 × 10⁵
Chitosan C2
1
2
101.29
34.84
4.8 × 10²
6.1 × 10⁵
6.7 × 10²
7.5 × 10⁵
8.9 × 10²
9.3 × 10⁵
7.4 × 10²
8.2 × 10⁵
7.8 × 10²
8.3 × 10⁵
8.9 × 10²
9.3 × 10⁵
sum. However, all the percentage differences for chitosan C2 were
very high, suggesting that the viscosity and flow properties of the
solutions differ with the deacetylation degree (DD) of chitosan. The
deacetylation degree of chitosan is an important molecular structure parameter, because the viscometric constants in the equations
can change when the DD changes. The viscosity of chitosan C2, with
DD of 93%, is higher than that of chitosan C1, with DD of 85%.
The mean viscometric molar mass of chitosan samples C1 and
C2 in media 1 and 2 were calculated from the Mark–Houwink–
Sakurada equation (Eq. (6)). The values of the constants K and ˛
found in the literature for the solvents used here, at 25 ◦ C, are presented in Table 4 (Campana-Filho et al., 2007; Canella & Garcia,
2001; Kassai, 2007; Moura, Moura, Soares, & Pinto, 2011; Mutalik
et al., 2006; Qun & Ajun, 2006; Rinaudo & Domard, 1989; Rinaudo,
Milas, & Dung, 1993; Santos, Soares, Dockal, Campana Filho, &
Cavalheiro, 2003).
The mean viscometric molar mass values determined for chitosan samples C1 and C2 in media 1 and 2 are reported in Table 5.
The results found suggest that the two solvent systems have
different solubilization power. The mean molar masses are higher
for the solvent system CH3 COOH 0.1 mol/L/NaCl 0.2 mol/L (medium
2), suggesting stronger polymer–polymer interaction and weaker
polymer–solvent interaction in CH3 COOH 0.3 mol/L/CH3 COONa
0.2 mol/L (medium 1). The higher molar mass values in medium
2 suggest that the secondary forces between chitosan samples C1
and C2 and the molecules of this medium are strong. In other
words, it is a better solvent. This can be explained by the variation of pH, because the ionic forces of the two solvents are
equal. Comparison of the viscosity in function of pH (pH of 2.9
for CH3 COOH 0.1 mol/L/NaCl 0.2 mol/L and pH of 4.7 for CH3 COOH
0.3 mol/L/CH3 COONa 0.2 mol/L) shows that in increase in pH of the
medium reduces the polymer’s molar mass. Chitosan contains a primary amino group and two free hydroxyl groups for each C6 unit.
Due to the easy availability of free amino groups in chitosan, this
polymer is positively charged at acidic pH values. At low pH, these
amino groups are protonated and become positively charged, making chitosan a water-soluble cationic polyelectrolyte. The increase
in pH diminishes the cationic characteristic, leaving chitosan less
protonated and consequently with smaller hydrodynamic volume.
When the pH increases above 6, chitosan’s amino groups are deprotonated and the polymer loses its charge, becoming insoluble. The
soluble-insoluble transition occurs at pH values near the its pKa
value, around 6 or 6.5 (Dash, Chiellini, Ottenbrite, & Chiellini, 2011).
The number of positive charges ( NH3 + ) in chitosan will be higher
in a medium with lower pH, because the chains are more extended,
increasing the hydrodynamic volume and hence the molar mass.
Table 6 presents a comparison between the molecular weight
values for chitosan obtained by viscometry using the intrinsic viscosity values obtained from the equations of Huggins
(H), Kraemer (K) and Schulz–Blaschke (SB) and by single-point
determination employing the equations of Schulz–Blaschke (SB),
Solomon–Ciuta (SC) and Deb–Chanterjee (DC). The mean molar
masses are higher when using medium 2 (CH3 COOH 0.1 mol/L/NaCl
0.2 mol/L), suggesting stronger polymer–polymer interaction and
Table 7
Percentage differences ( %) obtained for viscometric molar mass values calculated
by graphical extrapolation: equations of Kraemer (K) and Schulz–Blaschke (SB); and
by single-point determination: equations of Schulz–Blaschke (SB), Solomon–Ciuta
(SC) and Deb–Chanterjee (DC), employing as reference the intrinsic viscosity of
¯ v ).
Huggins (M
h
Medium
Graphical extrapolation
Single-point determination
K
SB
SB
SC
DC
Chitosan C1
1
2
4.06
0.84
6.8
3.80
9.5
0.87
8.2
0.36
12.6
4.44
Chitosan C2
1
2
21.3
42.0
46.7
82.0
31.5
55.3
35.0
64.5
50.2
88.2
weaker polymer–solvent interaction in medium 1 (CH3 COOH
0.3 mol/L/CH3 COONa 0.2 mol/L).
The percentage differences ( %)obtained for the viscometricmolecular weights are presented in Table 7. These values were
¯ v determined by using Huggins’ equation as refercalculated with M
ence. A decreasing trend of the % values can be noted for chitosan
C1, for which the viscometric molar mass is lower. Among the
molar mass values obtained from a single point, the three equations
applied (SB, SC and DC) presented results are not very different from
those obtained by graphical extrapolation. The Schulz–Blaschke
equation (SB) by a single point again presented the lowest percentage differences, making that equation more suitable for rapid
determination in the systems analyzed.
4. Conclusion
The kh + kk values of medium 1 (acetic acid 0.3 mol/L and sodium
acetate 0.2 mol/L) were higher than 0.5 for the two samples studied,
providing evidence of poor solubilization of the samples and that
this solvent system does not have sufficiently high polarity to overcome the effects of the interaction among the polymer chains. The
results suggest stronger polymer–polymer interaction and weaker
polymer–solvent interaction in medium 1. In turn, the higher molar
mass values in medium 1 (acetic acid 0.3 mol/L and sodium acetate
0.2 mol/L) suggests that the secondary forces between chitosan
samples C1 and C2 and the molecules of this medium are strong,
meaning it is a better solvent. The results indicate that the viscosity
and flow properties of the solutions differ with the deacetylation
degree (DD) of chitosan.
For media 1 and 2 (acetic acid 0.3 mol/L/sodium acetate
0.2 mol/L and acetic acid 0.1 mol/L/sodium chloride 0.2 mol/L,
respectively), comparison of the values obtained from the
equations of Schulz–Blascke (SB), Solomon–Ciuta (SC) and
Deb–Chanterjee (DC), employed in the single-point determination
method, showed a tendency for lower percentage differences of
the intrinsic viscosity values obtained by the SB equation than
those obtained by graphical extrapolation, validating the use of the
250
C.N. Costa et al. / Carbohydrate Polymers 133 (2015) 245–250
constant 0.28 for both systems. The SC equation also presented
small percentage differences, so it is also suitable for the calculation.
Acknowledgments
We gratefully acknowledge CAPES for a scholarship to C.N. Costa
and FAPERJ (E-26/010.002630/2014) for financial support.
References
Abdel-Azim, A. A-A., Atta, A. M., Farahat, M. S., & Boutros, W. Y. (1998).
Determination of intrinsic viscosity of polymeric compounds through a single
specific viscosity measurement. Polymer, 39(26), 6827–6833.
Brant, A. J. C. (2008). Preparo e caracterizac¸ão de hidrogéis a partir de misturas de
soluc¸ões de quitosana e poli (N-vinil-2-pirrolidona). Brazil: Instituto de Química.
Universidade de São Paulo (Doctoral thesis in organic chemistry).
Campana-Filho, S. P., Brito, D., Curti, E., Abreu, F. R., Cardoso, M. B., Battisti, M. V.,
et al. (2007). Extrac¸ão, estruturas e propriedades de ␣ e -quitina. Química
Nova, 30, 644–650.
Canella, K. M. N. C., & Garcia, R. B. (2001). Caracterizac¸ão de quitosana por
cromatografia de permeac¸ão de gel–influência do método de preparac¸ão e do
solvente. Química Nova, 24, 13–17.
Chen, A. H., Liu, S. C., Chen, C. Y., & Chen, C. Y. (2008). Comparative adsorption of
Cu(II), Zn(II), and Pb(II) ions in aqueous solution on the crosslinked chitosan
with epichlorohydrin. Journal of Hazardous Materials, 154, 184–191.
Cho, J., Heuzey, M. C., Bégin, A., & Carreau, P. J. (2006). Viscoelastic properties of
chitosan solutions: Effect of concentration and ionic strength. Journal of food
Engineering, 74, 500–515.
Dash, M., Chiellini, F., Ottenbrite, R. M., & Chiellini, E. (2011). Chitosan—A versatile
semi-synthetic polymer in biomedical applications. Progress in Polymer Science,
36, 981–1014.
Deb, P. C., & Chatterjee, S. R. (1968). Unperturbed dimension of polymer molecules
from viscosity measurements. Die Makromolekulare Chemie, 120, 49–57.
Delpech, M. C., Coutinho, F. M. B., & Habibe, M. E. S. (2002). Viscometry study of
ethylene–cyclic olefin copolymers. Polymer Testing, 21, 411–415.
Delpech, M. C., Coutinho, F. M. B., & Garcia, M. E. F. (2002). Evaluation of gas
permeability of membranes obtained from poly(urethane-urea)s aqueous
dispersions based on hydroxyl-terminated polybutadiene. Polymer Testing, 21,
719–723.
Delpech, M. C., Coutinho, F. M. B., Souza, K. G. M., & Cruz, R. C. (2007). Estudo
viscosimétrico de pré polímeros uretânicos. Polímeros, 17, 294–298.
Delpech, M., & Oliveira, C. M. F. (2005). Viscometric study of poly(methyl
methacrylate-g-propylene oxide) and respective homopolymers. Polymer
Testing, 24, 381–386.
Desbrières, J., Martinez, C., & Rinaudo, M. (1996). Hydrophobic derivatives of
chitosan: Characterization and rheological behavior. International Journal of
Biological Macromolecules, 19, 21–28.
Huggins, M. L. (1942). The viscosity of dilute solutions of long-chain molecules. IV.
Dependence of concentration. Journal of the American Chemical Society, 64,
2716–2718.
Khan, H. U., Gupta, V. K., & Bhargava, G. S. (1983). Determination of intrinsic
viscosity of high polymers through a single specific viscosity measurement.
Polymer Communication Journal, 24, 191–193.
Kassai, M. R. (2007). Calculation of Mark–Houwink–Sakurada (MHS) equation
viscometric constants for chitosan in any solvent–temperature system using
experimental reported viscometric constants data. Carbohydrate Polymers, 68,
477–488.
Kraemer, E. O. (1938). Molecular weights of cellulose and cellulose derivatives.
Industrial and Engineering Chemistry, 30, 1200–1203.
´ M., & Mencer, H. J. (2005). A correlation of the limiting
Matusinovií, Z., Rogoˇsic,
viscosity number, molecular mass and composition of statistical linear
styrene–methyl methacrylate copolymers. European Polymer Journal, 41,
2934–2944.
Mello, I. L., Delpech, M. C., Fernanda, M. B., & Albino, F. F. M. (2005). Viscometric
study of high-cispolybutadiene in cyclohexane solution at 30 ◦ C. Polymer
Bulletin, 55, 115–122.
Mello, I. L., Delpech, M. C., Fernanda, M. B., & Albino, F. F. M. (2006). Viscometric
study of high-cispolybutadiene in toluene solution. Journal of the Brazilian
Chemical Society, 17(1), 194–199.
Moreira, J. C., Silva, I. F., Wang, S. H., & Balogh, D. T. (2004). Determinac¸ão das
Constantes K e ␣ da Equac¸ão de Mark-Houwink de poli(p-acetóxiestireno).
Polímeros: Ciência e Tecnologia, 14(2), 80–82.
Moura, C. M., Moura, J. M., Soares, N. M., & Pinto, L. A. A. (2011). Evaluation of molar
weight and deacetylation degree of chitosan during chitin deacetylation
reaction: Used to produce biofilm. Chemical Engineering and Processing, 50,
351–355.
Mutalik, V., Manjeshwar, L. S., Wali, A., Sairam, M., Raju, K. V. S. N., & Aminabhavi,
T. M. (2006). Thermodynamics/hydrodynamics of aqueous polymer solutions
and dynamic mechanical characterization of solid films of chitosan, sodium
alginate, guar gum, hydroxy ethyl cellulose and hydroxypropyl
methylcellulose at different temperatures. Carbohydrate Polymers, 65,
9–21.
Peniche, C., Arguelles-Monal, W., Peniche, H., & Acosta, N. (2003). Chitosan: An
attractive biocompatible polymer for microencapsulation. Macromolecular
Bioscience, 3, 511–520.
Qun, G., & Ajun, W. (2006). Effects of molecular weight, degree of acetylation and
ionic strength on surface tension of chitosan in dilute solution. Carbohydrate
Polymers, 64, 29–36.
Rinaudo, M., & Domard, A. (1989). Solution properties of chitosan. Chitin and
Chitosan. Applied Sciences, 71–79.
Rinaudo, M., Milas, M., & Dung, P. L. (1993). Characterization of chitosan. Influence
of ionic strength and degree of acetylation on chain expansion. International
Journal of Biological Macromolecules, 15, 281–285.
Rinaudo, M. (2006). Chitin and chitosan: Properties and applications. Progress in
Polymer Science, 31, 603–632.
Robinson, J. P., Holladay, L. A., Hash, J. H., & Puettl, D. (1982). Conformational and
molecular weight studies of tetanus toxin and its major peptides. Journal of
Biological Chemistry, 257, 407–411.
Santos, J. E., Soares, J. P., Dockal, E. R., Campana Filho, S. P., & Cavalheiro, E. T. G.
(2003). Caracterizac¸ão de quitosanas comerciais de diferentes origens.
Polímeros: Ciência e Tecnologia, 13(4), 242–249.
Schoff, C. K. (1999). Concentration dependence of the viscosity of dilute polymer
solutions: Huggins and Schultz–Blaschke constants. In J. Brandrup, E. H.
Immergut, & E. A. Grulke (Eds.), Polymer handbook. New York:
Wiley-Interscience, pp. VII/265–289.
Schulz, G. V., & Blaschke, F. (1941). Eine Gleichung zur Berechnung der
Viscositätszahl für sehr kleine Konzentrationen,
Molekulargewichtsbestimmungen an makromolekularen Stoffen, IX. Journal
für Praktische Chemie, 158, 130–135.
Silva, G. M., Mello, I. L., Delpech, M. C., & Costa, M. A. S. (2013). Estudo
viscosimétrico de copolímeros à base de 1,3-butadieno e 1-octeno em tolueno
e hexano. Polímeros, 23, 758–763.
Simionescu, C. I., Loan, S., & Simionescu, B. C. (1987). Solution properties of
ultra-high molecular weight polymers—13. Viscosity–molecular weight
relationships and unperturbed dimensions of poly(butyl methacrylate) in
various solvents. European Polymer Journal, 23(1), 69–72.
Solomon, O. F., & Ciutˇa, I. Z. (1962). Détermination de la viscosité intrinsèque de
solutions de polymères par une simple détermination de la viscosité. Journal of
Applied Polymer Science, 6, 683–686.
Wang, W., & Xu, D. (1994). Viscosity and flow properties of concentrated solutions
of chitosan with different degrees of deacetylation. International Journal
Biology Macromolecules, 16, 149–152.
Yomota, C., Miyazaki, T., & Okada, S. (1993). Determination of the viscometric
constants for chitosan and the application of universal calibration procedure in
its gel permeation chromatography. Colloid and Polymer Science, 271, 76–82.