Response surface methodology applied to the study of the microwave-assisted synthesis of quaternized chitosan
Bạn đang xem bản rút gọn của tài liệu. Xem và tải ngay bản đầy đủ của tài liệu tại đây (1.9 MB, 10 trang )
Carbohydrate Polymers 138 (2016) 317–326
Contents lists available at ScienceDirect
Carbohydrate Polymers
journal homepage: www.elsevier.com/locate/carbpol
Response surface methodology applied to the study of the
microwave-assisted synthesis of quaternized chitosan
Danilo Martins dos Santos, Andrea de Lacerda Bukzem, Sérgio Paulo Campana-Filho ∗
Instituto de Química de São Carlos/Universidade de São Paulo, Av. Trabalhador são-carlense, 400-13566-590, São Carlos/SP, Brazil
a r t i c l e
i n f o
Article history:
Received 22 July 2015
Received in revised form 4 November 2015
Accepted 24 November 2015
Available online 2 December 2015
Keywords:
Chitosan derivatives
Quaternization
Microwave irradiation
Response surface methodology
a b s t r a c t
A quaternized derivative of chitosan, namely N-(2-hydroxy)-propyl-3-trimethylammonium chitosan
chloride (QCh), was synthesized by reacting glycidyltrimethylammonium chloride (GTMAC) and chitosan
(Ch) in acid medium under microwave irradiation. Full-factorial 23 central composite design and response
surface methodology (RSM) were applied to evaluate the effects of molar ratio GTMAC/Ch, reaction time
and temperature on the reaction yield, average degree of quaternization (DQ ) and intrinsic viscosity ([Á])
of QCh. The molar ratio GTMAC/Ch was the most important factor affecting the response variables and
RSM results showed that highly substituted QCh (DQ = 71.1%) was produced at high yield (164%) when
the reaction was carried out for 30 min. at 85 ◦ C by using molar ratio GTMAC/Ch 6/1. Results showed that
microwave-assisted synthesis is much faster (≤30 min.) as compared to conventional reaction procedures
(>4 h) carried out in similar conditions except for the use of microwave irradiation.
© 2015 Elsevier Ltd. All rights reserved.
1. Introduction
Chitosan is a (1 → 4)-linked copolymer of 2-amino-2-deoxy-Dglucopyranose (GlcN) and 2-acetamido-2-deoxy-D-glucopyranose
(GlcNAc) found as a component of the cell wall of some fungi,
however it is generally prepared through the deacetylation of
chitin, an abundant polysaccharide present in the exoskeletons
of crustaceans, mollusks and insects (Peniche, Argüelles-Monal,
& Goycoolea, 2008; Rinaudo, 2006). Due its nontoxic nature and
for being biocompatible and biodegradable, a range of applications has been reported for chitosan, including in wound dressing
(Mogos¸anu & Grumezescu, 2014), tissue engineering (Muzzarelli,
2009) and drug delivery (Sanyakamdhorn, Agudelo, & Tajmir-Riahi,
2013). Nevertheless, the application of chitosan is often limited by
its poor solubility in water at neutral and alkaline pH. Thus, several
strategies have been adopted for carrying out controlled chemical
modifications on chitosan aiming to improve its water solubility
and to expand its range of applications.
In this sense, N-(2-hydroxy)-propyl-3-trimethylammonium
chitosan chloride (QCh), a polycationic derivative of chitosan, is a
very interesting alternative as it is soluble in a wider range of pH and
it displays improved properties, including antimicrobial activity
∗ Corresponding author. Tel.: +55 16 33739929; fax: +55 16 33739952.
E-mail addresses: danilomartins (D.M.d. Santos),
andrea (A.d.L. Bukzem),
(S.P. Campana-Filho).
/>0144-8617/© 2015 Elsevier Ltd. All rights reserved.
(Rabea, Badawy, Stevens, Smagghe, & Steurbaut, 2003), mucoadhesivity (Sonia & Sharma, 2011), higroscopicity and moisture
retention (Prado & Matulewicz, 2014), as compared to chitosan.
The synthesis of QCh is usually carried out by reacting chitosan
with glycidyltrimethylammonium chloride (GTMAC) in alkaline,
neutral or acid medium at relatively high temperature (>70 ◦ C)
for long reaction time (4–18 h) (Cho, Grant, Piquette-Miller, &
Allen, 2006; Ruihua, Bingchao, Zheng, & Wang, 2012; Wu, Su,
& Ma, 2006; Xiao et al., 2012). However, when the synthesis is carried out in neutral or alkaline medium, O-substitution
occurs to an appreciable extent (Prado & Matulewicz, 2014;
Ruihua et al., 2012). Additionally, the hydrolysis of GTMAC to 2,3dihydroxypropyltrimethylammonium chloride is favored in such
reaction media, negatively affecting the reaction yield. In contrast,
when such a synthesis is carried out in acid medium, highly substituted QCh samples are produced and N-substitution predominates,
preventing the formation of undesirable products as compared to
procedures carried out in neutral and alkaline media (Cho et al.,
2006; Prado & Matulewicz, 2014; Ruihua et al., 2012).
Numerous reports have shown that microwave heating has a
high potential to accelerate chemical reactions, to increase reaction
yield and to enhance product’s purity and material’s properties as compared to conventional experiments in which heating
by convection or conduction is used (Caddick & Fitzmaurice,
2009; Gawande, Shelke, Zboril, & Varma, 2014; Moseley & Kappe,
2011; Nuchter, Ondruschka, Bonrath, & Gum, 2004; Zhu & Chen,
2014). The microwave heating involves two main mechanisms,
namely dipolar polarization and ionic conduction, and it presents
318
D.M.d. Santos et al. / Carbohydrate Polymers 138 (2016) 317–326
advantages such as rapid heat transfer, volumetric and selective
heating. Thus, microwave heating has been used in chemical functionalization of polysaccharides, including chitosan (Ge & Luo,
2005; Liu, Wang, Yang, & Sun, 2012; Petit, Reynaud, & Desbrieres,
2015; Singh, Tiwari, Tripathi, & Sanghi, 2006) and cellulose (Biswas,
Kim, Selling, & Cheng, 2014; dos Santos, Bukzem, Ascheri, Signini,
& de Aquino, 2015). Petit et al. (2015) investigated the preparation
of amphiphilic derivatives of chitosan by using microwave irradiation and they found that it is possible to obtain modified chitosan
at lower reaction time as compared to conventional procedures
and without any degradation of the polymer chain. Singh et al.
(2006) described the synthesis of chitosan-g-polyacrylamide by
using microwave irradiation and they reported that higher reaction
yield was achieved in rather shorter time as compared to the reaction carried out under conventional heating. The recent literature
also reports on the use of microwave heating in polycondensation
reactions (Komorowska-Durka, Dimitrakis, Bogdał, Stankiewicz, &
Stefanidis, 2015), ring-opening polymerizations (Hoogenboom &
Schubert, 2006) as well as in radical polymerizations (Sugihara,
Semsarilar, Perrier, & Zetterlund, 2012).
Response surface methodology (RSM) is a set of statistical and
mathematical techniques effective for developing, improving, and
optimizing processes that involves a response of interest that is
influenced by several independent variables (Myers, Montgomery,
& Anderson-Cook, 2009). RSM is based on the fit of a polynomial
equation to the experimental data that describes the relationship
between a dependent variable, or response, and the independent
variables as well as the interactions among these latter. Simultaneously, this technique allows to optimize the levels of the
independent variables to attain the best possible response in a
faster and more economical manner when compared to classic onevariable-at-a-time approach (Bezerra, Santelli, Oliveira, Villar, &
Escaleira, 2008; Myers et al., 2009). The synthesis of QCh involves
reactional parameters such as molar ratio chitosan/GTMAC, reaction time and temperature that influence a series of responses
related to the important properties of this chitosan derivative as
its degree of quaternization and intrinsic viscosity as well as the
reaction yield (Cho et al., 2006; Prado & Matulewicz, 2014; Ruihua
et al., 2012). In this context, the RSM can be considered a useful
tool to evaluate how the independent variables related to the reaction conditions used to synthesize QCh, as well as the interactions
among them, affect the properties of this chitosan derivative.
Aiming to provide new insights for the preparation of N-(2hydroxy)-propyl-3-trimethylammonium chitosan chloride (QCh),
this study focus on the preparation of QCh samples in acid medium
under microwave irradiation by using full-factorial 23 central
composite design and response surface methodology (RSM) to
evaluate the effects of molar ratio GTMAC/Ch, reaction time and
temperature on the reaction yield, average degree of quaternization (DQ ) and intrinsic viscosity ([Á]) of QCh. The parent chitosan
as well as the resulting derivatives are characterized by Fourier
transform infrared (FTIR) and 1 H NMR spectroscopy, capillary viscometry, thermogravimetric analysis (TGA), X-ray diffraction and
with respect to water-solubility as a function of pH.
with ethanol/water mixtures of increasing ethanol content (70%,
80%, and 90%). The purified chitosan was dried at 30 ◦ C and named
as sample Ch. Glycidyltrimethylammonium chloride (GTMAC) was
acquired from Sigma-Aldrich (Saint Louis, MO; USA) and its was
used as received as well as other reactants and solvents employed
in this study.
2.2. Synthesis of N-(2-hydroxy)-propyl-3-trimethylammonium
chitosan chloride
Purified chitosan (0.5 g) was suspended in 30 mL of deionized
water and 150 L of glacial acetic acid were added to the suspension which was kept at constant stirring at room temperature for
10 min. An aqueous solution of GTMAC was added dropwise to
the chitosan suspension which was then submitted to microwave
irradiation at a power of 200 W in a monomode microwave reactor (Discover-LabMate, CEM, USA) under constant stirring at the
desired temperature and during a given time. Following, excess
acetone was added to the reaction medium to result in the precipitation of the product which was filtered, thoroughly washed with
acetone and dried at 35 ◦ C for 24 h. The reaction yield was calculated based on the weights of the parent chitosan and the resulting
product.
2.3. Experimental design
A full-factorial 23 central composite design was used to analyze
the main effects and interactions of the reaction variables, namely
molar ratio GTMAC/Chitosan, reaction time and temperature, on
the average quaternization degree (DQ ) and intrinsic viscosity of
QCh and on the reaction yield of the microwave-assisted synthesis
of QCh. The choice of the parameters and their levels was based
on our own previous experimental studies. Thus, 11 independent
runs of experiments were carried out in duplicate, including 23
orthogonal factorial and six replicate at the center point. The independent variables and their levels are shown in Table 1. All the
experiments were carried out at random, in order to minimize the
effect of unexplained variability in the observed responses due to
systematic errors.
Also, to compare the microwave-assisted synthesis of QCh to
reaction performed by using conventional heating, two additional
runs were carried out using the same reaction conditions as used
to produce samples QCh1 (X1 = 4/1; X2 = 20 min.; X3 = 75 ◦ C) and
QCh8 (X1 = 6/1; X2 = 30 min. and X3 = 85 ◦ C) except for the use of
microwave irradiation, resulting in samples QCh1-CH and QCh8CH, respectively. Such reactions were carried out in a 100 mL
one-necked round bottom flask immersed in a preheated oil bath
at the given temperature for the desired time.
2.4. Characterization
2.4.1. 1 H NMR spectroscopy
The 1 H NMR spectra of the parent chitosan and its derivatives
were acquired at 85 ◦ C by using an spectrometer Agilent 400/54
Premium Shielded 9.4 T, operating at 399.8 MHz for 1 H. For these
analyses, the samples were dissolved in HCl/D2 O 1% (v/v) at a
2. Materials and methods
2.1. Materials
Commercial chitosan (Cheng Yue Planting Co Ltd., China)
was dissolved in 1% aqueous acetic acid solution to result in
Cp = 3 g/L, the resulting solution was filtered through 0.45 m
membrane (Millipore® ), and then it was neutralized by addition
of 1 mol L−1 NaOH solution to provoke the precipitation of chitosan. The solid was thoroughly washed with distilled water and
Table 1
Uncoded and coded levels of the independent variables related to the synthesis of
N-(2-hydroxy)-propyl-3-trimethylammonium chitosan chloride.
Independent variables
Symbol
GTMAC/Chitosan
Time (min)
Temperature (◦ C)
X1
X2
X3
Levels
−1
0
1
4
20
75
5
25
80
6
30
85
D.M.d. Santos et al. / Carbohydrate Polymers 138 (2016) 317–326
concentration of 10 mg/mL. The average degree of deacetylation
(DD) and average degree of quaternization (DQ ) were calculated
by treating the 1 H NMR spectra according to Eq. (1) (Hirai, Odani,
& Nakajima, 1991) and Eq. (2) (Desbrières, Martinez, & Rinaudo,
1996), respectively.
ICH3 /3
DD (%) =
1−
DQ (%) =
IH1
IH1 + IH1
IH2-H6 /6
× 100
(1)
× 100
(2)
where, ICH3 is the integral of the signal due to the methyl hydrogens
of GlcNAc units (≈2.0 ppm), IH2–H6 is the integral corresponding to
the hydrogens H3–H6 from GlcN unit and the hydrogen bonded to
C2 of GlcNAc unit (≈3.3–4.0 ppm), IH1 is the integral of the signal
due to the anomeric hydrogen bonded to N-substituted GlcN units
(≈5.0 ppm) while IH1 is the integral of the signal due to the anomeric
hydrogen bonded to unsubstituted GlcN units (≈4.8 ppm).
2.4.2. Conductometric titration
The average degree of quaternization (DQ ) of quaternized chitosan was also determined by dosing the counter-ions Cl− ions
through titration with standardized 0.017 mol L−1 aqueous AgNO3
solution (Cho et al., 2006). Thus, QCh (0.1 g) was dissolved in
deionized water (100 mL) and the conductivity of the solution was
measured at 25 ± 0.01 ◦ C as a function of the added volume of
aqueous AgNO3 by using a Handylab LF1 conductivimeter (SchottGeräte). The value of DQ of QCh was calculated from the titration
curves according to Eq. (3).
DQ (%)
=
1.7 × 10⁻⁵ VAgNO3
W (g) −
×100
−5
1.7 × 10
VAgNO3 xMCGTMA
/ MG xDD
+ MAG
1 − DD
× DD
(3)
where, VAgNO3 (mL) is the volume of AgNO3 solution added to reach
the equivalence point; W (g) is the dry weight of the QCh sample;
MGTMAC , MG and MAG are the molar masses (g mol−1 ) of GTMAC,
GlcN and GlcNAc units, respectively; DD is the average degree of
deacetylation.
2.4.3. Fourier transform infrared (FTIR) spectroscopy
Infrared spectra were recorded by using a BOMEM MB102 FTIR
spectrophotometer. Samples were finely ground, mixed with KBr
and the mixture was then compressed into pellet form. The FTIR
spectra were acquired at 400–4000 cm−1 at resolution of 4 cm−1
by accumulating 32 scans.
2.4.4. Capillary viscometry
The intrinsic viscosities [Á] of the parent chitosan and its derivatives were determined in 0.3 mol L−1 acetic acid/0.2 mol L−1 sodium
acetate buffer (pH = 4.5). Thus, the solution of chitosan (or QCh) was
prepared by dissolving 50 mg (or 90 mg) in 50 mL of buffer solution,
followed by filtration through 0.45 m membrane (Millipore® ). A
glass capillary ( = 0.53 mm) containing 15 mL of the polymer solution was immersed in a water bath maintained at 25.00 ± 0.01 ◦ C.
The viscosity measurements were carried out by using an AVS350 (Schott-Geräte, Germany) viscometer coupled to the AVS-20
automatic burette (Schott-Geräte, Germany) for serial dilution of
polymers solutions with buffer solution. The relative viscosity (Árel )
of the polymer solutions were in the range 1.2 < Árel < 2.0 and the
intrinsic viscosity, [Á], was determined from curves of reduced viscosity (Ásp /C) versus polymer concentration (C) at infinite dilution.
319
2.4.5. X-ray diffraction
XRD patterns were acquired at room temperature by using a
Bruker AXS D8 Advance X-ray diffractometer equipped with CuK␣
˚ in the scattering range 5 < 2Â < 40◦ at scan
radiation ( = 1.5406 A)
◦
rate 5 /min. The operating voltage was 40 kV, and the current was
40 mA. The crystallinity index (CrI) was calculated following the
amorphous subtraction method proposed by Osorio-Madrazo et al.
(2010) by using Eq. (4):
CrI =
Acrist
Atotal
× 100%
(4)
where, Acrist expresses the crystalline contribution area obtained by
subtracting the amorphous contribution from the total area (Atotal )
of the diffractogram.
The amorphous contribution was estimated directly from
diffractogram using X’pert high score Plus software (2015).
2.4.6. Thermogravimetric analysis (TGA)
The thermal stability of the parent chitosan and its derivatives
was studied by carrying out TGA measurements using a Shimadzu
TGA 50 equipment. Thus, the sample (≈8 mg) was heated from
room temperature to 700 ◦ C at a heating rate of 10 ◦ C min−1 under
nitrogen atmosphere (flow = 50 mL min−1 ), the weight loss being
measured as a function of temperature.
2.4.7. Water solubility
The solubility of the parent chitosan and its derivatives in aqueous medium as a function of pH (2 < pH < 12) was estimated from
the measurement of the solutions transmittance. Thus, the sample
was dissolved in 0.1 mol L−1 HCl to result in Cp = 1 g/L, an aliquot of
the solution was poured into a quartz cell (l = 1 cm) and its transmittance was recorded on a UV/vis spectrophotometer (Shimadzu, UV
3600) at = 600 nm. The pH of the polymer solution was adjusted
by the dropwise addition of a 0.1 mol L−1 NaOH solution. A given
sample was considered to be insoluble when the transmittance of
its solution was lower than 50% as compared to that of a control
solution (aqueous 0.1 mol L−1 HCl).
2.5. Statistical analysis
The statistical treatment of the experimental data consisted
in fitting a polynomial function to the set of experimental data
collected from full-factorial 23 central composite design. Multiple
regression analysis was used to fit Eq. (5) to the experimental data
by means of the least squares method.
Y = ˇ0 + ˇ1 X1 + ˇ2 X2 + ˇ3 X3 + ˇ12 X1 X2 ˇ13 + X1 X3
+ ˇ23 X2 X3 + ˇ4 X12 + ε
(5)
where, Y represents the predicted response, ˇ0 , is the model intercept, ˇ1 , ˇ2 , ˇ3 are the coefficients of the linear terms; ˇ12 , ˇ13
and ˇ23 are the interaction coefficients; ˇ4 is the coefficient of the
quadratic term; X1 , X2 and X3 are the independent variables and ε
corresponds to the model residue.
The statistical significance of each individual coefficient term
was determined by evaluating the p-value and F-value with 95%
confidence level obtained from the analysis of variance (ANOVA).
The lack of fit of regression model was evaluated with 95% confidence level. The extent of fitting of the experimental results to
the polynomial model equation was expressed by the coefficient
of determination (R2 ) and adjusted coefficient of determination
(R2 adj ). Response surface plots were obtained by using the fitted
model and by keeping one independent variable constant at zero
level while varying the remaining two variables. All calculations
and graphs were obtained by the Statistica software (Statsoft version 7.0, USA).
320
D.M.d. Santos et al. / Carbohydrate Polymers 138 (2016) 317–326
3. Results and discussion
3.1. Spectroscopic characterization of chitosan and QCh
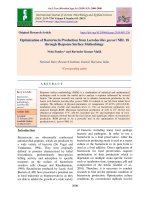
(d) QCh8-CH
Transmittance (%)
1030
1157
1080
1652
1600
1483
2887
3440
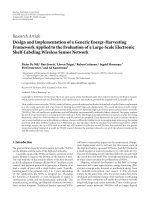
The infrared spectrum of chitosan (Fig. 1a) exhibited a characteristic intense and broad band centered at 3440 cm−1 due to the
axial stretching of O H group, which appears superimposed to the
N H stretching band; a weak band at 2877 cm−1 (C H stretch); the
bands at 1642, 1600, 1377 and 1258 cm−1 due to the C O stretching, N H bending and NHCO stretching of the amide and C–N
stretching, respectively; the bands at 1157, 1080 and 1030 cm−1
attributed to the stretching of C O of GlcN units (Brugnerotto
et al., 2001). The same main bands are also observed in the spectra of QCh samples produced by using microwave heating (Fig. 1b
and c) and conventional heating (Fig. 1d, and e), however a new
band is observed at 1483 cm−1 , which is attributed to the C H
bending of + N(CH3 )3 group (Cho et al., 2006). Additionally, the
band corresponding to the primary amine observed at 1600 cm−1
in the spectrum of chitosan is less intense in the spectra of QCh
samples and it is shifted to lower wavenumber while that band
observed at 1652 cm−1 is more intense in the spectra of QCh samples. Such a comparison confirms that the primary amine group
of GlcN units of chitosan has been modified to secondary amine
group as a consequence of the reaction with GTMAC (Xiao et al.,
2012). In contrast, the characteristic bands observed in the range
1157 cm−1 –1030 cm−1 , were not changed, indicating that the reaction has not occurred at the hydroxyl groups bonded to C3 and C6,
in agreement with the literature (Huang et al., 2014). Thus, such
an analysis highlights the structural changes due to the reaction of
chitosan with GTMAC and it indicates the predominant occurrence
of N-substitution.
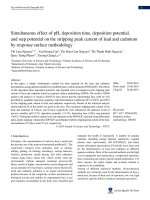
The structural modifications resulting from the reaction of chitosan with GTMAC can also be evidenced by comparing the 1 H
NMR spectra of chitosan (Fig. 2a) and quaternized derivatives QCh8
(Fig. 2a) and QCh1-CH (Fig. 2c). The 1 H NMR spectrum of chitosan
exhibited a singlet at 2.0 ppm characteristic of methyl hydrogens
of GlcNAc units, a signal at 3.15 ppm related to the hydrogen
bonded to C2 of GlcN units, the set of signals in the range of
3.3–4.0 ppm corresponding to the hydrogens H3–H6 from GlcN unit
and the hydrogen bonded to C2 of GlcNAc unit, while that signal
(d) QCh1-CH
(c) QCh8
(b) QCh1
(a) Chitosan
4000
3500
3000
2500
2000
1500
1000
500
-1
Wavenumber (cm )
Fig. 1. Infrared spectra of chitosan (a) and quaternized derivatives QCh1 (b), QCh8
(c) QCh1-CH (d) and QCh8-CH (e).
occurring at 4.80 ppm is attributed to the hydrogen (H1) bonded to
the anomeric carbon (C1). The average degree of deacetylation of
chitosan was calculated from its 1 H NMR spectrum by using Eq. (1)
and resulted in DD = 95%. The 1 H NMR spectra of the samples QCh8
and QCh1-CH show additional signals at 3.2 ppm and 3.31 ppm corresponding to the methyl hydrogens of N+ (CH3 )3 and methylene
hydrogens of NHCH2 , respectively, which are due to the introduction of the substituent on the chitosan chains. In addition, the
signal of the hydrogen bonded to the C2 carbon of the GlcN unit
shifted from 3.15 ppm to 3.10 ppm upon the chemical modification
of chitosan. The signals at 4.8 ppm and 5.0 ppm are attributed to
the hydrogen bonded to the anomeric carbon of unsubstituted and
substituted GlcN units, respectively (Desbrières et al., 1996). The
average degree of quaternization (DQ ) of samples QCh8 and QCh1CH was calculated from the corresponding 1 H NMR spectra by using
Eq. 2 and resulted in DQ = 71.1% and DQ = 15.3%, respectively.
Indeed, the average degree of quaternization of all QCh samples
were also determined from conductometric titration (Eq. (3)), the
resulting values of DQ showing a good agreement (>93%) with those
determined from the 1 H NMR spectra (Table 2).
3.2. Statistical analysis and model fitting
Table 2 shows the coded (in parenthesis) and the uncoded
values of the independent variables molar ratio GTMAC/chitosan,
reaction time and temperature and the experimental values of
the response variables DQ and intrinsic viscosity of QCh samples
as well as reaction yield. The responses ranged as 47% < DQ <
71%, 230 mL g−1 < [Á] < 290 mL g−1 and 120% reaction yield <164%,
clearly showing that the reaction conditions strongly affect the
characteristics of the resulting QCh and the reaction yield.
To describe the relationship between dependent and independent variables, Eq. (5) was fitted to the experimental data by
multiple regression analysis and the fitting of the model was evaluated by means of ANOVA tests, showing the terms which were
statistically significant for a confidence level of 95% (p-value < 0.05),
and those which were not statistically significant (Table 3). The
F-test and p-value were used to measure the significance of the
coefficients of the model and the corresponding terms are more
significant if the absolute F-value becomes greater and the p-value
becomes smaller. Accordingly, the values expressed in Table 3
indicate that the independent variables which exert the strongest
effects on DQ and intrinsic viscosity of QCh were the linear terms
molar ratio GTMAC/chitosan (X1 ), reaction time (X2 ) and temperature (X3 ) followed by the quadratic term GTMAC/chitosan
(X1 2 ). The data in Table 3 also show that DQ and intrinsic viscosity were not significantly affected by the interaction terms
X1 .X3 , X1 .X2 and X2 .X3 as in these cases p > 0.05. In the case of the
reaction yield, the linear term molar ratio GTMAC/chitosan (X1 )
was the most important parameter, followed by the linear terms
reaction time (X2) and temperature (X3). Besides, the interaction
term between time and temperature (X2 .X3 ) and the quadratic
term of ratio molar GTMAC/chitosan (X1 2 ) were also significant
(p < 0.05).
The ANOVA showed that the lack of fit was not significant
at 95% confidence level (p-value > 0.05), meaning that the models represented the data satisfactorily. In addition, the factors R2
and adjusted R2 were calculated to check the model adequacy.
Indeed, such an analysis show the close agreement between the
experimental results and the theoretical values predicted by these
models as high values of R2 (>0.97) and R2 adj. (>0.90) were observed
for DQ , intrinsic viscosity and reaction yield (Table 3), confirming
that the fitted models can satisfactorily explain the total variability of the responses within the range of independent variable
studied.
D.M.d. Santos et al. / Carbohydrate Polymers 138 (2016) 317–326
Fig. 2.
1
321
H NMR spectra of chitosan (a) QCh8 (b) and QCh1-CH (c) in solution D2 O/HCl 1% (v/v) acquired at 85 ◦ C.
The fitted models for DQ , intrinsic viscosity and yield without insignificants terms and in uncoded form are given in
Eqs. (6)–(8).
DQ (%) = 36.1 − 18.0X1 + 2.6X1 2 + 0.3X2 + 0.5X3
(6)
[Á] = 258 + 67.75X1 − 8.125X1 2 − 0.875X2 + 0.125X3
(7)
Yield (%) = 310 + 32.9167X1 − 4.6667X1 2 − 8.90X2
+ 3.80X3 − 0.10X2 X3
(8)
322
D.M.d. Santos et al. / Carbohydrate Polymers 138 (2016) 317–326
Table 2
Independent variables and experimental values of the response variables for the central composite design related to the synthesis of N-(2-hydroxy)-propyl-3trimethylammonium chitosan chloride.
Run
1
2
3
4
5
6
7
8
9
10
11
Response variablesa
Independent variables
GTMAC/Chitosan (mmol/mmol)
Time (min)
Temperature (◦ C)
DQ
4 (−1)
4 (−1)
4 (−1)
4 (−1)
6 (+1)
6 (+1)
6 (+1)
6 (+1)
5 (0)
5 (0)
5 (0)
20 (−1)
20 (−1)
30 (+1)
30 (+1)
20 (−1)
20 (−1)
30 (+1)
30 (+1)
25 (0)
25 (0)
25 (0)
75 (−1)
85 (+1)
75 (−1)
85 (+1)
75 (-1)
85 (+1)
75 (−1)
85 (+1)
80 (0)
80 (0)
80 (0)
47.3
51.7
53.7
57.6
60.5
63.5
67.2
71.1
56.3
56.7
56.8
b
(%)
DQ
±
±
±
±
±
±
±
±
±
±
±
46.5
52.0
53.3
58.4
60.3
62.4
65.1
69.9
53.3
52.8
53.0
0.4
0.3
0.2
0.1
0.6
0.4
0.8
0.8
0.4
0.2
0.3
c
(%)
[Á] (mL g−1 )
±
±
±
±
±
±
±
±
±
±
±
288
277
268
262
258
252
246
233
267
267
270
1.6
0.9
0.3
0.2
1.5
0.5
0.4
0.4
0.2
0.4
0.2
±
±
±
±
±
±
±
±
±
±
±
3
2
3
2
4
3
1
4
3
1
1
Yield (%)
133
125
141
135
150
137
159
164
146
149
148
±
±
±
±
±
±
±
±
±
±
±
4
3
7
4
4
2
3
3
5
4
6
MeanValues ± SD.
DQ determined by 1 H NMR.
c
DQ determined by conductometric titration.
[Á] = intrinsic viscosity in 0.3 mol L−1 acetic acid/0.2 mol L−1 sodium acetate buffer (pH = 4.5) at 25 ◦ C.
a
b
Table 3
Analysis of variance (ANOVA) concerning the variable responses degree of quaternization (DQ ), intrinsic viscosity ([Á]) and reaction yield related to the synthesis of N-(2hydroxy)-propyl-3-trimethylammonium chitosan chloride.
Sourcea
X1
X1 2
X2
X3
X1 .X2
X1 .X3
X2. X3
Lack of fit
R2
R2 adj.
*
a
b
c
d
DQ *
[Á]
Reaction yield
F
p-value
F
p-value
F
p-value
5991.78
255.04
1565.26
474.74
8.22
5.26
0.33
8.22
0.000b
0.004b
0.001b
0.002b
0.103d
0.149d
0.624d
0.103d
477.04
48.01
176.04
51.04
1.04
0.042
0.042
7.042
0.002b
0.020c
0.006b
0.019c
0.415d
0.857d
0.857d
0.118d
309.429
20.364
156.214
25.929
17.357
1.929
21.429
13.714
0.003b
0.046c
0.006b
0.036c
0.053d
0.299d
0.044c
0.066d
0.9987
0.9959
0.9881
0.9605
0.9724
0.9078
DQ determined by 1 H NMR.
X1 = molar ratio GTMAC/chitosan; X2 = Time (min); X3 = Temperature (◦ C).
Significant at 1% probability (p < 0.01).
Significant at 5% probability (p < 0.05).
Non-significant.
Table 4
Characteristic temperatures and corresponding weight losses related to the thermal degradation of chitosan and samples QCh1, QCh8, QCh1-CH and QCh8-CH.
Sample
Chitosan
QCh 1
QCh 8
QCh1-CH
QCh8-CH
a
b
c
Stage I
Stage II
Range
TMax (◦ C)a
WL (%)b
Range
Tonset (◦ C)c
WL (%)
25–150
25–150
25–150
25–150
25–150
70
60
60
63
60
7
10
11
7
9
220–420
190–390
190–390
190–390
190–390
278
248
246
253
250
42
48
52
44
46
TMax = Temperature of maximum weight loss.
WL = Weight loss.
Tonset = Onset temperature.
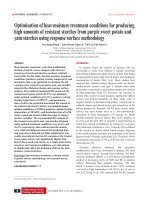
Such equations were used to generate three-dimensional surfaces by fixing one independent variable at the zero level while
the others are varied within the range of study to further
analyze the effects of independent variables on the responses
(Fig. 3). The response surface plots show that DQ increases as
molar ratio GTMAC/Chitosan, reaction time and temperature are
increased (Fig. 3(a–c)). Such positive effects of the independent variables on DQ can be rationalized as a consequence of
the higher excess of GTMAC and longer reaction times, both
of them favoring a more complete N-substitution on the chitosan chains. In addition, increasing the reaction temperature has
a positive effect on DQ as more reactive species have enough
energy to overcome the barrier corresponding to the activation
energy, resulting in faster and more complete reaction. It is
noteworthy that the average degree of deacetylation of QCh
samples has not been changed as compared to the parent chitosan as evaluated by 1 H NMR spectroscopy. Indeed, as it was
observed the overlapping of the signals due to H2 and Ha
(Fig. 2b), the average degree of deacetylation of the QCh samples produced via microwave-assisted reaction was calculated
by taking into account the signals due to H1, as proposed by
An et al. (2009). Thus, by using the same equation to determine the average degree of deacetylation of the parent chitosan
and of the QCh samples resulted in DD = 93.2 ± 0.1% and DD =
92.7 ± 0.5% (mean value considering the whole set of QCh samples),
respectively.
D.M.d. Santos et al. / Carbohydrate Polymers 138 (2016) 317–326
323
Fig. 3. Response surface plots showing the effect of molar ratio GTMAC/Chitosan, reaction time and temperature on the response variables, namely degree of quaternization
(a, b, and c), intrinsic viscosity (d, e, and f) and reaction yield (g, h, and i).
The whole set of QCh samples show lower intrinsic viscosity as
compared to that of the parent chitosan ([Á]Chitosan = 451 mL g−1 ).
Indeed, the response surface plots (Fig. 3d–f) also show that
increasing the molar ratio GTMAC/Chitosan, reaction time and
temperature negatively affected the intrinsic viscosity of the
resulting QCh samples, the high the molar ratio GTMAC/chitosan
and the reaction temperature and the longer the reaction, the lower
the intrinsic viscosity. At a first glance, this fact can be attributed to
the occurrence of depolymerization, which would be more important when longer reaction time and temperature were used during
the derivatization reaction, but one can also consider that the insertion of numerous substituent groups in the chitosan chains can
render the interactions polymer/solvent more and more unfavorable, resulting in chain coiling.
The viscosity average molecular weight (Mv ) of the QCh samples was estimated from the corresponding intrinsic viscosity
value by using the Mark–Houwink–Sakurada equation proposed
by Yevlampieva, Gubarev, Gorshkova, Okrugin, & Ryumtsev (2015)
for quaternized chitosan as determined in 0.3 mol L−1 acetic
acid/0.2 mol L−1 sodium acetate buffer at 25 ◦ C. The viscosity average degree of polymerization (DPv ) of a given QCh sample was
calculated from the ratio between its viscosity average molecular
weight (Mv ) and the corresponding average molecular weight of its
repeating unit (M0 ), this latter depending on the average degree of
quaternization of the sample. Thus, it can be clearly seen that the
average degree of polymerization of QCh decreases with increasing degree of quaternization (Fig. 4). According to Yevlampieva
et al. (2015) such a decrease of DPv with increasing DQ can be
324
D.M.d. Santos et al. / Carbohydrate Polymers 138 (2016) 317–326
Fig. 4. Dependence of the average degree of polymerization of the QCh samples as
a function of the degree of quaternization.
attributed to fact that the solvent used to determine the intrinsic
viscosity of QCh is a poor solvent to such a derivative of chitosan
as evaluated by static light scattering experiments. On the other
hand, it is well-known that carrying out chemical modifications
on polysaccharides in acid medium favors the occurrence of chain
depolymerization, due to the susceptibility of glycosidic bonds to
acid hydrolysis. Thus, taking into account that the microwaveassisted reaction of chitosan and GTMAC was carried out in aqueous
acetic acid and that prolonging the reaction time and increasing
the temperature resulted in more substituted QCh samples, it is
also probable that such reaction conditions favored the occurrence
of depolymerization. Indeed, Wasikiewicz & Yeates (2013) studied the degradation of chitosan in 0.1 M aqueous acetic acid under
microwave irradiation and an important decrease of molecular
weight was observed with increasing irradiation time.
The effects of molar ratio GTMAC/Chitosan, reaction time and
temperature on the reaction yield are shown in Fig. 3g–i. Thus,
it is observed that the reaction yield increases as the molar ratio
GTMAC/chitosan is increased, the prolongation of the reaction
for longer times also resulting in higher reaction yield (Fig. 3g).
In addition, the response surface plot concerning the effects of
the molar ratio of GTMAC/Ch and reaction temperature on reaction yield (Fig. 3h) clearly shows that increasing both variables
increase the reaction yield. In contrast, the use of low excess
of GTMAC and short reaction time result in low reaction yield
(Fig. 3h and i).
Further two synthesis were carried out under conventional
heating and employing the same experimental conditions of run
1 (molar ratio GTMAC/chitosan of 4/1; 20 min. and 75 ◦ C) and run 8
(molar ratio GTMAC/chitosan of 6/1; 30 min. and 85 ◦ C) to result
in samples QCh1-CH and QCh8-CH, respectively. Such samples
exhibited DQ = 15.3 ± 0.3%, [Á] = 374 ± 11 mg mL−1 (sample QCh1CH) and DQ = 41.4 ± 0.5%, [Á] = 341 ± 6 mg mL−1 (sample QCh8-CH)
while samples QCh1 (DQ = 47.3 ± 0.4%, [Á] = 288 ± 3 mg mL−1 ) and
QCh8 (DQ = 71.1 ± 0.8%, [Á] = 233 ± 4 mg mL−1 ), both of them prepared under microwave radiation, exhibited much higher average
degrees of quaternization but lower intrinsic viscosities.
Thus, such a comparison shows that microwave-assisted
synthesis was much more efficient than conventional heating to
promote the substitution reaction on chitosan. Also, it is important
to highlight that microwave-assisted synthesis as carried out
in this study allows the preparation of highly substituted QCh
in much shorter time (≤30 min.) as compared to conventional
Fig. 5. TG (a) and DTG curves (b) of chitosan and samples QCh1, QCh8, QCh1-CH
and QCh8-CH.
synthesis (4–18 h), according to the literature (Cho et al., 2006;
Wu et al., 2006; Xiao et al., 2012).
3.3. Thermogravimetric analysis
The thermal stability of polymers is affected by the occurrence
and extent of substitution reactions and to investigate the effects
of the substituents on the thermal behavior of quaternized chitosan samples, TG analyzes were carried out. Comparing the TG
and DTG curves (Fig. 5a and b) reveals that chitosan and samples QCh1, QCh8, QCh1-CH and QCh8-CH display similar thermal
behaviors as the same three main events are observed, although the
Tonset and weight losses corresponding to the degradation stage II
are different (Table 4). The first thermal event (25–150 ◦ C), named
as stage I, is attributed to the evaporation of weakly adsorbed
and loosely-bound water, the weight loss ranging as 7% - 11%.
Higher weight losses at the first step were observed in the cases
of samples QCh1, QCh8 and QCh8-CH, probably due their higher
average degree of substitution, the substituent groups contributing for a higher adsorption of humidity owning to the presence of
charges.
The second thermal event, Stage II, starts at ≈220 ◦ C and
extends up to ≈420 ◦ C in the case of chitosan but it occurs in
the range 190–390 ◦ C in the cases of the quaternized derivatives.
Such a thermal event provokes the elimination of volatile products from the decomposition of the substituent groups while
D.M.d. Santos et al. / Carbohydrate Polymers 138 (2016) 317–326
325
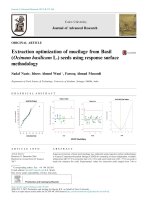
as compared to the one observed in the diffractogram of chitosan,
indicating the loss of order upon the derivatization reaction. Indeed,
the crystallinity indexes (CrI) of the parent chitosan and samples
QCh1, QCh8, QCh1-CH and QCh8-CH were determined from the
corresponding XDR patterns according to Osorio-Madrazo et al.
(2010), resulting in 31.0%, 18.3% 17.5%, 24.2%, and 20.6%, respectively. Such results suggest that the arrangement of the polymer
chains in the solid state has changed because of the introduction
of substituents on the chitosan chains. Thus, as a consequence of
the presence of charged and bulky substituents on the chains of
quaternized chitosan samples, their crystallinity indexes are much
lower as compared to chitosan owning the disruption of hydrogen
bonding and the occurrence of an important steric hindrance (Xiao
et al., 2012).
3.5. Water solubility
Aiming to evaluate the effects of substituents on the solubility
of quaternized chitosan samples, the absorbance of polymer solutions (Cp = 1 g/L) was measured as a function of the solution pH. The
comparison of the water solubility of chitosan and its quaternized
derivatives as a function pH (Fig. 6b) reveals that at pH ≤ 6.0, the
polymers are all fully soluble as the transmittances of their solutions were close to 100%. However, increasing the pH from 6.0 to 7.0
provoked the occurrence of clouding in the chitosan solution due to
precipitation of the polymer as a consequence of the deprotonation
of ammonium groups of GlcN units. As seen in Fig. 5b, the solubility of sample QCh1-CH was high at pH < 6.0 but it dramatically
decreased at pH > 7.0. In contrast, as the pH was increased in the
range 6.0–12.0, the transmittance of the solutions of samples QCh1,
QCh8 and QCh8-CH remained close to 100%. Thus, owning to its
relatively low average degree of quaternization (DQ = 15.3%), sample QCh1-CH displays a similar solubility as compared to chitosan
while samples QCh1, QCh8 and QCh8-CH are fully water soluble at
2.0 < pH < 12.0 due to the high content of charged substituents (DQ
> 40%).
Fig. 6. (a) X-ray diffractograms and (b) water-solubility as a function of pH of chitosan and samples QCh1, QCh8, QCh1-CH and QCh8-CH.
4. Conclusions
further thermal events leading to the complete thermal degradation of the samples occur at temperatures higher than 420 ◦ C
and 390 ◦ C in the cases of chitosan and quaternized chitosan,
respectively.
During Stage II, the weight losses ranged in the interval 42–52%,
the higher the average degree of quaternization of the chitosan
derivative the higher the corresponding weight loss (Table 5). Also,
the values of Tonset (Table 4) show that the quaternized chitosan
samples exhibit lower thermal stability as compared to the parent
chitosan, in accordance with other studies reporting on the thermal stability of chitosan derivatives (Chethan, Vishalakshi, Sathish,
Ananda, & Poojary, 2013; De Britto & Campana-Filho, 2004; Xu, Xin,
Li, Huang, & Zhou, 2010).
3.4. X-ray diffraction
As the occurrence of ordered/disordered regions strongly
depends on intra- and intermolecular interactions, the effects of
the substituents on the solid state arrangement of QCh chains was
studied by X-ray diffraction (XRD). The XRD pattern of the parent
chitosan (Fig. 6a) exhibits an intense peak centered at 2Â = 20.2◦
which is related to the reflection planes (2 0 0)h and (0 2 0)a
while the peak occurring at 2Â = 10.9◦ corresponds to the plane
(0 2 0)h (Osorio-Madrazo et al., 2010). In the XRD patterns of the
quaternized chitosan samples (Fig. 6a), the peak at 2Â = 10.9◦ is not
observed while that peak at 2Â = 20.2◦ is significantly less intense
The microwave-assisted reaction of chitosan (Ch) with glycidyltrimethylammonium chloride (GTMAC) in acid medium
allowed the efficient production of N-(2-hydroxy)-propyl-3trimethylammonium chitosan chloride (QCh) in much shorter time
(≤30 min.) as compared to conventional reaction carried out in similar conditions except for the use of microwave radiation. Also,
the spectroscopic characterization of QCh showed that none other
chemical modifications occurred as a consequence of the reaction
of chitosan and GTMAC.
The execution of full-factorial 23 central composite design to
study the effects of reaction variables on the variable responses,
namely the average degree of quaternization and intrinsic viscosity of QCh and reaction yield, resulted in mathematical equations
displaying high determination coefficients and insignificant lack of
fit, the molar ratio GTMAC/H displaying the strongest influence followed by reaction time and temperature. Thus, using a high molar
ratio GTMAC/Ch (6/1) and carrying out the reaction for 30 min. at
85 ◦ C resulted in a highly substituted QCh sample (DQ = 71.1%) at
high reaction yield (164%).
The thermal stability and the degree of order of the QCh samples were lower as compared to the parent chitosan while the water
solubility was greatly improved as a consequence of the derivatization reaction as samples QCh1 and QCh8 were fully soluble over the
range 2 < pH < 12. This study contributes to the improvement of the
methodologies aiming the preparation of quaternized chitosan as it
highlighted the use of microwave radiation to result in a simple and
326
D.M.d. Santos et al. / Carbohydrate Polymers 138 (2016) 317–326
fast experimental procedure to produce N-(2-hydroxy)-propyl-3trimethylammonium chitosan chloride (QCh).
Acknowledgments
The authors are grateful to the agencies Coordenac¸ão de
Aperfeic¸oamento de Pessoal de Nível Superior (CAPES 443/2012;
Brazil), Conselho Nacional de Desenvolvimento Científico e Tecnológico (CNPq 142002/2014-3; Brazil), Fundac¸ão de Amparo à
Pesquisa do Estado de São Paulo (FAPESP 2010/02526-1; Brazil) for
financial support. The authors also address special thanks to Prof.
Andre L. M. Porto (University of Sao Paulo—Brazil) for allowing the
use of the microwave reactor.
References
An, N. T., Thien, D. T., Dong, N. T., & Dung, P. Le. (2009). Water-soluble
N-carboxymethylchitosan derivatives: Preparation, characteristics and its
application. Carbohydrate Polymers, 75(3), 489–497. />j.carbpol.2008.08.017
Bezerra, M. A., Santelli, R. E., Oliveira, E. P., Villar, L. S., & Escaleira, L. A. (2008).
Response surface methodology (RSM) as a tool for optimization in analytical
chemistry. Talanta, 76(5), 965–977, doi: />j.talanta.2008.05.019.
Biswas, A., Kim, S., Selling, G. W., & Cheng, H. N. (2014). Conversion of agricultural
residues to carboxymethylcellulose and carboxymethylcellulose acetate.
Industrial Crops and Products, 60(0), 259–265, doi: />j.indcrop.2014.06.004.
Brugnerotto, J., Lizardi, J., Goycoolea, F. M., Argüelles-Monal, W., Desbrières, J., &
Rinaudo, M. (2001). An infrared investigation in relation with chitin and
chitosan characterization. Polymer, 42(8), 3569–3580,
doi: />Caddick, S., & Fitzmaurice, R. (2009). Microwave enhanced synthesis. Tetrahedron,
65(17), 3325–3355, doi: />Chethan, P. D., Vishalakshi, B., Sathish, L., Ananda, K., & Poojary, B. (2013).
Preparation of substituted quaternized arylfuran chitosan derivatives and their
antimicrobial activity. International Journal of Biological Macromolecules, 59(0),
158–164, doi: />Cho, J., Grant, J., Piquette-Miller, M., & Allen, C. (2006). Synthesis and
physicochemical and dynamic mechanical properties of a water-soluble
chitosan derivative as a biomaterial. Biomacromolecules, 7(10), 2845–2855.
/>De Britto, D., & Campana-Filho, S. P. (2004). A kinetic study on the thermal
degradation of N,N,N-trimethylchitosan. Polymer Degradation and Stability,
84(2), 353–361, doi: />2004.02.005.
Desbrières, J., Martinez, C., & Rinaudo, M. (1996). Hydrophobic derivatives of
chitosan: Characterization and rheological behaviour. International Journal of
Biological Macromolecules, 19(1), 21–28,
doi: />Gawande, M. B., Shelke, S. N., Zboril, R., & Varma, R. S. (2014). Microwave-assisted
chemistry: Synthetic applications for rapid assembly of nanomaterials and
organics. Accounts of Chemical Research, 47(4), 1338–1348. />1021/ar400309b
Ge, H.-C., & Luo, D.-K. (2005). Preparation of carboxymethyl chitosan in aqueous
solution under microwave irradiation. Carbohydrate Research, 340(7),
1351–1356, doi: />Hirai, A., Odani, H., & Nakajima, A. (1991). Determination of degree of
deacetylation of chitosan by 1H NMR spectroscopy. Polymer Bulletin, 26(1),
87–94. />Hoogenboom, R., & Schubert, U. S. (2006). Microwave-assisted cationic
ring-opening polymerization of a soy-based 2-oxazoline monomer. Green
Chemistry, 8(10), 895–899. />Huang, J., Cheng, Z.-H., Xie, H.-H., Gong, J.-Y., Lou, J., Ge, Q., et al. (2014). Effect of
quaternization degree on physiochemical and biological activities of chitosan
from squid pens. International Journal of Biological Macromolecules, 70(0),
545–550, doi: />Komorowska-Durka, M., Dimitrakis, G., Bogdał, D., Stankiewicz, A. I., & Stefanidis,
G. D. (2015). A concise review on microwave-assisted polycondensation
reactions and curing of polycondensation polymers with focus on the effect of
process conditions. Chemical Engineering Journal, 264, 633–644,
doi: />Liu, B., Wang, X., Yang, B., & Sun, R. (2012). Microwave-assisted synthesis of
quaternized carboxymethyl chitosan in aqueous solution and its thermal
behavior. Journal of Macromolecular Science, Part A: Pure and Applied Chemistry,
49(3), 227–234, doi: />(Retrieved from).
Mogos¸anu, G. D., & Grumezescu, A. M. (2014). Natural and synthetic polymers for
wounds and burns dressing. International Journal of Pharmaceutics, 463(2),
127–136, doi: />
Moseley, J. D., & Kappe, C. O. (2011). A critical assessment of the greenness and
energy efficiency of microwave-assisted organic synthesis. Green Chem., 13(4),
794–806. />Muzzarelli, R. A. A. (2009). Chitins and chitosans for the repair of wounded skin,
nerve, cartilage and bone. Carbohydrate Polymers, 76(2), 167–182,
doi: />Myers, R. H., Montgomery, D. C., & Anderson-Cook, C. M. (2009). Response surface
methodology: Process and product optimization using designed experiments (3rd
ed.). Hoboken, New Jersey: John Wiley & Sons, Ltd (R. H. Myers, Ed.).
Nuchter, M., Ondruschka, B., Bonrath, W., & Gum, A. (2004). Microwave assisted
synthesis—A critical technology overview. Green Chemistry, 6(3), 128–141.
/>Osorio-Madrazo, A., David, L., Trombotto, S., Lucas, J.-M., Peniche-Covas, C., &
Domard, A. (2010). Kinetics study of the solid-state acid hydrolysis of chitosan:
evolution of the crystallinity and macromolecular structure.
Biomacromolecules, 11(5), 1376–1386. />Peniche, C., Argüelles-Monal, W., & Goycoolea, F. M. (2008). Chitin and chitosan:
Major sources, properties and applications. In M. N. B. B. T.-M. Gandini
Polymers (Ed.), Polymers and Composites from Renewable Resources (pp.
517–542). Amsterdam: Elsevier,
doi: (Chapter 25).
Petit, C., Reynaud, S., & Desbrieres, J. (2015). Amphiphilic derivatives of chitosan
using microwave irradiation. Toward an eco-friendly process to chitosan
derivatives. Carbohydrate Polymers, 116(0), 26–33,
doi: />j.carbpol.2014.04.083.
Prado, H. J., & Matulewicz, M. C. (2014). Cationization of polysaccharides: A path to
greener derivatives with many industrial applications. European Polymer
Journal, 52(1), 53–75,
doi: />(Retrieved from).
Rabea, E. I., Badawy, M. E.-T., Stevens, C. V., Smagghe, G., & Steurbaut, W. (2003).
Chitosan as antimicrobial agent: Applications and mode of action.
Biomacromolecules, 4(6), 1457–1465. />Rinaudo, M. (2006). Chitin and chitosan: Properties and applications. Progress in
Polymer Science, 31(7), 603–632, doi: />j.progpolymsci.2006.06.001.
Ruihua, H., Bingchao, Y., Zheng, D., & Wang, B. (2012). Preparation and
characterization of a quaternized chitosan. Journal of Materials Science, 47(2),
845–851, doi: />(Retrieved from).
dos Santos, D. M., Bukzem, A. de. L., Ascheri, D. P. R., Signini, R., & de Aquino, G. L. B.
(2015). Microwave-assisted carboxymethylation of cellulose extracted from
brewer’s spent grain. Carbohydrate Polymers, 131, 125–133,
doi: />Sanyakamdhorn, S., Agudelo, D., & Tajmir-Riahi, H.-A. (2013). Encapsulation of
antitumor drug doxorubicin and its analogue by chitosan nanoparticles.
Biomacromolecules, 14(2), 557–563, doi: />inward/record.url?eid=2-s2.084873647867&partnerID=40&md5=94dea38ffbd64bf05118e3219f12ddf3
(Retrieved from).
Singh, V., Tiwari, A., Tripathi, D. N., & Sanghi, R. (2006). Microwave enhanced
synthesis of chitosan-graft-polyacrylamide. Polymer, 47(1), 254–260,
doi: />Sonia, T. A., & Sharma, C. P. (2011). In vitro evaluation of N-(2-hydroxy)
propyl-3-trimethyl ammonium chitosan for oral insulin delivery. Carbohydrate
Polymers, 84(1), 103–109, doi: />Sugihara, Y., Semsarilar, M., Perrier, S., & Zetterlund, P. B. (2012). Assessment of the
influence of microwave irradiation on conventional and RAFT radical
polymerization of styrene. Polymer Chemistry, 3(10), 2801–2806. .
org/10.1039/C2PY20434G
Wasikiewicz, J. M., & Yeates, S. G. (2013). Green molecular weight degradation of
chitosan using microwave irradiation. Polymer Degradation and Stability, 98(4),
863–867, doi: />Wu, J., Su, Z.-G., & Ma, G.-H. (2006). A thermo- and pH-sensitive hydrogel
composed of quaternized chitosan/glycerophosphate. International Journal of
Pharmaceutics, 315(1–2), 1–11, doi: />01.045.
Xiao, B., Wan, Y., Wang, X., Zha, Q., Liu, H., Qiu, Z., et al. (2012). Synthesis and
characterization of N-(2-hydroxy)propyl-3-trimethyl ammonium chitosan
chloride for potential application in gene delivery. Colloids and Surfaces B:
Biointerfaces, 91(0), 168–174,
doi: />Xu, T., Xin, M., Li, M., Huang, H., & Zhou, S. (2010). Synthesis, characteristic and
antibacterial activity of N,N,N-trimethyl chitosan and its carboxymethyl
derivatives. Carbohydrate Polymers, 81(4), 931–936,
doi: />Yevlampieva, N. P., Gubarev, A. S., Gorshkova, M. Y., Okrugin, B. M., & Ryumtsev, E.
I. (2015). Hydrodynamic behavior of quaternized chitosan at acidic and neutral
pH. Journal of Polymer Research, 22(9), 1–9. />Zhu, Y.-J., & Chen, F. (2014). Microwave-assisted preparation of inorganic
nanostructures in liquid phase. Chemical Reviews, 114(12), 6462–6555. http://
dx.doi.org/10.1021/cr400366s