Visualisation of xanthan conformation by atomic force microscopy
Bạn đang xem bản rút gọn của tài liệu. Xem và tải ngay bản đầy đủ của tài liệu tại đây (4.69 MB, 10 trang )
Carbohydrate Polymers 148 (2016) 380–389
Contents lists available at ScienceDirect
Carbohydrate Polymers
journal homepage: www.elsevier.com/locate/carbpol
Visualisation of xanthan conformation by atomic force microscopy
Jonathan Moffat a , Victor J. Morris b , Saphwan Al-Assaf c , A. Patrick Gunning b,∗
a
Asylum Research an Oxford Instruments Company, Halifax Rd., High Wycombe, Buckinghamshire, HP12 3SE, UK
Institute of Food Research, Norwich Research Park, Norwich, NR4 7UA, UK
c
Hydrocolloids Research Centre, Institute of Food Science & Innovation, Faculty of Science & Engineering, University of Chester, Parkgate Road, Chester CH1
4BJ, UK
b
a r t i c l e
i n f o
Article history:
Received 9 March 2016
Received in revised form 14 April 2016
Accepted 18 April 2016
Available online 20 April 2016
Keywords:
Atomic force microscopy
Xanthan
Structural conformation
Counterions
a b s t r a c t
Direct visual evidence obtained by atomic force microscopy demonstrates that when xanthan is adsorbed
from aqueous solution onto the heterogeneously charged substrate mica, its helical conformation is
distorted. Following adsorption it requires annealing for several hours to restore its ordered helical state.
Once the helix state reforms, the AFM images obtained showed clear resolution of the periodicity with
a value of 4.7 nm consistent with the previously predicted models. In addition, the images also reveal
evidence that the helix is formed by a double strand, a clarification of an ambiguity of the xanthan
ultrastructure that has been outstanding for many years.
© 2016 The Authors. Published by Elsevier Ltd. This is an open access article under the CC BY license
( />
1. Introduction
Xanthan is a bacterial polysaccharide produced by Xanthamonas
campestris (Garcia-Ochoa, Santos, Casas, & Gomez, 2000). The
polysaccharide consists of a linear (1,4) linked d glucose cellulosic
backbone substituted with a regular trisaccharide sidechain, containing two mannose (Man) and a glucuronic acid (GlcA), attached
on every other glucose at C-3. The charged sidechain consists of
DMan(1-4)DGlcA(1-2)␣DMan(1-. The terminal mannose units
may contain a pyruvic acid substitute and the ␣-linked mannose
units may have an acetyl group at position O-6 (Phillips & Williams,
2009). Another two recent studies have shown that there can be
more heterogeneity of xanthan’s repeat unit than was previously
assumed in terms of the ratio of the charge groups within xanthan’s
sidechains depending upon the fermentation conditions: There are
6 different patterns of attachment of pyruvate and acetate groups
to the pentasaccharide repeat unit, and the relative abundance of
these affects the stability of the ordered structure (Kool, Gruppen,
Sworn, & Schols, 2013; Kool, Gruppen, Sworn, & Schols, 2014). It is
not clear whether this heterogeneity arises due to intra- or intermolecular substitution. The charged groups on the sidechains play
a vital role in xanthan’s aqueous solubility and also its structural
conformation (Phillips & Williams, 2009). In the presence of stabilising counterions, which shield the intramolecular charge–charge
∗ Corresponding author.
E-mail address: (A.P. Gunning).
interactions, the sidechains fold down compactly against the backbone leading to the formation of a 5-fold ordered helical structure
(Norton, Goodall, Frangou, Morris, & Rees, 1984). The ordered structure is much stiffer than the disordered ‘random coil’ conformation.
In the helical state xanthan has a persistence length in excess of
100 nm, ranking it amongst the stiffest known biopolymers. Previous studies have proven that electrostatic interactions between
the charged groups within xanthan and screening counterions
determine its ultrastructural conformation in solution (Matsuda,
Biyajima, & Sato, 2009; Bejenariu, Popa, Picton, & Le Cerf, 2010;
Brunchi, Morariu, & Bercea, 2014).
Traditional methods have been used widely to investigate the
molecular conformation of polysaccharides. Optical rotation, circular dichroism, differential scanning calorimetry and rheology are
convenient methods for following the course of disorder–order
and order–disorder transitions in response to external variables
(temperature, ionic strength, concentration of specific cations and
denaturants). X-ray fibre diffraction remains the only technique
capable of characterising ordered structures at atomic resolution,
provided that the chains are well enough oriented and aligned, but
atomic resolution has not yet been achieved for xanthan.
The principle question addressed by the present study is that
there has been considerable ambiguity for many years on the
detail of xanthan’s secondary structure (Morris, 1998). The initial
interpretation of X-ray fibre diffraction data was that it formed a
single helix (Moorhouse, Walkinshaw, & Arnott, 1977). A subsequent study (Okuyama et al., 1980), carried out in response to the
“two strands = double helix” lobby, examined possible double-helix
/>0144-8617/© 2016 The Authors. Published by Elsevier Ltd. This is an open access article under the CC BY license ( />
J. Moffat et al. / Carbohydrate Polymers 148 (2016) 380–389
models. It was concluded that, on the basis of the X-ray evidence
alone, it was not possible to assign a double-helix or single helical
model for xanthan.
In terms of physical chemical studies the salt-induced
disorder–order transition followed first order rather than second
order kinetics, which suggested a single helix (Norton et al., 1984).
Many groups (Morris, 1998) have equated observed dimerization
of xanthan with double-helix formation; but that is not evidence
based and it is potentially an oversimplified interpretation. The
ambiguity with such methods is the fact that they are ensemble measurements. This means that the analytical conclusion is
controlled by the ratio of ordered to disordered states, so that
they lack a certain degree of sensitivity compared to microscopical techniques, such as atomic force microscopy (AFM). AFM is
capable of visualising the structure of individual molecules. The
main objective of this study is to provide direct evidence on the
nature of xanthan’s secondary structure. The unique advantage of
AFM is its ability to visualise directly the topology of polymer networks under near-native conditions, which can be a very powerful
complimentary technique to combine with ensemble methodologies. An integral study using various biophysical techniques,
namely, AFM, gel permeation chromatography with multi-angle
light scattering (GPC-MALLS) and intrinsic viscosity measurements
by capillary viscometry on the conformation of xanthan, following various different treatments (heating, autoclaving, irradiation
and high pressure homogenisation), was recently reported (Gulrez,
Al-Assaf, Fang, Phillips, & Gunning, 2012). Several polymer parameters derived from these techniques, such as the radius of gyration
(Rg), Mw , polydispersity, molar mass per unit contour length of the
rod (ML ) and Huggins constant (KH ) were correlated well with the
results obtained by AFM. It was possible to correlate the height
measurements obtained by AFM with values close to 1000 Dalton
per nanometre (Da nm−1 ) and 2000 (Da nm−1 ) assigned for single
and double helix, respectively in agreement with previous reports
which solely relied on light scattering measurements (Sato, Kojima,
Norisuye, & Fujita, 1984; Sato, Norisuye, & Fujita, 1984). Furthermore, using positively-charged mica (coated with poly-l-lysine) a
single strand molecule was trapped in a ‘random coil’ conformation
(Gulrez et al., 2012). This is consistent with the widely agreed view
that xanthan at low concentration and negligible ionic strength
adopts ‘random coil’ conformation.
The present study reveals new images of xanthan at submolecular resolution revealing the fine detail of its secondary
structure development, which has enabled the process of charge
screening to be investigated in a manner never previously reported.
381
the bimetallic strip effect and modulation of the power causes
the probe to oscillate at an accurately controlled frequency and
amplitude. The laser power modulation frequency was set at the
fundamental resonant frequency of the cantilever (1.37 MHz) and
the power level 124.8 W set to generate an appropriately small
oscillation amplitude (∼1 nm). The feedback loop control set-point
was also kept at a very low level of damping of the cantilever’s
free oscillation (∼5–10%) to minimise the loading force on the
molecules. The AFM tips used were Arrow UHF-AuD (NanoWorld
AG, Neuchâtel, Switzerland). Scan rates were set at 1.5 Hz.
2.2. Preparation of xanthan solutions
The xanthan used in this study was a powdered food grade xanthan gum (Keltrol RD, CP Kelco, Atlanta, GA, USA). ‘RD’ stands for
a readily dissolvable product. The stock solution was prepared at a
concentration of 1 mg ml−1 in pure water (18.2 M ). The xanthan
powder was dispersed immediately after addition to the water at
22 ◦ C by stirring. It was then left for 30 min to hydrate before heating to 95 ◦ C for 60 min to completely disperse the molecules. The
stock solution was allowed to cool to room temperature (22 ◦ C) and
then diluted to 3 g ml−1 into either water (method 1, below), or
the aqueous buffers (method 2, below). The diluted solutions were
then re-heated to 95 ◦ C for 60 min to reduce any aggregation and
allowed to cool back to 22 ◦ C prior to the AFM imaging preparation
procedures.
The additional heating step was merely to ensure that the
same structure and proportions of soluble/aggregate fractions are
present in the test material (renatured state). Gulrez et al. (2012)
investigated the effect of heat treatment on xanthan aqueous
solutions (4 mg/mL) dissolved in distilled water, which was subsequently diluted to contain 0.1 M LiNO3 prior to injection into
the GPC-MALLS system. They demonstrated that heating xanthan
aqueous solution up to 40 min at 85 ◦ C resulted in similar molecular weight parameters (i.e. weight average molecular weight, %
mass recovery and polydispersity). Further heating up to 60 min
resulted in an increase in the mass recovery and a slight increase
in the molecular weight as a result of disassociation of large aggregates initially retained on the 0.45 m filter. The molecular weight
is reduced to almost half with full mass recovery and an increase
in the polydispersity (from 1.64 to 2.75) when the diluted solution
was heated for 2 at 85 ◦ C.
2.1. AFM imaging preparation procedures
Two methods were used to physisorb xanthan molecules onto
freshly-cleaved muscovite mica (Agar Scientific, Cambridge, UK).
2. Experimental
2.1. Atomic force microscopy
The atomic force microscope (Cypher AFM, Asylum Research
Inc, an Oxford Instruments company, Santa Barbara, CA, USA) was
operated in AC mode in aqueous buffers containing different counterions. Buffer 1: 10 mM HEPES 3 mM ZnCl2 pH 5.3, and buffer 2:
10 mM HEPES 3 mM NiCl2 pH 7.0 (Sigma-Aldrich Chemical, Poole,
Dorset, UK). Oscillation of the cantilevers at their fundamental
resonant frequency was driven using ‘blueDrive’ photo-thermal
excitation. Photothermal excitation is a new technology developed
by Asylum research that provides a more stable and controlled
form of cantilever oscillation. This is achieved by positioning a
laser beam with wavelength 425 nm and modulated power directly
onto the cantilever’s bimetallic strip, as opposed to the traditional piezo-acoustic method, which mechanically oscillates the tip
holder causing more potential disturbance of the samples. Localised
heating by the blue laser causes the cantilever to bend due to
2.2.1. Method 1: drop deposition (includes drying)
A 3.5 l droplet of xanthan at a concentration of 3 g ml−1 in
water was placed onto the freshly-cleaved mica and left to evaporate at room temperature (22 ◦ C). When fully dry the sample was
then placed into the liquid cell of the AFM and imaged in the aqueous buffers described in Section 2.1.
2.2.2. Method 2: in-situ adsorption (no-drying)
100 l of the buffer-diluted xanthan solution (3 g ml−1 ) was
placed directly into the liquid cell of the AFM, which contained
freshly-cleaved mica and then imaged as described in Section 2.1.
3. Results
Fig. 1 displays an example of the data that were always obtained
at the early stages of imaging xanthan in aqueous buffers, prepared
by both methods (Fig. 1a drop deposition, Fig. 1b in-situ adsorption). The swirly white lines over one molecule in each image
382
J. Moffat et al. / Carbohydrate Polymers 148 (2016) 380–389
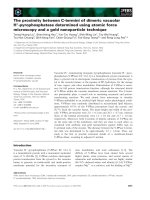
Fig. 1. Early stage images of xanthan on mica in aqueous buffer. (a) Method 1, drop-deposited, imaged in buffer 1. (b) Method 2, in-situ adsorbed from and imaged in buffer
2. Bottom panels: Line profiles depict the heights of the features beneath the white lines in the images.
illustrates the location of the cross-sections that are profiled in
the graph beneath the images. The reason they are swirly lines is
to enable repetitive quantification of the height of the molecules.
The average value in both cases is 2.06 ± 0.19 nm. Measurement of
height is the most accurate way to quantify the diameter of polymers with AFM, as lateral dimensions are significantly oversized
by probe-broadening (Morris, Kirby, & Gunning, 2009). The value
of the height of this chain is slightly larger than the predicted width
(1.8 nm) of xanthan in the double helical form (Millane, 1990). The
linearity of the chains demonstrates rigidity. This provides evidence
that at this early stage, despite there being no secondary structure
visible within the chains, xanthan is not in a disordered conformation. Previous research has shown that xanthan in a disordered
‘random coil’ state has a significantly lower chain height than in the
ordered state and also appears less linear due to its lack of rigidity
(Gulrez et al., 2012). However, as mentioned above the interesting
issue is that, despite the fact that the dimensions and linearity of
the chains at this early stage are closer to the ordered conformation
of xanthan, no periodicity was visible along any of the chains.
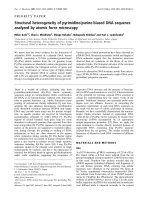
After a certain length of time in the liquid cell of the AFM the
helices were visualised in each of the samples prepared by the two
different methods (Fig. 2a and b). Once the helices have annealed
within their ordered state the width of the chains (accurately measured as height by AFM) is 1.6 ± 0.16 nm, which is more compact by
approximately 0.4 nm than those measured prior to annealing. This
height value is reasonably consistent with the width of xanthan
obtained from x-ray fibre diffraction measurements (1.6–1.8 nm)
(Millane, 1990). In buffer 1 the re-conformation of the helix took
∼16 hours and in buffer 2 it took ∼ 4 hours. The difference between
the buffers containing Ni2+ and Zn2+ is the pH (7.0 & 5.3 respectively).
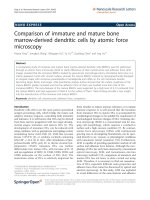
The values of the periodicity observed after annealing have been
quantified by line profiling along the molecules (Fig. 3a and b).
This relates to the pitch of the helices, and the values obtained
are 4.67 ± 0.29 nm in buffer 1 (Zn2+ ) and, although in Fig. 3b the
line profile is noisier, the actual number of visible helical turns
gives a similar value; 4.75 ± 0.11 nm in buffer 2 (Ni2+ ). These values are fully consistent with the previous x-ray fibre diffraction
data (Millane & Narasaiah, 1990; Okuyama et al., 1980). There is
a significant difference in terms of the consistency of the structural order between the different adsorption methodologies used.
In the drop deposited samples (method 1) many of the chains display ends where the helices are unravelled (Figs. 2 a, 4, and 5 a–c)
and the occasional case with a small, unravelled section of the helix
arrowed in Fig. 4. The heights of the helical section and the unravelled section are quantified by the line profile in Fig. 4. The helical
section has a height of 1.6 nm and the unravelled section has a
height of 0.6 nm, which is less than half the value. The difference in
the heights confirms that the taller section is not a simple dimerization of two single chains. It is therefore a more complex structural
arrangement as expected for a helix.
Further analysis of this image with the unravelled section of the
ordered structure is displayed in Fig. 5. The length of the unravelled section is 4.6 nm (Fig. 5a). The line profiles in Fig. 5b & creveal
that the difference in the heights of each section are consistent with
those measured on the other xanthan molecule in Fig. 4: helical section 1.6 nm (Fig. 5b) and unravelled ‘mid-section’ 0.6 nm (Fig. 5c).
The height equivalence and elimination of periodicity confirms full
disordering of the unravelled ‘mid-section’. The fact that the length
of the unravelled section is no longer than the helical pitch observed
in both buffers (Fig. 3) indicates that it is unravelling of the helix
into two disordered strands.
The images in Fig. 6 reveals further evidence for a double helical
conformation of xanthan; one of the proposed helical structures
suggested to be formed in a dilute solution. The suggestion is
that xanthan’s double helix dissociates into two single chains at
a denaturing concentration (≤1 mg ml−1 ) but, despite it seeming
inconsistent, there is a possibility that single chains can reconstruct
the intramolecular double helical structure in an anti-parallel manner with a hairpin loop at one end during the renaturation process
(Matsuda et al., 2009). The arrow in Fig. 6b shows that occasional
predicted hairpin loops do indeed exist and a second one is shown
in Fig. 6c (an alternatively coloured version of Fig. 2a).
Although the conformation of the xanthan changed with time to
the fully ordered helical state, Fig. 7 shows a set of images demonstrating that the molecules remained stably attached to the mica
J. Moffat et al. / Carbohydrate Polymers 148 (2016) 380–389
383
Fig. 2. Resolution of the helical pitch of xanthan: (a) Method 1, drop-deposited, imaged in buffer 1. (b) Method 2, in-situ adsorbed from and imaged in buffer 2. Bottom
panels: Line profiles depict the heights of the features beneath the white lines in the images.
in virtually the same positions over the longest investigated time
period of 16 hours in the liquid cell in buffer 1. Fig. 7a was the last
image taken during the initial stages when no helices were observable and Fig. 7b was the first image taken the following day when
the helices were observable. Despite there being a small amount
of drift between Fig. 7a and b (∼500 nm to the top right) the white
box marker shows the matching regions in both images with no
significant movement of the molecules themselves. Fig. 7c shows
how consistent the position of the molecules is in both scans by
overlapping the images. The later image (Fig. 7b) has been placed
on top of the earlier image (Fig. 7a) and set to a different colour
(green) with an opacity of 42% so that both can be visualised.
4. Discussion
In solution, screening of the xanthan’s charged groups by counterions can be achieved rapidly at an optimal concentration of salt
because they are mobile and can sustain an equilibrium state. Previous research has shown how sensitive the helical conformation
of xanthan is to the level of salt in the solution (Bejenariu et al.,
2010; Brunchi et al., 2014; Matsuda et al., 2009). The two aqueous buffer solutions used for imaging the xanthan in the present
study included divalent counterions (Ni2+ and Zn2+ ) at optimal
screening concentrations for two purposes: The principal one is
to facilitate adsorption of xanthan onto the mica so that it can be
imaged in liquid. Without sufficient screening of the electrostatic
repulsion between negatively charged water soluble molecules and
mica there is no possibility of successfully imaging molecules in
aqueous liquids because they will desorb from the mica surface,
even if they have been previously deposited by air drying. The two
counterions (Ni2+ , Zn2+ ) were discovered to be optimal for binding
DNA to mica in aqueous buffers due to their small ionic radii (0.69
& 0.74 Å respectively), which allows them to fit into the cavities
above the recessed hydroxyl groups in the mica lattice (Hansma
& Laney, 1996). In addition, Ni2+ and Zn2+ have anomalously high
enthalpies of hydration which is proposed to enable them to form
strong complexes with ligands other than water (Hansma & Laney,
1996). The second aspect to be considered in the present study is
that divalent counterions cause stabilisation of xanthan’s helical
conformation in solution at concentrations ≥1 mM (Brunchi et al.,
2014; Bejenariu et al., 2010). This is crucial because the xanthan
had to be diluted to extremely low concentrations (≤3 g/ml−1 ) to
ensure that sub-monolayer adsorption was achieved on the mica
surface. At higher concentrations the mica surface becomes overcrowded with multilayers of xanthan, which prevents resolving the
individual molecules.
When the xanthan molecules adsorb to the mica, which has a
heterogeneous surface charge distribution, the situation is different
than in solution. The localised electrostatic interactions that occur
between the charged groups present on the polysaccharide chain
and the solid mica surface are highly unlikely to be optimal, since
on the mica the spatial distribution of the charged groups are fixed
so they cannot move and adapt to the charged groups on the xanthan molecule. Theoretical modelling studies demonstrated that
heterogeneously charged polymers adsorbing to heterogeneously
charged surfaces do so by adopting their shape, interpreted as pattern recognition (Chakraborty & Bratko 1998; Golumbfskie, Pande,
& Chakroborty, 1999). It has been previously reported that alteration of xanthan solution pH affects the transition temperature
(Bejenariu et al., 2010) although the pH differences investigated
in that study were significantly larger (3, 7 & 13) than in this study.
Another difference between buffers 1&2 is the water substitution
rates of Nickel compared to Zinc (Ni2+ 2.7 × 10⁴ /s, Zn2+ 5 × 10⁸ /s;
Kobayashi, Nagayama, & Busujima, 1998). This is therefore more
likely to be the reason that the re-annealing time of the xanthan
helices is significantly different in the buffers used in the present
study.
This clearly has an effect on xanthan’s ultrastructure, but there
are two potential reasons. The initial and more obvious interpretation of the time requirement to visualise the helical periodicity due
to the slight streakiness seen in the early stage images (specifically
Fig. 1a) is that the xanthan may not be sufficiently stably attached
to the mica for high-resolution imaging at the early stages. However, there is relatively strong evidence that loose binding may not
be the only reason. The images in Fig. 7 show that nearly all of
the molecules remained in precisely the same position on the mica
over the entire experiment time so they must have been reasonably
bound from the very start. This is probably due to the combination
of the ‘pattern recognition’ shape adoption of the molecules binding to the most suitably charged regions of the mica and also the
384
J. Moffat et al. / Carbohydrate Polymers 148 (2016) 380–389
Fig. 3. Helical pitch of xanthan (a) Method 1, drop-deposited, in the presence of Zn2+ , (b) Method 2, in-situ adsorbed in the presence of Ni2+ . Bottom panels: Line profiles
depict the heights of the features beneath the black lines in the images.
J. Moffat et al. / Carbohydrate Polymers 148 (2016) 380–389
385
Fig. 4. Method 1, drop deposited xanthan sample imaged in buffer 1 showing unravelling of the helices. Bottom panel: Line profiles depict the heights of the features beneath
the thin white line in the image.
strength of the stiff polymer network. This provides clear evidence
that the molecules that adopted their conformation from partially
disordered to the fully ordered helical state over the time period
were those which were imaged during the initial stages, and not a
set of other xanthan molecules on the mica.
Based upon this a unique interpretation of the lack of observable
periodicity in the early stage images suggests that, even if it is in
a fully ordered conformation in solution, xanthan’s helical order is
probably distorted as it initially adsorbs to the mica. The distortion
is however limited; the height measurements and linearity illustrated in Fig. 1 demonstrate that the distortion is not a full helix
to coil transition but clearly is sufficient to remove any observable
periodicity along the polymer chain. This enables interpretation of
the height reduction of the chains from 2 nm at the initial stage
(Fig. 1) to 1.6 nm (Figs. 2, 4, and 5 b). Helical formation was therefore likely due to an annealing compaction of the slightly distorted
structure.
There is a fortunate benefit from mica’s distorting influence;
certain sections of the chains (Figs. 2 and 4–6) do not fully re-order
which enables visualisation of the composition of the helix. It is
clearly double stranded. The fact that the length of the unravelled
section in Fig. 5a is no longer than the helical pitch observed in
both buffers (Fig. 3) indicates that it is unravelling of the helix into
two disordered ‘strands’. Although this seems obvious it provides
additional information on interpreting the nature of the helical
structure, single or double helical? If it was a single helix it would
386
J. Moffat et al. / Carbohydrate Polymers 148 (2016) 380–389
Fig. 5. Additional measurements of the xanthan molecule containing the partially unravelled section. Line profiles (right panels) depict the heights and distances of the
features beneath the red lines in the AFM images (left panels). (a) Profile of the gap created by the unravelled section, with blue markers (in both panels) labelling the
transition zones. (b) Profile across the helical section. (c) Profile across the unravelled section. (For interpretation of the references to colour in this figure legend, the reader
is referred to the web version of this article.).
not produce two strands. Unravelling of a double helix would produce two fully disordered strands.
The visualisation of the hairpins (Fig. 6) provides significant
assistance in the interpretation of the partially unravelled middle
section of the other xanthan chain in Figs. 4 and 5. In summary,
this combination of images provides further direct evidence that
xanthan’s ordered structure is a double helix. In addition, for a
double helix to be formed by a single chain it will wrap around
itself in anti-parallel conformation. The images obtained in this
study demonstrate that xanthan can, by intra-molecular association, form an anti-parallel double helix. For the majority of images
which do not show hair-pin loops the similar height and pitch suggest these are either parallel or anti-parallel double helices formed
by inter-molecular association of two xanthan chains.
The alternative that these molecular structures could be formed
by association of two single helices is unlikely for the following reasons. The structures containing hairpin loops are the same as those
that do not show such loops. In studies of the related xanthan-like
polysaccharide acetan (Kirby, Gunning, Morris, & Ridout, 1995) it
was possible to image, by AFM, side-by-side association of helices
in an aligned liquid crystalline monolayer showing the expected
pitch and height for the helices. This shows that AFM would distinguish between a double helix and paired single helices, since both
single helices in the pair would need to bind to the mica. Further, as
discussed later, although there is a stereo-chemical basis for dimerization of chains to form a double helix, there is no stereo-chemical
basis for dimerization of single helices, which would restrict aggregation to dimers, or explain why it extends along the complete
length of the molecules.
In method 2, the samples prepared by in-situ adsorption of
the xanthan from the buffers containing the divalent counterions,
unravelling of the helices was not detected (Figs. 2 b, and 3 b).
This reflects the state that the xanthan is likely to be in prior to
its attachment to mica in the different methods. In method 1 (drop
deposition from pure water) it is likely to be in a disordered conformation at the initial stage, due to the very low concentration
of the xanthan, which also means that the solution is very low in
ionic strength. As the water droplet evaporates the polysaccharide
J. Moffat et al. / Carbohydrate Polymers 148 (2016) 380–389
387
Fig. 6. (a) Hairpin loop images: Helical xanthan molecules with unravelled ends. (b) white box marked region electronically zoomed, and (c) second hair-pinned molecule.
concentration and ionic strength increases driving xanthan
towards its helical conformation, but not surprisingly there can be
many sections of the chains that do not have time or the correct
conditions to fully re-order. In method 2 the molecules will predominantly be in the helical conformation in the solution due to the
optimal concentration of the divalent counterions in the buffer, and
also the heating/cooling steps in the sample preparation procedure
(Gulrez et al., 2012) before they adsorb to the mica. As can be seen
in the examples images in Figs. 2 b, and 3 b this greatly reduces the
probability of any fully unravelled sections of their conformation.
If the secondary structure of xanthan was one of the other
previous interpretations (Norton et al., 1984) based upon the
measurements of the kinetics of conformational ordering, namely
dimerization of single helices, then two strands would also be a
predictable outcome. Light scattering and optical rotation values
came from point-by point equilibrium measurements, so this was
not a kinetic “time lag” effect but a difference in the temperatures
needed to trigger the onset of conformational ordering and the
increase in molecular weight. Similarly, when the variable was not
temperature but concentration of cadoxen, reduction in molecular
weight began at substantially lower cadoxen concentration than
loss of conformational order. However, that could not be attributed
to slow kinetics of ordering, because the starting point was the
ordered solid. That was interpreted as xanthan initially forming
single helices in the disorder-order transition and then dimerising, but there is visual evidence in this study, which reveals that
xanthan is not likely to be a dimerised single helix. A more recent
study showed that when xanthan solution is treated by high pressure homogenisation there is a significant decrease in the molecular
weight but the measurements of molecular weight per unit contour length of the rod (ML ) suggests it is still double helical, and
even after storage of the solution for 3 days the molecular weight
parameters hardly changed (Gulrez et al., 2012).
Dimerization would be resolvable along the entire ‘fibre’ if the
single helices were parallel-aligned. The only potential reason that
dimerised single helices could be visually concealed until they
become disordered would be if they wrap very compactly around
each other and hence appear as single rather than double fibres.
But in that case the heights of both the ordered sections and
the separated ‘strands’ would not match the values quantified in
Figs. 4 and 5. The ‘strands’ would not drop to such an extent because
the modelled width of xanthan as a single helix was the same value
(1.6 nm) as that of the double helix (Norton et al., 1984) and of
course that means the ordered section if it was composed of two
wrapped single helices would very likely be taller than 1.6 nm.
Another hypothesis is that for dimerised single helices to separate and disorder to reach the low height of the ‘strands’ in all the
unravelled sections visible in the AFM images then the length of
the disordered gap in Fig. 5a would be different than the measure
of the pitch of the ordered section if it was composed of two single
helices that ravel around each other. Therefore, the length of this
unravelled ‘mid-section’ potentially provides further direct visual
388
J. Moffat et al. / Carbohydrate Polymers 148 (2016) 380–389
Fig. 7. (a) Example images of the stability of the xanthan molecules over a 16 hour time period in buffer 1. (a) at 1 hour, (b) at 16 hours, and (c) images overlaid. (For
interpretation of the references to colour in the text, the reader is referred to the web version of this article.)
evidence favouring that the secondary structure of xanthan in its
ordered state is a double helix.
Although this study is based solely upon AFM image data the
conclusion is not just from the visual evidence. The combination
of images with topographical quantification has enabled the interpretation of the AFM data in relation to the previous predictions
of xanthan’s secondary structure from all of the other techniques,
which have been carried out over many years. Therefore, the height
data from all of the ordered and disordered sections visualised in
the AFM images provides confirmation that the xanthan observed
in this study is double helical. Note that these facts are based on
the AFM-observed structures which are of course limited to those
that bind to mica and no dimerised single helical versions were
detected in any of the images captured (n = 41, typical molecules
per image = 50–250), but there may still be a possibility that in
solution stochastic variations in xanthan’s confirmation can exist
due to molecular mobility. It is therefore possible that the controversy over single or double helix formation may have arisen due to
experiments done under different experimental conditions which
favoured intra- or inter-molecule association: double helices can
form by intra-molecular association of single chains.
It is interesting to consider stereo-chemical reasons why the
helical structure is composed of two interacting chains. The nature
of the primary structure of xanthan suggests that the distribution of sidechains along the backbone results in an uncharged
and a charged face of the cellulosic backbone. Association of
the uncharged faces of the backbone, and a twist into a 5-fold
helix to optimise the distribution of charge on the helix, could
explain the formation of the double helix. This would be consistent
with intra-molecular association (anti-parallel) or inter-molecular
(anti-parallel or parallel) association. Such a model would be consistent with the observed 6-fold helical complex with a pitch
of 5.6 ± 0.1 nm, formed between the xanthan-like polysaccharide acetan and the glucomannan konjac mannan (Ridout, Cairns,
Brownsey, & Morris, 1998) and the proposed double helical structure, which contains both a konjac mannan (uncharged) and a
single acetan chain (charged) within the helix (Chandrasekaran,
Janaswamy, & Morris, 2003). Acetan like xanthan forms a 5-fold
helix with a pitch of 4.8 nm (Morris, Brownsey, Cairns, Chilvers, &
J. Moffat et al. / Carbohydrate Polymers 148 (2016) 380–389
Miles, 1989). The transition to a 6-fold helix could result from the
different optimised distribution of charge along the helical complex.
5. Conclusions
The ability of AFM to resolve polysaccharide molecules at
sub-molecular resolution and the distorting effect of the heterogeneously charged substrate, mica, has provided the first ever direct
visual evidence which confirms that the proposed anti-parallel
double helical ultrastructure of xanthan can be formed through
intra-molecular association. For the majority of ordered structures,
which do not show the presence of loops, both anti-parallel and
parallel models for the double helix formed by inter-molecular
association are possible. The data in this study confirms that the
precision of the formation of xanthan’s secondary helical structure
is indeed sensitively driven by an optimisation of intra-molecular
charge screening. The AFM data suggests that xanthan’s predominant equilibrium structural conformation is a double helix.
Acknowledgments
The authors thank Edwin Morris(University College Cork) for
discussions on the scientific principles of the potential variations
in xanthan’s ordered structural arrangements. Thanks are also due
to Neil Wilson (University of Warwick) for taking part in some of
the successful imaging of xanthan helices at the RMS MMC2015
conference in Manchester. Funding for this work was provided by
BBSRC through its core strategic grant to IFR.
References
Bejenariu, A., Popa, M., Picton, L., & Le Cerf, D. (2010). Effect of concentration, pH
and temperature on xanthan conformation: a preliminary study before
crosslinking. Revue Roumaine de Chimie, 55, 147–152.
Brunchi, C.-E., Morariu, S., & Bercea, M. (2014). Intrinsic viscosity and
conformational parameters of xanthan in aqueous solutions: salt addition
effect. Colloids and Surfaces B: Biointerfaces, 122, 512–519.
Chakraborty, A. K., & Bratko, D. (1998). A simple theory and Monte Carlo
simulations for recognition between random heteropolymers and disordered
surfaces. Journal of Chemical Physics, 108, 1676–1682.
Chandrasekaran, R., Janaswamy, S., & Morris, V. J. (2003). Acetan:glucomannan
interactions: a molecular modeling study. Carbohydrate Research, 338,
2889–2898.
Garcia-Ochoa, F., Santos, V. E., Casas, J. A., & Gomez, E. (2000). Xanthan gum:
production, recovery, and properties. Biotechnology Advances, 18, 549–579.
Golumbfskie, A. J., Pande, V. S., & Chakroborty, A. K. (1999). Simulation of
biomimetic recognition between polymers and surfaces. Proceedings of the
National Academy of Sciences of the United States of America, 96, 11707–11712.
389
Gulrez, S., Al-Assaf, S., Fang, Y., Phillips, G. O., & Gunning, A. P. (2012). Revisiting
the conformation of xanthan and the effect of industrially relevant treatments.
Carbohydrate Polymers, 90, 1235–1243.
Hansma, H. G., & Laney, G. E. (1996). DNA binding to mica correlates with cationic
radius: assay by atomic force microscopy. Biophysical Journal, 70, 1933–1939.
Kirby, A. R., Gunning, A. P., Morris, V. J., & Ridout, M. J. (1995). Observation of the
helical structure of the bacterial polysaccharide acetan by atomic force
microscopy. Biophysical Journal, 68, 360–363.
Kobayashi, S., Nagayama, S., & Busujima, T. (1998). Lewis acid catalysts stable in
water: correlation between catalytic activity in water and hydrolysis constants
and exchange rate constants for substitution of inner-sphere water ligands. J.
Am. Chem. Soc., 120, 8287–8288.
Kool, M. M., Gruppen, H., Sworn, G., & Schols, H. A. (2013). Comparison of xanthans
by the relative abundance of its six constituent repeating units. Carbohydrate
Polymers, 98, 914–921.
Kool, M. M., Gruppen, H., Sworn, G., & Schols, H. A. (2014). The influence of the six
constituent xanthan repeating units on the order-disorder transition of
xanthan. Carbohydrate Polymers, 104, 94–100.
Matsuda, Y., Biyajima, Y., & Sato, T. (2009). Thermal denaturation, renaturation,
and aggregation of a double-helical polysaccharide xanthan in aqueous
solution. Polymer Journal, 41, 526–532.
Millane, R. P. (1990). Molecular and crystal structures of polysaccharides with
cellulosic backbones. In R. Chandrasekaran (Ed.), Frontiers in carbohydrate
research-2 (pp. 168–190). London and New York: Eslevier Appled Science.
Millane, R. P., & Narasaiah, T. V. (1990). X-ray fiber diffraction studies of a variant
of xanthan gum in which the sidechain terminal mannose unit is absent.
Carbohydrate Polymers, 12, 315–321.
Moorhouse, R., Walkinshaw, M. D., & Arnott, S. (1977). Xanthan gum molecular
conformation and interactions. In Sandford, P. A. Sandford, & A. Laskin (Eds.), In
extracellular microbial polysaccharides (Vol. 45) (pp. 90–102). San Francisco, CA.
USA: ACS Symp. Ser.
Morris, V. J. (1998). Gelation of polysaccharides. In S. E. Hill, D. A. Ledward, & J. R.
Mitchell (Eds.), Functional properties of food macromolecules (2nd ed., Vol. 45,
pp. 143–226). Aspen Publishers. ISBN0 7514 0421 7.
Morris, V. J., Brownsey, G. J., Cairns, P., Chilvers, G. R., & Miles, M. J. (1989).
Molecular origins of acetan solution properties. International Journal of
Biological Macromolecules, 11, 326–328.
Morris, V. J., Kirby, A. R., & Gunning, A. P. (2009). Atomic force microscopy for
biologists (2nd ed.). London: Imperial College Press. ISBN-10: 184816467X
(Chapter 2).
Norton, I. T., Goodall, D. M., Frangou, S. A., Morris, E. R., & Rees, D. A. (1984).
Mechanism and dynamics of conformational ordering in xanthan
polysaccharide. Journal of Molecular Biology, 175, 371–394.
Okuyama, K., Arnott, S., Moorhouse, R., Walkinshaw, M. D., Atkins, E. D. T., &
Wolf-Ullish, C. H. (1980). A. D. French, & K. H. Gardner (Eds.), Fiber diffraction
methods (Vol. 141) (pp. 411–427). ACS Symposium Series. />1021/bk-1980-0141.ch026. Chapter 26, ISBN13: 9780841205895eISBN:
9780841207424
Phillips, G. O., & Williams, P. A. (2009). Handbook of hydrocolloids (2nd ed.). Boston:
CRC Press.
Ridout, M. J., Cairns, P., Brownsey, G. J., & Morris, V. J. (1998). Evidence for
intermolecular binding between deacetylated acetan and the glucomannan
konjac mannan. Carbohydrate Research, 309, 375–379.
Sato, T., Kojima, S., Norisuye, T., & Fujita, H. (1984). Double-stranded helix in dilute
solution: further evidence. Polymer Journal, 16, 423–429.
Sato, T., Norisuye, T., & Fujita, H. (1984). Double-stranded helix in dilute solution:
evidence from light scattering. Polymer Journal, 16, 341–350.