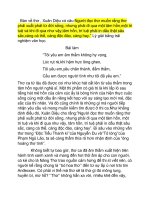
Identifcation of quantitative trait loci for related traits of stalk lodging resistance using genome-wide association studies in maize (Zea mays L.)
Bạn đang xem bản rút gọn của tài liệu. Xem và tải ngay bản đầy đủ của tài liệu tại đây (2.64 MB, 16 trang )
(2022) 23:76
Wu et al. BMC Genomic Data
/>
BMC Genomic Data
Open Access
RESEARCH
Identification of quantitative trait loci
for related traits of stalk lodging resistance
using genome‑wide association studies
in maize (Zea mays L.)
Lifen Wu1†, Yunxiao Zheng1†, Fuchao Jiao2†, Ming Wang2†, Jing Zhang1, Zhongqin Zhang1, Yaqun Huang1,
Xiaoyan Jia1, Liying Zhu1, Yongfeng Zhao1, Jinjie Guo1* and Jingtang Chen1,2*
Abstract
Background: Stalk lodging is one of the main factors affecting maize (Zea mays L.) yield and limiting mechanized
harvesting. Developing maize varieties with high stalk lodging resistance requires exploring the genetic basis of
lodging resistance-associated agronomic traits. Stalk strength is an important indicator to evaluate maize lodging and
can be evaluated by measuring stalk rind penetrometer resistance (RPR) and stalk buckling strength (SBS). Along with
morphological traits of the stalk for the third internodes length (TIL), fourth internode length (FIL), third internode
diameter (TID), and the fourth internode diameter (FID) traits are associated with stalk lodging resistance.
Results: In this study, a natural population containing 248 diverse maize inbred lines genotyped with 83,057 single
nucleotide polymorphism (SNP) markers was used for genome-wide association study (GWAS) for six stalk lodging
resistance-related traits. The heritability of all traits ranged from 0.59 to 0.72 in the association mapping panel. A total
of 85 significant SNPs were identified for the association mapping panel using best linear unbiased prediction (BLUP)
values of all traits. Additionally, five candidate genes were associated with stalk strength traits, which were either
directly or indirectly associated with cell wall components.
Conclusions: These findings contribute to our understanding of the genetic basis of maize stalk lodging and provide
valuable theoretical guidance for lodging resistance in maize breeding in the future.
Keywords: Maize, Stalk lodging resistance, Genome-wide association study, Quantitative trait nucleotides, Candidate
gene
†
Lifen Wu, Yunxiao Zheng, Fuchao Jiao and Ming Wang contributed equally
to this work.
*Correspondence: ;
1
State Key Laboratory of North China Crop Improvement and Regulation,
Hebei Sub-Center for National Maize Improvement Center, College
of Agronomy, Hebei Agricultural University, Hebei Baoding 071001, China
Full list of author information is available at the end of the article
Background
Maize (Zea mays L.) plays an important role in food
security, feed provision, and fuel resources. Nevertheless,
stalk lodging can lead to 5–20% maize yield loss annually worldwide [1]. Achieving high agricultural yields
under different environmental conditions is a major goal
of maize breeders. In low-density populations, the yield
was improved by selecting taller plants to increase the
biomass per plant. In high-density populations, the high
yield was obtained by increasing the population density
© The Author(s) 2022. Open Access This article is licensed under a Creative Commons Attribution 4.0 International License, which
permits use, sharing, adaptation, distribution and reproduction in any medium or format, as long as you give appropriate credit to the
original author(s) and the source, provide a link to the Creative Commons licence, and indicate if changes were made. The images or
other third party material in this article are included in the article’s Creative Commons licence, unless indicated otherwise in a credit line
to the material. If material is not included in the article’s Creative Commons licence and your intended use is not permitted by statutory
regulation or exceeds the permitted use, you will need to obtain permission directly from the copyright holder. To view a copy of this
licence, visit http://creativecommons.org/licenses/by/4.0/. The Creative Commons Public Domain Dedication waiver (http://creativeco
mmons.org/publicdomain/zero/1.0/) applies to the data made available in this article, unless otherwise stated in a credit line to the data.
Wu et al. BMC Genomic Data
(2022) 23:76
of selected medium height plants through the combination of reasonable panicle height coefficient and lodging resistance. Stable quantitative trait loci (QTLs) are
particularly useful in marker-assisted selection [2]. Stalk
lodging is a phenomenon whereby plants collapse from
the upright state, a complicated and integrated quantitative trait caused by many factors, such as the quality
of the stalk itself and the external environmental factors (e.g., climatic and soil conditions, planting density,
fertilization and irrigation, pests and diseases) which
cause irreversible damage to corn stalks and roots [1, 3].
Maize lodging can be divided into three types: root lodging, stem bending, and stem breaking [4]. Stalk lodging
usually occurs at or below the ear node, which consequently influences the regular growth of the ear before
harvest and the final yield of maize [5, 6]. Furthermore,
grain yield per unit area is highly correlated to the plant’s
adaptability to high crop density, but stalk lodging limits planting density and mechanized harvesting [7, 8].
Therefore, improving stalk lodging resistance in maize
would benefit future breeding programs and agricultural
production.
Stalk lodging resistance is correlated with stalk
mechanical strength, hence this variable was used to
evaluate lodging resistance in maize [9, 10]. Common methods to quantify the stalk mechanical strength
include rind penetration, bending, breaking, and vertical crushing [4, 7, 11]. Most studies have found that the
stalk rind penetrometer resistance (RPR) and stalk buckling strength (SBS) are important determinants of crop
lodging resistance. Furthermore, RPR did not damage
the stalk structure [12–14]. Compared with RPR, SBS
is more closely correlated to stalk lodging under natural conditions, as stalk lodging happens in case of overbending [15]. According to previous studies, we found
that lodging occurs most frequently at flowering stage or
a few weeks after flowering and the third or fourth internode of maize plants is extremely sensitive to stalk lodging in the field [6, 8, 13, 16]. Furthermore, Liu et al. [11]
showed that the best period for evaluating stalk strength
is the silking phase or stage after silking. The position of
the stem lodging mainly occurs between the second and
fifth internodes, especially in the third internodes and
the fourth internodes above ground (FIAG) were significantly correlated with RPR and SBS [6, 8, 11, 17, 18]. In
addition, with the increase of plant density, the length of
the base nodes increased significantly, the diameter of
the stems decreased significantly, and the content of cellulose, hemicellulose and lignin decreased, resulting in a
decrease in the mechanical strength of the stems and an
increased risk of lodging [19].
QTL mapping has been widely used in the study of
various agronomic traits, including yield-related traits,
Page 2 of 16
which is a useful tool for analyzing the genetic structure
of complex agronomic traits. In crop, QTL mapping on
lodging have been gradually applied in sorghum, wheat,
rice, especially in maize. For example, a linkage map with
129 SSRs markers was constructed by Hu et al. [6], and
two, three, and two QTLs were detected for the maximum load exerted to breaking (F max), the breaking
moment (M max) and the critical stress (σ max), respectively. Li et al. [12] identified seven QTLs associated with
RPR in two maize recombinant inbred line (RIL) populations using 3072 single nucleotide polymorphisms (SNP)
markers. Zhang et al. [17] identified 44 significant QTLs
for SD, SBS, and RPR using the IBM Syn10 DH population in three environments.
The efficiency and accuracy of QTL mapping depend
largely on the marker density, the variation range of
phenotypes within the population, as well as the population size and type [20]. Genome-wide association
study (GWAS) is a powerful tool for analyzing the
genetic basis of complex traits. So far, GWAS has been
used to analyze many agronomic traits such as plant
height, leaf structure and yield-related traits [21–23],
and other characteristics, i.e. In addition, some genetic
studies on crop lodging have also been carried out
using GWAS. On the contrary, although there are some
GWAS reports on stalk lodging [13, 24], they are still
relatively few, and the molecular mechanism of the variation of corn lodging-related traits is still poorly understood. High-throughput SNP markers have been widely
used to identify genes controlling quantitative traits
[25–28]. Genotyping by sequencing (GBS) is a relatively
inexpensive method to obtain high-density markers for
large populations taking the advantage of next-generation sequencing technologies [29–32].
In this study, an association mapping panel was genotyped by GBS. Based on this, association mapping was
used to identify SNPs and excavate potential candidate
genes on RPR, SBS, and morphological traits associated with stalk lodging resistance. The objectives of this
study were to: (1) identify associated loci for RPR, SBS,
and morphological traits of the stalk of maize; (2) ascertain stable SNPs and predict potential candidate genes in
these regions; (3) dissect the genetic architecture of stalk
lodging resistance-related traits.
Results
Phenotype analysis of the six lodging resistance‑related
traits
The phenotypes of all lodging resistance-related traits
in the association mapping panel are shown in Table 1.
The mean values of RPR, SBS, TID, and FID in the low
plant density were higher than those in the high plant
density. As for TIL and FIL, the mean values in the high
Wu et al. BMC Genomic Data
(2022) 23:76
Page 3 of 16
Table 1 Phenotypic performance for related traits of stalk lodging resistance in the association mapping panel
Trait a
Density b
RPR (N/mm2)
SBS (N/cm2)
TIL(mm)
TID (mm)
FIL (mm)
FID (mm)
Mean ± SD
Range
Skewness
Kurtosis
CV (%)
L
42.55 ± 5.70
29.61–60.78
0.43
0.24
13.39
H
41.06 ± 4.68
29.74–54.51
0.15
-0.22
11.40
L
429.08 ± 67.72
199,98–634.29
0.17
0.90
15.78
H
354.04 ± 60.36
171.08–547.67
0.16
0.33
17.05
L
87.40 ± 9.10
65.60–110.39
0.04
-0.36
10.41
H
90.50 ± 9.62
66.01–115.74
-0.03
-0.13
10.63
L
17.55 ± 1.01
15.53–21.47
0.49
1.01
5.78
H
16.73 ± 1.09
14.31–19.75
0.27
-0.07
6.49
L
103.90 ± 11.49
77.23–133.33
0.08
-0.47
11.06
H
106.99 ± 11.04
79.92–135.88
-0.10
-0.47
10.32
L
17.10 ± 1.00
14.96–20.09
0.39
0.58
5.85
H
16.32 ± 1.08
13.95–19.29
0.22
0.10
6.60
a
RPR, SBS, TIL, TID, FIL, and FID stand for rind penetrometer strength, stalk bending strength, third internode length, third internode diameter, fourth internode
length, and fourth internode diameter, respectively
b
L stands for low plant density, H stands for high plant density
plant density were higher than the mean values in the
low plant density. For the six traits mentioned above,
the skewness and kurtosis were less than 1, indicating
that these traits followed a normal distribution. Furthermore, the coefficients of variation (CV) of these
traits in the plant densities examined in this study
ranged from 5.78–15.78% and 6.49–17.05%, respectively (Table 1).
ANOVA showed that the environment effects, density effects, genotype effects and interactive effects
between the genotype and environment were both
significant for six traits in the association mapping
panel (Table 2). For the association mapping panel, the
broad-sense heritability (h2B) of all traits in low and
high plant densities ranged from 0.59 to 0.72 and 0.61
to 0.71, respectively (Table 2), suggesting that variations of stalk strength traits were mainly controlled by
genetic factors.
The results of the correlation analysis between the
six traits of stalk strength at two densities for the maize
inbred lines are shown in Fig. 1. In the correlation analysis, the consistency of all trait correlations between the
two densities highly coincided with the results of GWAS.
In addition, there was a strongly significant positive correlation between traits between SBS and RPR, SBS and
TID as well as SBS and FID.
GWAS for stalk lodging resistance related‑traits
For RPR, a total of 29 significant SNPs were detected
and located on chromosomes 1, 2, 3, 4, 5, 6, 7, 8, 9, 10
Table 2 Analysis of variance (ANOVA) for related traits of stalk lodging resistance under two plant densities in the association mapping
panel
Trait a
h2B
F-value
Environment
Density
Genotype
Environment × Genotype
Density × Genotype
Low plant
density
High
plant
density
RPR
477.91**
22.52**
11.36**
2.90**
1.73**
SBS
**
**
**
**
204.10
432.13
0.62
0.61
11.56
2.01
2.21**
0.67
0.65
TIL
47.41**
79.48**
10.76**
1.76**
1.12
0.66
0.70
TID
443.44**
87.55**
10.45**
1.78**
1.21*
0.59
0.67
FIL
310.40**
121.74**
11.21**
1.67**
0.79
0.72
0.71
FID
**
**
**
1.84**
1.28*
0.61
0.68
322.96
a
86.36
11.21
RPR, SBS, TIL, TID, FIL, and FID stand for rind penetrometer strength, stalk bending strength, third internode length, third internode diameter, fourth internode
length, and fourth internode diameter, respectively
*
Significant at P < 0.05
**
Significant at P < 0.01
Wu et al. BMC Genomic Data
(2022) 23:76
Page 4 of 16
Fig. 1 Correlation analysis of lodging resistance-related traits under two plant densities in the association mapping panel. A and B stand for low
plant density and high plant density, respectively. * Significant at P < 0.05. ** Significant at P < 0.01
Wu et al. BMC Genomic Data
(2022) 23:76
at all environments, which explained 11.10-16.07% of the
phenotypic variation. For SBS, a total of 32 SNPs were
detected across all environments, which explained phenotypic variation ranging from 9.29-17.69%. For other
lodging resistance traits, the number of SNPs detected
for TIL, TID, FIL and FID was 36, 53, 31 and 47, respectively, and accounted for phenotypic variation ranging
from 12.31-20.72%, 11.23-18.50%, 13.96-23.59%, and
10.92%-17.44%, respectively (Table S1).
In total, 33 SNPs detected of different traits under
same environment and density and explained phenotypic variation ranging from 11.23% to 20.70% (Table 3).
Moreover, 2 significant SNPs for TIL were commonly
detected across different environments, among which,
Chr1_289271328 were identified in 2015BD, 2016BD and
2016SJZ at under high density and Chr2_54407952 were
identified in 2016SJZ under low density and high density,
with explanation of phenotypic variation range from is
14.97% to 18.14%. Moreover, one SNP, Chr2_233691764,
was collocated for SBS, TID and FID on chromosomes 2
(Table 3).
To minimize the effect of environmental variation,
the BLUP values were used to examine associations. In
total, we identified the number of SNP for each trait by
BLUP data, 6 for RPR, 3 for SBS, 10 for TIL, 8 for TID,
8 for FIL, 7 for FID at low plant density and 5 for RPR,
9 for SBS, 7 for TIL, 5 for TID, 7 for FIL, 6 for FID at
high plant density (Fig. 2 and Table S2). The percentage of phenotypic variation explained by the identified
SNPs (R2) for six traits ranged from 13.30 to 21.13% and
from 10.10 to 21.01% at low and high plant densities,
respectively (Table S2). The Manhattan plots and Quantile–quantile (Q-Q) plots between the six related traits
of stalk strength at two densities are shown in Figs. 3
and 4. In addition, 14 important SNPs was detected of
different traits at same density by BLUP value, which
were located on chromosomes 2, 3, 4, 5, 8, 9 and 10
(Table 4).
Candidate genes associated with significant SNPs
The physical locations of the SNPs were recorded using
the B73 RefGen_v2 (www.maizesequence.org) based on
the LD decay distance. A total of 346 candidate genes
with gene descriptions were found (Table S3). The number of candidate genes involved in the six stalk lodging resistance related-traits of RPR, SBS, TIL, TID, FIL,
and FID were 55, 78, 117, 37, 51, and eight, respectively.
From the GO analysis results of the candidate genes in
biological processes are mainly concentrated in the
metabolic and cellular process, those influencing cellular component are mainly found in the intracellular and
Page 5 of 16
cellular anatomical entity, and those influencing molecular functions are mainly found in catalytic activity and
binding (Fig. 5). As for the KEGG analysis of the candidate genes, a total of 13 pathways were identified (Fig. 6).
These pathways included the carbon metabolism, ubiquitin mediated proteolysis, starch and sucrose metabolism, beta-alanine metabolism, pyrimidine metabolism,
etc., which could be related to the stalk lodging. Among
them, the pathway with the largest number of genes is
the metabolic pathways, which have 36 candidate genes.
Furthermore, we identified seven candidate genes to be
associated with stalk lodging resistance (Table 5). Annotation information suggested that these candidate genes
may control multiple traits during maize growth and
development.
Discussion
Phenotypic variation, heritability, and correlations of traits
In general, obtaining an accurate measurement of phenotypic traits is essential to obtain reliable association
results. The six traits investigated in this study exhibited
large phenotypic variations with a normal distribution. A
previous study showed that relatively high heritability will
determine the power of QTL detection [33]. Our genetic
analysis shows that the heritability of RPR and SBS ranged
from 0.61 to 0.80. It was much higher than the range of
0.08–0.34 in a nested association population of maize [1].
The relatively high heritability in this study shows the predominant role of genetic factors for these traits.
There were significant correlations between each pair
of stalk lodging resistance-related traits in this study,
for instance: between RPR and SBS, which is consistent
with previous results [13, 17]. Our study showed that the
stalk strength traits decreased gradually with increasing density, which was consistent with previous findings
[11, 34]. In the association mapping panel, a significant
correlation was detected between SBS, TID, and FID. By
contrast, the correlation between SBS, TIL and FIL was
significantly negative, indicating that stalk strength traits
are negatively associated with internode length and width
at the population level. The above results suggest that
some genetic factors were shared among these stalk lodging resistance-related traits.
Mapping analysis
Compared with traditional QTL mapping, GWAS covers a wide range of genetic diversity and more allelic
polymorphisms, which could exploit the short linkage
disequilibrium distance and help to pinpoint the functional genes of target traits using high-density molecular
markers.
Wu et al. BMC Genomic Data
(2022) 23:76
Page 6 of 16
Table 3 Important SNPs detected of different traits under same environment and density
Environment
Densitya
Traits
SNP
Chr
Position (bp) b
P-value
Allele
bin
PVE (%)
2015BD
L
SBS
Chr2_233691764
2
233,691,764
1.23E-05
C/G
2.09
13.55
TID
Chr2_233691764
2
233,691,764
2.10E-05
C/G
2.09
16.43
FID
Chr2_233691764
2
233,691,764
5.34E-05
C/G
2.09
14.90
TID
Chr2_101115591
2
101,115,591
5.37E-05
A/G
2.05
15.25
RPR
Chr6_113876033
6
113,876,033
4.13E-05
G/T
6.04
11.98
TID
Chr6_129298262
6
129,298,262
4.52E-05
C/T
6.05
15.80
TID
Chr6_129298294
6
129,298,294
4.67E-05
A/C
6.05
15.86
FID
Chr6_129298262
6
129,298,262
2.86E-05
C/T
6.05
15.55
FID
Chr6_129298294
6
129,298,294
3.58E-05
A/C
6.05
15.57
TIL
Chr1_289271328
1
289,271,328
1.58E-05
C/T
1.11
18.14
TID
Chr2_101115591
2
101,115,591
3.06E-05
A/G
2.05
16.94
TIL
Chr2_157483756
2
157,483,756
5.14E-05
C/T
2.06
17.00
FIL
Chr2_157483756
2
157,483,756
7.13E-06
C/T
2.06
20.70
TID
Chr2_11053123
2
11,053,123
9.32E-05
A/G
2.02
15.54
FID
Chr2_11053123
2
11,053,123
9.69E-05
A/G
2.02
14.53
RPR
Chr6_113876033
6
113,876,033
4.24E-05
G/T
6.04
11.84
TIL
Chr9_26826507
9
26,826,507
5.79E-06
C/T
9.03
19.48
FIL
Chr9_26826507
9
26,826,507
4.94E-05
C/T
9.03
18.65
TID
Chr1_159420156
1
159,420,156
3.03E-05
C/T
1.05
15.68
FID
Chr1_159420166
1
159,420,166
4.18E-05
C/T
1.05
16.59
TID
Chr1_251713297
1
251,713,297
3.36E-05
G/T
1.09
17.43
FID
Chr1_251713297
1
251,713,297
9.44E-05
G/T
1.09
15.62
TID
Chr2_209021682
2
209,021,682
4.15E-05
C/T
2.08
17.47
FID
Chr2_209021682
2
209,021,682
9.88E-05
C/T
2.08
15.83
TID
Chr2_4671519
2
4,671,519
9.11E-05
C/T
2.02
16.75
FID
Chr2_4671519
2
4,671,519
3.25E-05
C/T
2.02
17.32
TID
Chr4_79001631
4
79,001,631
5.25E-05
G/T
4.05
17.53
FID
Chr4_79001631
4
79,001,631
7.59E-05
G/T
4.05
16.45
TID
Chr1_256791485
1
256,791,485
4.71E-05
A/G
1.09
14.17
FID
Chr1_256791485
1
256,791,485
1.82E-05
A/G
1.09
13.16
TID
Chr4_175218919
4
175,218,919
7.09E-05
A/G
4.07
14.51
FID
Chr4_175218919
4
175,218,919
7.45E-05
A/G
4.07
12.32
FIL
Chr6_98760375
6
98,760,375
3.80E-05
C/T
6.03
15.70
TIL
Chr1_289271328
1
289,271,328
1.58E-05
C/T
1.11
18.14
FIL
Chr6_98760375
6
98,760,375
4.00E-05
C/T
6.03
16.05
TIL
Chr6_147922112
6
147,922,112
1.22E-05
C/T
6.05
17.33
FIL
Chr6_147922112
6
147,922,112
6.47E-05
C/T
6.05
15.17
H
2015SJZ
L
H
2016BD
L
H
Wu et al. BMC Genomic Data
(2022) 23:76
Page 7 of 16
Table 3 (continued)
Environment
Densitya
Traits
SNP
Chr
Position (bp) b
P-value
Allele
bin
PVE (%)
2016SJZ
L
TID
Chr1_148452951
1
148,452,951
2.91E-05
G/T
1.05
15.33
FID
Chr1_148452951
1
148,452,951
7.54E-06
G/T
1.05
16.33
TID
Chr1_148452943
1
148,452,943
5.60E-05
C/G
1.05
15.29
FID
Chr1_148452943
1
148,452,943
4.91E-05
C/G
1.05
14.89
TID
Chr2_54407952
2
54,407,952
3.00E-05
C/T
2.05
15.50
TIL
Chr2_216932638
2
216,932,638
3.76E-05
A/G
2.08
16.81
FIL
Chr2_216932638
2
216,932,638
3.15E-05
A/G
2.08
16.12
TIL
Chr2_216932653
2
216,932,653
6.35E-05
A/C
2.08
15.93
FIL
Chr2_216932653
2
216,932,653
2.51E-05
A/C
2.08
16.09
TID
Chr2_45966977
2
45,966,977
4.37E-05
C/G
2.04
15.39
FID
Chr2_45966977
2
45,966,977
4.88E-05
C/G
2.04
14.68
TID
Chr3_191764915
3
191,764,915
8.68E-06
A/C
3.07
16.38
FID
Chr3_191764915
3
191,764,915
1.06E-05
A/C
3.07
15.49
TID
Chr4_235448449
4
235,448,449
7.48E-05
A/G
4.09
14.25
FID
Chr4_235448449
4
235,448,449
4.44E-05
A/G
4.09
14.24
TIL
Chr1_289271328
1
289,271,328
7.74E-05
C/T
1.11
16.66
TID
Chr2_54407952
2
54,407,952
2.19E-06
C/T
2.04
16.10
FID
Chr2_54407952
2
54,407,952
1.57E-06
C/T
2.04
14.97
TID
Chr2_54407976
2
54,407,976
4.52E-06
C/T
2.04
15.48
FID
Chr2_54407976
2
54,407,976
5.07E-06
C/T
2.04
14.76
TID
Chr2_12921336
2
12,921,336
5.30E-05
A/C
2.02
11.99
FID
Chr2_12921336
2
12,921,336
3.41E-05
A/C
2.02
12.37
TID
Chr2_12921363
2
12,921,363
9.33E-05
C/T
2.02
11.23
FID
Chr2_12921363
2
12,921,363
4.23E-05
C/T
2.02
12.00
TID
Chr3_8597909
3
8,597,909
5.23E-05
A/G
3.02
11.91
FID
Chr3_8597909
3
8,597,909
4.64E-05
A/G
3.02
11.93
TIL
Chr5_10438064
5
10,438,064
8.53E-05
C/T
5.02
16.56
FIL
Chr5_10438064
5
10,438,064
7.21E-05
C/T
5.02
14.30
TID
Chr5_125087688
5
125,087,688
4.98E-05
A/G
5.04
12.19
FID
Chr5_125087688
5
125,087,688
4.32E-05
A/G
5.04
11.67
H
Hu et al. [8] detected ten QTLs for RPR and three
QTLs for Internode diameter (InD) by applying
the RIL population. In this study, we used GWAS
to identify some RPR-related SNPs, among which
Chr7_163048364 (bin7.04) and Chr8_88680106
(bin8.03) were located in the chromosomal region with
Hu et al. [8]. In addition, Chr4_203233149 (bin4.08) and
Chr8_67356036 (bin8.03) for TID and FID identified by
the GWAS analysis locates exactly in the interval of the
InD QTLs detected by Hu et al. [8]. Liu et al. [11] identified pleiotropic QTL, pQTL6-2, was association with
RPR, whose confidence interval encompassed 16 QTLs,
its genomic region is coincided with the physical position Chr6_158343036 (158 Mb) in this study. In addition, the SNP Chr1_272576164 (272 Mb) was detected
association with SBS in this study also have same physical position with Liu et al. study. The remaining SNPs
Wu et al. BMC Genomic Data
(2022) 23:76
Page 8 of 16
Fig. 2 Stable SNPs were repeatedly detected in the two planting densities and the BLUP model, which were associated with six stalk lodging
resistance-related traits. The significance threshold is –log10 (P-value) = 4.0. LD represent low plant density, HD represent high plant density,
respectively. Purple represents third internodes length, Red represents fourth internode length, Blue represents third internode diameter, Orange
represents fourth internode diameter, Yellow represents rind penetrometer resistance and Green represents stalk buckling strength, respectively
in this study were first reported to be associated with
lodging resistance-related traits in maize.
Co‑localization of SNPs for stalk lodging resistance traits
The SNP repeatedly detected in multiple environments
is generally considered a stable SNP. Stably expressed
SNPs detected in this study, five co-localized SNPs
(Chr4_66017316, Chr4_16211307, Chr4_203233149,
Chr4_236385528 and Chr8_130686461) were simultaneously identified under two plant densities. These stable SNPs were insensitive to the external environment
and were hence considered to be important loci for the
improvement of stalk lodging traits, as such, they can
provide references for further gene cloning. Meanwhile,
some specific SNPs were detected at high or low plant
densities, respectively, which may be environmentallyspecific loci requiring further genetic mapping.
From the comparison, we found some co-located
locus in different densities in the same environment,
but extremely few stable sites in different environments.
The reason we detected less consistent loci in different
environments may be because stalk strength trait itself
is a relatively complex quantitative trait and is greatly
affected by the environment. In addition, we found that
the heritability of these traits is relatively low. This reason was further confirmed. From the results of the phenotypic correlation analysis, the correlation coefficient
of both TID and FID was as high as 0.97 at both densities. Similarly, we located three SNPs (Chr4_16211307,
Chr4_203233149, Chr8_130686461) associated with
both TID and FID at both densities, this confirms the
views of previous, phenotypic correlations between
quantitative traits may derive from the correlation
between QTL controlling them [35]. However, there
were a large number of SNPs that did not co-located,
indicating that lodging-related traits in maize seem to be
Wu et al. BMC Genomic Data
(2022) 23:76
Page 9 of 16
Fig. 3 Manhattan plots and QQ plots for the six traits at the low plant density. A Rind penetrometer strength. B Stalk bending strength. C Third
internode length. D Third internode diameter. E Fourth internode length. F Fourth internode diameter
Wu et al. BMC Genomic Data
(2022) 23:76
Page 10 of 16
Fig. 4 Manhattan plots and QQ plots for the six traits at the high
plant density. A Rind penetrometer strength. B Stalk bending
strength. C Third internode length. D Third internode diameter. E
Fourth internode length. F Fourth internode diameter
controlled not only by several major QTLs but also by
multiple micro-effect QTLs in specific locations or environments [36].
Candidate genes analysis
We identified 346 candidate genes in total located
around common loci for stalk lodging resistancerelated traits, which are involved in a variety of
biochemical metabolic pathways. Based on the information of the gene model on MaizeGDB (Table S3),
seven potential candidate genes related to RPR, SBS,
TIL, FIL and FID were obtained (Table 5). Notably,
some candidate genes correlated to stalk lodgingrelated traits were related to cellulose and lignin biosynthesis, essential for the cell wall development in the
plant stem. For instance, beta-amylase (AMY), betaglucosidase (GLU), UDP-glycosyltransferase (UGT),
and protein kinase played an essential role in the synthesis of cell wall components [37]. Indeed, modify
the expression of a transcription factors by changing
the mRNA abundance of downstream target genes to
change the biosynthesis of lignin and he lodging resistance of stalk can be increased [38]. Interestingly, seven
candidate genes were found to be related to cell wall
components in this study (Table 5). GRMZM2G074792,
which is located in Chr6_158343036 of RPR, encodes
xyloglucan glycosyltransferase and related to plant cell
wall cellulose synthesis, which is the major source of
cellulose-harbours enzyme [39]. GRMZM2G300412,
encoded for UDP-glucuronic acid decarboxylase,
was located in Chr1_272576164 of SBS, involving in
metabolic pathways and amino sugar and nucleotide
sugar metabolism. GRMZM2G072526 was located in
Chr7_160255239 and Chr7_160255241, controlling
SBS, whose encoded glucan endo-1,3-beta-glucosidase is mainly involved in carbohydrate metabolism,
it is associated with cell wall synthesis, which may be
related to maize lodging. Previous studies demonstrated that UDP-glucuronic acid decarboxylase was
a key enzyme in the synthesis of UDP-xylose for the
formation of xylans during cell wall biosynthesis [40].
GRMZM2G111344, was located in Chr5_15958677
of TIL, encoding for UDP-glycosyltransferase (UGT),
involved in flavonoid biosynthesis and biosynthesis of
secondary metabolites. According to previous studies,
UGT was the key precursors of cell wall carbohydrates
Wu et al. BMC Genomic Data
(2022) 23:76
Page 11 of 16
Table 4 Important SNPs detected of different traits by BLUP value
Number
SNP
Traits
Density a
Chr
Position(bp)b
Allele
1
Chr4_66017316
RPR
L
4
66,017,316
C/T
RPR
H
4
66,017,316
C/T
TIL
L
2
231,360,274
FIL
L
2
TID
H
FID
2
Chr2_231360274
3
Chr3_99647159
4
Chr4_16211307
5
Chr4_199957809
6
Chr4_203233149
7
Chr4_236385528
8
Chr5_48630086
9
Chr5_48630116
10
Chr5_174286151
11
Chr8_67356036
12
Chr8_130686461
13
14
Chr9_133921410
Chr10_148095509
P-value
PVE (%)
4.05
3.52E-05
16.10%
4.05
8.47E-05
16.90%
C/G
2.09
5.95E-05
19.56%
231,360,274
C/G
2.09
2.27E-05
20.46%
3
99,647,159
A/G
3.04
4.86E-05
16.51%
H
3
99,647,159
A/G
3.04
3.19E-05
15.67%
TID
L
4
16,211,307
A/G
4.03
6.74E-05
18.06%
FID
L
4
16,211,307
A/G
4.03
2.05E-05
18.00%
TID
H
4
16,211,307
A/G
4.03
2.51E-05
17.60%
FID
H
4
16,211,307
A/G
4.03
1.45E-05
16.94%
TIL
L
4
199,957,809
A/T
4.08
6.93E-05
19.26%
FIL
L
4
199,957,809
A/T
4.08
6.35E-05
18.22%
TID
L
4
203,233,149
A/C
4.08
3.66E-05
18.41%
FID
L
4
203,233,149
A/C
4.08
3.39E-05
17.16%
TID
H
4
203,233,149
A/C
4.08
3.56E-05
16.97%
FID
H
4
203,233,149
A/C
4.08
2.03E-05
16.31%
TID
L
4
236,385,528
G/T
4.09
2.25E-05
19.25%
FID
L
4
236,385,528
G/T
4.09
1.29E-05
18.54%
FID
H
4
236,385,528
G/T
4.09
5.61E-05
15.46%
TIL
H
5
48,630,086
C/T
5.03
4.05E-05
20.21%
FIL
H
5
48,630,086
C/T
5.03
6.16E-05
18.07%
TIL
H
5
48,630,116
A/G
5.03
4.05E-05
20.21%
FIL
H
5
48,630,116
A/G
5.03
6.16E-05
18.07%
TIL
H
5
174,286,151
C/T
5.05
1.64E-05
20.70%
FIL
H
5
174,286,151
C/T
5.05
7.84E-05
17.30%
TID
L
8
67,356,036
C/T
8.03
2.08E-05
19.89%
FID
L
8
67,356,036
C/T
8.03
6.39E-05
17.34%
TID
L
8
130,686,461
C/T
8.05
1.11E-05
20.19%
FID
L
8
130,686,461
C/T
8.05
1.46E-05
18.59%
TID
H
8
130,686,461
C/T
8.05
1.17E-05
18.64%
FID
H
8
130,686,461
C/T
8.05
6.09E-05
15.52%
TIL
H
9
133,921,410
C/G
9.05
4.81E-05
21.01%
FIL
H
9
133,921,410
C/G
9.05
5.93E-05
19.14%
FIL
L
10
148,095,509
A/T
10.07
2.66E-05
19.75%
TIL
H
10
148,095,509
A/T
10.07
9.83E-05
20.05%
a
L means low plant density, H means high plant density
b
physical position of the SNP loci according to B73 RefGen_v2
[37]. These descriptions indicate that regulation of
the expression of these genes may affect cell wall formation. The candidate genes GRMZM2G007899 and
GRMZM2G311059, were located in Chr10_139852648
of TIL, showed high expression of MYB transcription factor had increased ectopic lignin and the xylem
vessels were regular and open, are related transcriptional activators of the lignin biosynthetic pathway
during secondary cell wall formation in Arabidopsis
[41, 42]. In rice, GRMZM2G021051 was located in
bin
Chr2_233691559 of FIL, whose the homologous with
shortened basal internodes, is a new rice lodgingresistance gene and encodes a gibberellin (GA) 2-oxidase and can control the elongation of internodes at
the base of the stem by regulating the activity of the
GA [43]. GRMZM2G408462, which is located in
Chr3_212705423 of FID, encoded for WRKY transcription factor, whose directly regulate expression of
the major monolignol biosynthetic genes and genetic
modification of genes involved in lignin biosynthesis [44, 45]. Although the role of these genes in maize
Wu et al. BMC Genomic Data
(2022) 23:76
Page 12 of 16
Fig. 5 GO-second class of candidate gene
requires further investigation, they should be used as
target sites for the development of maize lines resistant
to lodging.
Conclusion
In this study, we identified 6, 3, 10, 8, 8, 7 SNPs associated with RPR, SBS, TIL, TID, FIL, FID at low plant
density and 5, 9, 7, 5, 7, 6 SNPs associated with RPR,
SBS, TIL, TID, FIL, FID at high plant density, respectively, via GWAS. Most markers were located within
or close to QTLs identified in previous studies. We
were particularly interested in the seven potential
candidate genes that were predicted based on functional annotations, but further investigation is needed
for verification of this hypothesis. These findings shed
light on the genetic basis of six stalk lodging resistance
related-traits, and candidate genes could be used for
further positional cloning.
Materials and methods
Plants materials and field experiments
A total of 248 diverse maize inbred lines were used to
form an association mapping panel. All lines were grown
according to the split-plot set two densities, two replicates for each density, and a low density of 75,000 plants/
ha and a high density of 105,000 plants/ha. The work was
performed at the Experimental Station of Hebei Agricultural University in Baoding and Shijiazhuang in 2015
Wu et al. BMC Genomic Data
(2022) 23:76
Page 13 of 16
Fig. 6 Analysis of KEGG pathway based on candidate genes (The figure was created by R version 3.6.1 based on KEGG pathway database www.
kegg. jp/ kegg/ kegg1. html)
Table 5 Putative candidate gene of stalk lodging resistance-related traits
Trait
SNP
Bin
Candidate gene
Gene ID
RefGen_v2 Annotated Gene description
RPR
Chr6_158343036
6.06
GRMZM2G074792
103,630,593
probable xyloglucan glycosyltransferase
SBS
Chr1_272576164
1.1
GRMZM2G300412
109,942,298
UDP-glucuronic acid decarboxylase
SBS
Chr7_160255239,
Chr7_160255241
7.04
GRMZM2G072526
100,282,931
glucan endo-1,3-beta-glucosidase
TIL
Chr5_15958677
5.03
GRMZM2G111344
100,381,816
UDP-glycosyltransferase
TIL
Chr10_139852648
10.06
GRMZM2G007899
541,747
MYB transcription factor
FIL
Chr2_233691559
2.09
GRMZM2G021051
100,217,010
gibberellin 20-oxidase
FID
Chr3_212705423
3.08
GRMZM2G408462
103,651,407
WRKY transcription factor
GRMZM2G311059
and 2016. For each replicate, each line was grown in a
3-m long single-row plot, with a 0.6-m inter-row spacing.
All of the plant materials used in our study were derived
from the China Agricultural University and National
Maize Improvement Center of China.
Phenotype evaluation
Based on previous studies on stalk lodging resistance in
maize, we decided to measure morphological traits and
stalk strength during one week after grain filling [11].
Five representative plants of each line from each replicate
were selected for evaluation and the mean values for each
line were computed for each trait. The TIL, FIL, TID, and
Wu et al. BMC Genomic Data
(2022) 23:76
FID were measured using electronic micrometers. At
the same time, morphological characters were measured
with the same material, RPR and SBS were measured in
the middle of the flat side of the third and fourth internode of the stalk using a stalk strength appliance YYD-1
(Zhejiang TopuYunnong Science and Technology Co.,
Ltd, Zhejiang, China). At the base of the stem, the middle part of the third and fourth internodes is inserted
at a constant speed and perpendicular to the direction
of the stem, and the maximum penetration of the stem
epidermis is read. Similarly, the bending strength of the
stalk is also pressed at the center of the stalk at a uniform
speed, and the force should not be too strong and record
the value. The range of measurement was between 5 and
500 N, with a resolution of 0.1 N; reported units of RPR
and SBS are in N/mm2 and N, respectively.
Statistical analysis of phenotypic data
The mean value of each inbred line for each trait was
used for descriptive statistical analysis. Analysis of variance (ANOVA) was carried out with SPSS19.0 for related
traits of stalk lodging resistance under two plant densities
in the association mapping panel. Broad-sense heritability (h2B) was calculated according to Knapp et al. [46].
2
h2B = σg2 /(σg2 + σge
/e + σε2 /re)
2 is the interactive
where σg2 is the genetic variance, σge
2
effect of genotype × environment, σε is the error variance, e is the number of environments, and r is the number of replications in a given environment.
The best linear unbiased prediction (BLUP) of the phenotypic values of each line was calculated across all environments using the R package “lme4” [47]. The BLUP
value of each line was used for the GWAS analysis. The
correlation analysis was performed using the “Performance Analytics” package in R.
Genotyping
The GBS method was used to genotype the 248 inbred
lines of the association panel [29]. First, the genomic
DNA was extracted from leaves of maize under normal
growth conditions using the cetyltrimethylammonium
bromide (CTAB) method [48]. The DNA concentration
and integrity were measured with NanoDrop 2000 instrument (Thermo Fisher Scientific, Waltham, MA, USA) and
agarose gel electrophoresis, respectively. The extracted
DNA of each line was digested using the restriction
enzyme ApeKI and ligated with bar code. The DNA samples of certain numbers were mixed, purified, amplified,
purified again, and chosen according to fragment length.
Those fragments were evaluated using the length test,
Paired-End-Tag by Illumina Hiseq2000. Then selected
Page 14 of 16
sequences were aligned to the B73 reference genome
(the second version) using the BWA software, followed
by SNP calling using Samtools [49]. SNPs with a missing
rate < 0.2 and minor allele frequency (MAF) > 0.05 were
selected. Finally, a total of 83,057 SNPs were used for the
GWAS analysis. The PLINK 1.90 beta software was used
to estimate LD between pairs of SNPs within 200 kb in
the genomic region based on the Hill and Weir method
[50, 51]. The LD decay distance for this association mapping panel was 120 kb (r2 = 0.1) based on previous study
[52, 53]. The population structure (Q) was estimated
using the software Admixture 1.3, while kinship (K) was
estimated using Analysis-Kinship in Tassel 5.0.
Genome‑wide association studies
GWAS data was analyzed with the mixed linear model
(MLM) using the “GAPIT” package in R. The SNP markers of six stalk lodging resistance related-traits in the
association mapping panel together with the Q and K
matrix were used as covariates to decrease spurious
association and detect marker loci combining with target traits. The GWAS analysis is performed with a Bonferroni correction, however this was found to be too
strict for less significant trait associations. Therefore, we
reduced the significance threshold to–log10 (P) ≥ 4 for all
traits [28].
Prediction of candidate genes
The candidate gene analysis was based on the maize
inbred line B73 reference genome version v2 (centering on the marker site and extending 120 kb upstream
and downstream) and searching for the information
and functions of the candidate genes on the MaizeGDB
genome browser (http://www.maizegdb.org/) and NCBI
website (https://www.ncbi.nlm.nih.gov/). Gene ontology (GO) enrichment analysis was performed using the
Gene ontology website (http://www.geneontology.org/).
Kyoto Encyclopedia of Genes and Genomes (KEGG)
pathway enrichment analysis was performed using the
KOBAS version 3.0 (http://kobas.cbi.pku.edu.cn/kobas
3/?t=1) [54].
Abbreviations
RPR: Rind penetrometer resistance; ; SBS: Stalk buckling strength; FIAG: Fourth
internodes above ground; QTL: Quantitative trait loci; RIL: Recombinant inbred
line; SNP: Single nucleotide polymorphisms; GWAS: Genome-wide association study; GBS: Genotyping by sequencing; TIL: Third internodes length; FIL:
Fourth internode length; TID: Third internode diameter; FID: Fourth internode
diameter; ANOVA: Analysis of variance; BLUP: Best linear unbiased prediction;
MAF: Minor allele frequency; GO: Gene ontology; KEGG: Kyoto encyclopedia
of genes and genomes; CV: Coefficients of variation; InD: Internode diameter;
AMY: Beta-amylase; GLU: Beta-glucosidase; UGT: UDP-glycosyltransferase;
MLM: Mixed linear model; CTAB: Cetyltrimethylammonium bromide.
Wu et al. BMC Genomic Data
(2022) 23:76
Supplementary Information
The online version contains supplementary material available at https://doi.
org/10.1186/s12863-022-01091-5.
Additional file 1: Supplementary Table S1. List of genes within the 120
kb upstream and downstream extension of significant SNPs identified via
GWAS. Supplementary Table S2. SNPs detected for lodging resistancerelated traits using BLUP value in the association mapping panel. Sup‑
plementary Table S3. List of genes within the 120 kb upstream and
downstream extension of significant SNPs identified via GWAS.
Acknowledgements
We thank professor Jinsheng Lai of the National Maize Improvement Center,
College of Agronomy, China Agricultural University for providing the maize
population.
Authors’ contributions
LFW, JTC and JJG designed this study. YQH, YFZ, LYZ and XYJ developed the
populations. LFW recorded the data. LFW, YXZ, FCJ and MW analyzed the
data. LFW, YXZ, FCJ and MW drafted the manuscript. LFW, YXZ, FCJ, MW, JJG,
JZ and ZQZ revised the manuscript. All authors read and approved the final
manuscript.
Funding
This work was supported by State Key Laboratory of North China Crop
Improvement and Regulation (NCCIR2021ZZ-10), Science and Technology
Innovation Team of Maize Modern Seed Industry in Hebei (21326319D), Maize
Industry Technology System Genetic and Breeding Positions in Shandong
(SDAIT-02–01).
Availability of data and materials
All data generated or analyzed during this study are included in this published
article and its supplementary information files.
Declarations
Competing interests
The authors declare no competing interests.
Ethics approval and consent to participate
No ethics approval was required. The authors declare that the experimental
methods conducted in this study complied with current Chinese laws and regulations. The seeds of maize used in the study were kindly provided by professor
Jinsheng Lai of the National Maize Improvement Center, College of Agronomy,
China Agricultural University and kept in our lab in the State Key Laboratory of
North China Crop Improvement and Regulation, Hebei Sub-center for National
Maize Improvement Center, College of Agronomy, Hebei Agricultural University.
Consent for publication
Not applicable.
Conflict of interest
The authors declare that they have no conflicts of interest.
Author details
1
State Key Laboratory of North China Crop Improvement and Regulation, Hebei Sub-Center for National Maize Improvement Center, College
of Agronomy, Hebei Agricultural University, Hebei Baoding 071001, China.
2
College of Agronomy, Qingdao Agricultural University, Shandong Qingdao
266109, China.
Received: 23 October 2021 Accepted: 10 October 2022
Page 15 of 16
References
1. Peiffer JA, Flint-García SA, De Leon N, Mcmullen MD, Kaeppler SM, Buckler
ES. The genetic architecture of maize stalk strength. PLoS ONE. 2013;8(6):
e67066.
2. Li W, Liu W, Liu L, You M, Liu G, Li B. QTL mapping for wheat flour color
with additive, epistatic, and QTL × environmental interaction effects. Sci
Agric Sin. 2011;10(5):651–60.
3. Flint-García SA, Mcmullen MD, Darrah LL. Genetic relationship of stalk
strength and ear height in maize. Crop Sci. 2003;43:23–31.
4. Flint-García SA, Jampatong C, Darrah LL, McMullen MD. Quantitative
trait locus analysis of stalk strength in four maize populations. Crop Sci.
2003;43:13–22.
5. Duvick DN, Cassman KG. Post–green revolution trends in yield potential of temperate maize in the north-central united states. Crop Sci.
1999;39(6):1622–30.
6. Hu H, Liu W, Fu Z, Homann L, Technow F, Wang H, et al. QTL mapping of
stalk bending strength in a recombinant inbred line maize population.
Theor Appl Genet. 2013;126(9):2257–66.
7. Appenzeller L, Doblin M, Barreiro R, Wang H, Niu X, Kollipara K, et al. Cellulose synthesis in maize: isolation and expression analysis of the cellulose
synthase (CesA) gene family. Cellulose. 2004;11(3–4):287–99.
8. Hu H, Meng Y, Wang H, Hai L, Chen S. Identifying quantitative trait
loci and determining closely related stalk traits for rind penetrometer resistance in a high-oil maize population. Theor Appl Genet.
2012;124(8):1439–47.
9. Jampatong S, Darrah LL, Krause GF, Barry BD. Effect of one- and twoeared selection on stalk strength and other characters in maize. Crop Sci.
2000;40(3):605–11.
10. Ling G, Huang J, Zhang B, Li T, Zhao M. Effects of population density
on stalk lodging resistant mechanism and agronomic characteristics of
maize. Acta Agron Sin. 2007;40(3–4):199–204.
11. Liu X, Hu X, Li K, Liu Z, Huang C. Genetic mapping and genomic selection
for maize stalk strength. BMC Plant Biol. 2020;20:196.
12. Li K, Yan J, Li J, Yang X. Genetic architecture of rind penetrometer resistance in two maize recombinant inbred line populations. BMC Plant Biol.
2014;14:152.
13. Zhang Y, Liu P, Zhang X, Zheng Q, Chen M, Fei G, et al. Multi-locus
genome-wide association study reveals the genetic architecture of stalk
lodging resistance-related traits in maize. Front Plant Sci. 2018;9:611.
14. Wang X, Zhang R, Shi Z, Zhang Y, Zhao J. Multi-omics analysis of the development and fracture resistance for maize internode. Sci Rep. 2019;9:8183.
15. Sekhon RS, Joyner CN, Ackerman AJ, Mcmahan CS, Robertson DJ. Stalk
bending strength is strongly associated with maize stalk lodging incidence across multiple environments. Field Crop Res. 2020;249: 107737.
16. Meng Y, Li J, Liu J, Hu H, Li W, Liu W, et al. Ploidy effect and genetic architecture exploration of stalk traits using dh and its corresponding haploid
populations in maize. BMC Plant Biol. 2016;16:50.
17. Zhang Y, Liang T, Chen M, Zhang Y, Lübberstedt T. Genetic dissection of stalk
lodging-related traits using an IBM Syn10 DH population in maize across
three environments (Zea Mays L.). Mol Gen Genet. 2019;294(5):1277–88.
18. Xue J, Ming B, Xie R, Wang K, Li S. Evaluation of maize lodging resistance
based on the critical wind speed of stalk breaking during the late growth
stage. Plant Methods. 2020;16(1):148.
19. Xue J, Zhao Y, Gou L, Shi Z, Yao M, Zhao W. How high plant density of
maize affects basal internode development and strength formation. Crop
Sci. 2016;56(6):3295–306.
20. Chen Z, Wang B, Dong X, Liu H, Ren L, Chen J, et al. An ultra-high density
bin-map for rapid QTL mapping for tassel and ear architecture in a large
F2 maize population. BMC Genomics. 2014;15:433.
21. Tian F, Bradbury PJ, Brown PJ, Hung H, Qi S, Flint-Garcia S, et al. (2011)
Genome-wide association study of leaf architecture in the maize nested
association mapping population. Nat Genet. 2011;43(2):159–62.
22. Weng J, Xie C, Hao Z, Liu C, Li M, et al. Genome-wide association study
identifies candidate genes that affect plant height in Chinese elite maize
(Zea mays L.) inbred lines. PLoS One. 2011;6(12):e29229.
23. Zhang X, Guan Z, Li Z, Liu P, Shen Y. A combination of linkage mapping and GWAS brings new elements on the genetic basis of yieldrelated traits in maize across multiple environments. Theor Appl Genet.
2020;133(9):2881–95.
Wu et al. BMC Genomic Data
(2022) 23:76
24. Li K, Wang H, Hu X, Liu Z, Wu Y, Huang C, et al. Genome-wide association
study reveals the genetic basis of stalk cell wall components in maize.
PLoS ONE. 2016;11(8):e0158906.
25. Pan Q, Farhan A, Yang X, Li J, Yan J, Xu M. Exploring the genetic characteristics of two recombinant inbred line populations via high-density SNP
markers in maize. PLoS ONE. 2012;7(12):e52777.
26. Angelovici R, Lipka AE, Deason N, Gonzalez-Jorge S, Lin H, Cepela J, et al.
Genome-wide analysis of branched-chain amino acid levels in Arabidopsis seeds. Plant Cell. 2013;25(12):4827–43.
27. Pace J, Gardner C, Romay C, Ganapathysubramanian B, Lübberstedt
T. Genome-wide association analysis of seedling root development in
maize (Zea mays L.). BMC Genomics. 2015;16:47.
28. Samayoa L, Malvar R, Olukolu BA, Holland JB, Butrón Ana. Genome-wide
association study reveals a set of genes associated with resistance to the
Mediterranean corn borer ( Sesamia nonagrioides L.) in a maize diversity
panel. BMC Plant Biol. 2015;15:35.
29. Elshire RJ, Glaubitz JC, Sun Q, Poland JA. A robust, simple genotypingby-sequencing (GBS) approach for high diversity species. PLoS ONE.
2011;6(5):e19379.
30. Poland J, Endelman J, Dawson J, Rutkoski J, Wu S, Manes Y, et al. Genomic
selection in wheat breeding using genotyping-by-sequencing. Plant
Genome. 2012;5:103–13.
31. Donato MD, Peters SO, Mitchell SE, Hussain T, Imumorin IG. Genotypingby-sequencing (GBS): a novel, efficient and cost-effective genotyping method for cattle using next-generation sequencing. PLoS ONE.
2013;8(5):e62137.
32. Sonah H, Bastien M, Iquira E, Tardivel A, Légaré G, Boyle B, et al. An
improved genotyping by sequencing (GBS) approach offering increased
versatility and efficiency of SNP discovery and genotyping. PLoS ONE.
2013;8(1):e54603.
33. Charcosset A, Gallais A. Estimation of the contribution of quantitative
trait loci (QTL) to the variance of a quantitative trait by means of genetic
markers. Theor Appl Genet. 1996;93(8):1193–201.
34. Gou L, Zhao M, Huang JJ, Zhang B, Li T, Sun R. Bending mechanical properties of stalk and lodging-resistance of maize (Zea mays L.). Acta Agron
Sin. 2008;34(4):653–61.
35. Tang H, Yan JB, Huang YQ, Zheng YL, Sheng LY. QTL mapping of five
agronomic traits in maize. Acta Genet Sin. 2005;32(2):203–9.
36. Li C, Li Y, Sun B, Peng B, Liu C, Liu Z, et al. Quantitative trait loci mapping
for yield components and kernel-related traits in multiple connected RIL
populations in maize. Euphytica. 2013;193(3):303–16.
37. Delmer DP, Haigler CH. The regulation of metabolic flux to cellulose, a
major sink for carbon in plants. Metab Eng. 2002;4(1):22–8.
38. Guo Y, Hu Y, Chen H, Yan P, Du Q, Wang Y, et al. Identification of traits
and genes associated with lodging resistance in maize. Crop J.
2021;9(6):1408–17.
39. Shinohara N, Sunagawa N, Tamura S. The plant cell-wall enzyme atxth3
catalyses covalent cross-linking between cellulose and cello-oligosaccharide. Sci Rep. 2017;7:46099.
40. Du Q, Pan W, Tian J, Li B, Zhang D. The UDP-glucuronate decarboxylase
gene family in Populus: structure, expression, and association genetics.
PLoS ONE. 2013;8(4):e60880.
41. Zhou J, Lee C, Zhong R. MYB58 and MYB63 are transcriptional activators
of the lignin biosynthetic pathway during secondary cell wall formation
in Arabidopsis. Plant Cell. 2009;21(1):248–66.
42. Wang H, Avci U, Nakashima J, Hahn MG, Chen F, Dixon RA. Mutation of
WRKY transcription factors initiates pith secondary wall formation and
increases stem biomass in dicotyledonous plants. Proc Natl Acad Sci USA.
2010;107(51):22338–43.
43. Liu C, Zheng S, Gui J, Fu C, Yu H, Song D, et al. Shortened basal internodes, encodes a gibberellin 2-oxidase and contributes to lodging resistance in rice. Mol Plant. 2017;11(2):288–99.
44. Guillaumie S, Mzid R, Méchin V, Léon C, Hichri I, Destrac-Irvine A, et al. The
grapevine transcription factor WRKY2 influences the lignin pathway and
xylem development in tobacco. Plant Mol Biol. 2010;72(1–2):215–34.
45. Wen W, Wang R, Su L, Lv A, An Y. MsWRKY11, activated by MsWRKY22,
functions in drought tolerance and modulates lignin biosynthesis in
alfalfa (Medicago sativa L.). Environ Exp Bot. 2021;184(2):104373.
46. Knapp SJ, Stroup WW, Ross WM. Exact confidence intervals for heritability
on a progeny mean basis. Crop Sci. 1985;25:192–4.
Page 16 of 16
47. R Core Team. R: a language and environment for statistical computing.
Computing. 2014;14:12–21.
48. Kang HW, Cho YG, Yoon UH, Eun MY. A rapid DNA extraction method
for RFLP and PCR analysis from a single dry seed. Plant Mol Biol Rep.
1998;16(1):90.
49. Huang XH, Feng Q, Qian Q, Zhao Q, Wang L, Wang A, et al. Highthroughput genotyping by whole-genome resequencing. Genome Res.
2009;19(6):1068–76.
50. Hill WG, Weir BS. Variances and covariances of squared linkage disequilibria in finite populations. Theor Popul Biol. 1988;33(1):54–78.
51. Chang CC, Chow CC, Tellier LC, Vattikuti S, Purcell SM, Lee JJ. Secondgeneration PLINK: rising to the challenge of larger and richer datasets.
GigaScience. 2015;4:7.
52. Li Z, Liu W, Yang S, Guo J, Zhao Y, Huang Y, et al. Genome-wide association
study of flowering time related traits in maize (Zea mays L.). Mol Plant
Breed. 2020;18(1):37–45.
53. Liu Y, Guo J, Zhang D, Zhao Y, Zhu L, Huang Y, et al. Genetic diversity and
linkage disequilibrium estimation among the maize breeding germplasm
for association mapping. Int J Agric Biol. 2014;16:851–61.
54. Kanehisa M, Goto S. KEGG: Kyoto encyclopedia of genes and genomes.
Nucleic Acids Res. 2000;28:27–30.
Publisher’s Note
Springer Nature remains neutral with regard to jurisdictional claims in published maps and institutional affiliations.
Ready to submit your research ? Choose BMC and benefit from:
• fast, convenient online submission
• thorough peer review by experienced researchers in your field
• rapid publication on acceptance
• support for research data, including large and complex data types
• gold Open Access which fosters wider collaboration and increased citations
• maximum visibility for your research: over 100M website views per year
At BMC, research is always in progress.
Learn more biomedcentral.com/submissions