Morphological and molecular characterization of Croatian carob tree (Ceratonia siliqua L.) germplasm
Bạn đang xem bản rút gọn của tài liệu. Xem và tải ngay bản đầy đủ của tài liệu tại đây (1.12 MB, 28 trang )
Turkish Journal of Agriculture and Forestry
Volume 45
Number 6
Article 11
1-1-2021
Morphological and molecular characterization of Croatian carob
tree(Ceratonia siliqua L.) germplasm
SNJEZANA BOLARIC
IVNA DRAGOJEVIC MÜLLER
ALES VOKURKA
DUBRAVKA VITALI CEPO
MIRKO RUSCIC
See next page for additional authors
Follow this and additional works at: />Part of the Agriculture Commons, and the Forest Sciences Commons
Recommended Citation
BOLARIC, SNJEZANA; MÜLLER, IVNA DRAGOJEVIC; VOKURKA, ALES; CEPO, DUBRAVKA VITALI; RUSCIC,
MIRKO; SRECEC, SINISA; and KREMER, DARIO (2021) "Morphological and molecular characterization of
Croatian carob tree(Ceratonia siliqua L.) germplasm," Turkish Journal of Agriculture and Forestry: Vol. 45:
No. 6, Article 11. />Available at: />
This Article is brought to you for free and open access by TÜBİTAK Academic Journals. It has been accepted for
inclusion in Turkish Journal of Agriculture and Forestry by an authorized editor of TÜBİTAK Academic Journals. For
more information, please contact
Morphological and molecular characterization of Croatian carob tree(Ceratonia
siliqua L.) germplasm
Authors
SNJEZANA BOLARIC, IVNA DRAGOJEVIC MÜLLER, ALES VOKURKA, DUBRAVKA VITALI CEPO, MIRKO
RUSCIC, SINISA SRECEC, and DARIO KREMER
This article is available in Turkish Journal of Agriculture and Forestry: />vol45/iss6/11
Turkish Journal of Agriculture and Forestry
/>
Research Article
Turk J Agric For
(2021) 45: 807-818
© TÜBİTAK
doi:10.3906/tar-2107-24
Morphological and molecular characterization of Croatian carob tree
(Ceratonia siliqua L.) germplasm
1
2
1
Snježana BOLARIĆ , Ivna DRAGOJEVIĆ MÜLLER , Aleš VOKURKA ,
3
4
5
6,
Dubravka VITALI ČEPO , Mirko RUŠČIĆ , Siniša SREČEC , Dario KREMER *
1
Department of Plant Breeding, Genetics and Biometrics, Faculty of Agriculture, University of Zagreb, Zagreb, Croatia
2
Department of Ecology and Water Protection, Water Supply and Drainage, Zagreb, Croatia
3
Department of Food Chemistry, Faculty of Pharmacy and Biochemistry, University of Zagreb, Zagreb, Croatia
4
Department of Biology, Faculty of Sciences and Mathematics, University of Split, Split, Croatia
5
Department of Plant Production, Križevci College of Agriculture, Križevci, Croatia
6
Pharmaceutical Botanical Garden Fran Kušan, Faculty of Pharmacy and Biochemistry, University of Zagreb, Zagreb, Croatia
Received: 09.07.2021
Accepted/Published Online: 06.10.2021
Final Version: 16.12.2021
Abstract: The results of morphological and AFLP variability of 120 plants of carob tree (Ceratonia siliqua L.), collected from 12
different locations (10 biological replicates for each location) on the coast and islands of the southern Croatian Adriatic, indicate high
molecular and morphological variability among these carob populations. Analysis of molecular variance revealed significant differences
among populations (26.07%; p < 0.001; a = 0.05). Out of the total variability, 22.49% refers to the variability among, and 77.51% within
populations. UPGMA and STRUCTURE analysis based on AFLP genetic data clustered carob populations into three main groups
representing three real genetic populations. UPGMA analysis based on morphological traits of leaves, pods, and seeds clustered carob
populations into five groups. Mantel test showed significant correlation between morphological and genetic data (r = 0.58, p < 0.001;
a = 0.05). According to the high genetic and morphological variability, the germplasm collection in the analysis could represent an
important genetic pool for future breeding programmes. The goal of future research should be the conservation of C. siliqua in its
natural habitats, and the establishment of gene banks of genetic resources with the purpose of creating new carob cultivars in breeding
programmes.
Key words: Amplified fragment length polymorphism, Bayesian cluster analysis, carob, diversity, morphology, principal component
analysis
1. Introduction
The carob tree, Ceratonia siliqua L. (family Fabaceae), is
a dioecious evergreen tree or shrub with a distribution
range extending between 30–45°N and 30–40°S (Batlle
and Tous, 1997). Considering the thin distribution belt,
most researchers consider that the Mediterranean Basin is
the centre of carob tree origin (Zohary and Orshan, 1959).
Biogeographical analyses of Viruel et al. (2019) support
the persistence of carob tree refugia in Morocco and the
Iberian Peninsula, but also in the eastern Mediterranean.
Carob is a common plant species in the spontaneous
vegetation of the Mediterranean Basin, and it has
both ethnobotanical and food industry value in all
Mediterranean countries (Durrazzo et al., 2014). Carob
pods and seeds are very important food and feed in
domestic use throughout Mediterranean countries, and
even in the modern food and pharmaceutic industries
(Azab, 2017) due to the nutritive characteristics and
bioactive components of carob pod flour (Durazzo et al.,
2014) and the high content of galactomannan storage
polysaccharides in carob seed endosperm. It is, therefore,
not surprising that research of pod and seed variability,
and genetic variability of carob has been intensive over the
past 15 years in Lebanon (Talhouk et al., 2005), Morocco
(Konate et al., 2007; Sidina et al., 2009), Portugal (Barracosa
et al., 2008), Italy, Spain, Turkey, Greece, Israel (Caruso et
al., 2008; Vekiari et al., 2011) and Syria (Mahfoud et al.,
2018). There are several reports on the genetic variability
of carob tree populations that have mainly focused on the
assessment of variability of varieties and wild forms of
carob trees using AFLP (Caruso et al., 2008), RAPD and
AFLP (Barracosa et al., 2008), EST-SSR (La Malfa et al.,
2014), and SSR molecular markers (Di Guardo et al., 2019).
There are also several reports on the molecular variability
*Correspondence:
This work is licensed under a Creative Commons Attribution 4.0 International License.
807
BOLARIĆ et al. / Turk J Agric For
of either wild or natural forms of carob trees conducted
using RAPD markers (Talhouk et al., 2005; Konate et al.,
2007; Afif et al., 2008; Mahfoud et al., 2018). Only a few
reports have focused on analyses at the population level
(Talhouk et al., 2005; Konate et al., 2007; Afif et al., 2008).
According to a recent study of the genetic structure of
215 accessions collected in 12 countries (Di Guardo et
al., 2019), the accessions from Croatia are very similar to
those of Cyprus.
In the Croatian Adriatic region, especially middle and
southern Dalmatia with its islands, carob fruits have been
used in the production of traditional products such as cakes
and liqueurs. Most Croatian carob populations are situated
on the islands and are thus spatially well isolated from one
another. The selection of carob trees by the locals based on
pod size also likely affected population variability. Given
their isolation, significant genetic and morphological
variability between populations can be expected.
The aim of this study was to analyse the genetic and
morphological variability of the carob population from
the Croatian Adriatic to determine the number of real
genetic populations present in the Croatian Adriatic area
and whether there is a connection between genetic and
morphological traits. The principal goal was to achieve
better and more efficient conservation of carob trees in
their natural habitats as valuable germplasm for future
breeding programmes.
2. Materials and methods
2.1. Plant material
Morphological characterization was performed on 10
randomly selected, traditionally cultivated carob female
trees from each of 12 local populations (in total 120
individual plants, at least approximately 50–70 years
in age) in the coastal region and islands of the southern
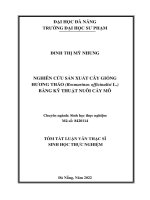
Croatian Adriatic (Table S1, Figure 1). The size of the
sampled populations varied, consisting of several dozen
to a several hundred plants covering a radius of at least
200 m of geographic position from the population centre.
The centre for each sampled population was described in
Figure 1. Map of locations of carob populations listed in Table 1.
808
BOLARIĆ et al. / Turk J Agric For
terms of latitude, longitude, and altitude. A small amount
of young leaves were collected from each tree from the
population and placed into nylon zip bags with silica gel
for drying, and further utilization for DNA analysis.
2.2. Molecular analysis
2.2.1. DNA isolation
Dried leaves were ground into a fine powder at frequency
of 25 Hz for 60 s with ball Mixer Mill MM400 (Retsch,
Germany). Genomic DNA was isolated from ground
leaves using a commercial DNA isolation kit (DNeasy plant
Mini kit, Qiagen, Germany) following the manufacturer’s
protocol, and diluted to the work concentration of 50 ng
µL–1.
2.2.2. AFLP analysis
AFLP analysis was carried out according to the method
by Vos et al. (1995). A total of 1 µg DNA was double
digested with 5U EcoRI and 5U MseI endonuclease. EcoRI
and MseI-adaptors were ligated at the end of restricted
DNA strains using T4 DNA ligaze (New England
Biolabs). Preselective amplification was carried out in a
reaction volume of 20 µL containing 20 mM TRIS-HCl,
50 mM KCl, 3 mM MgCl2, 0.25 μM of each EcoRI and
MseI primers (EcoRI+A/MseI+A, and EcoRI+A/MseI+C
respectively; Applied Biosystems, USA), 0.2 mM dNTP
(Sigma-Aldrich, Germany), 0.5 U Taq DNA polymerase
(Sigma-Aldrich) and 5 μL digested and adaptor ligated
DNA fragments. Amplification volumes were diluted with
500 µL purified water and used as a template for selective
amplification.
Selective amplification was carried out using three
additionally selective nucleotides (Table 1). Each forward
primer (E-primers) was labelled with 6 FAM or VIC
fluorescent dye (Applied Biosystems, USA). Selective
amplification was performed in the reaction volume of
20 µL containing 20 mM TRIS-HCl, 50 mM KCl, 3 mM
MgCl2, 0.25 μM of EcoRI and MseI primer each (Applied
Biosystems, USA), 0.2 mM dNTP, 0.5 U Taq DNA
polymerase, and 5 μL preselective amplification template.
Preselective and selective amplification were carried
out using VeritiTM 96 Well Thermal Cycler (Applied
Biosystems, USA). The following thermal profile of
preselective amplification was used: 2 min at 72 °C,
followed by 20 cycles of 20 s at 94 °C, 30 s at 56 °C,
and 2 min at 72 °C, and the final step 30 min at 60 °C.
Selective amplification was conducted with the following
touchdown thermal profile: initial step of 2 min at 94 °C,
10 touchdown cycles of 20 s at 94 °C, 30 s at 66 °C (–1 °C
per cycle), 2 min at 72 °C, then 20 cycles of 20 s at 94 °C,
30 s at 56 °C, 2 min at 72 °C, and the final step of 30 min
at 60 °C.
AFLP fragments were separated in a four-capillary
electrophoresis device (3130 Genetic Analyzer, Applied
Biosystems, USA) using 36-cm capillaries, POP-7 polymer
and GeneScanTM 600 LIZTM dye size standard (Applied
Biosystems). AFLP fragments were scored between 80
and 600 bp using GeneMapper V 4.0 software (Applied
Biosystems). In the given GeneMapper output data (based
on size and height of AFLP fragments) six replicates of
DNA samples (four carob genotypes as duplicate samples,
two DNA samples as multiple controls) and six samples as
negative controls were additionally scored. GeneMapper
output data were imported into the ScanAFLP 1.3
(Herrmann et al., 2010) for additional AFLP fragments
selection. The resulting binary matrix was used for further
statistical analysis.
2.3. Morphological characterisation
The assessment of morphological traits was performed
separately for each of ten trees from each population
as shown in the Table S2. The traits of leaves, pods, and
seeds were measured on five randomly chosen leaves, ten
randomly chosen pods, and 25 randomly chosen seeds
from each tree from each population.
2.4. Statistical analysis
2.4.1. Molecular data
Polymorphism information content (PIC) for dominant
markers for each AFLP primer combination was calculated
Table 1. AFLP primer combinations, their sequences used in selective amplification, and the number/percentage of polymorphic
fragments and PIC value.
AFLP primer
combination
Sequence (5’ → 3’)
Dye
Total no. of
fragments
Number and percentage (%) of
polymorphic fragments
PIC value
E36/M46
Ea+ACC/Mb+ATT
VIC
139
98 (71.5%)
0.25
E36/M36
E+ACC/M+ACC
VIC
113
86 (76.1%)
0.21
E45/M46
E+ATG/M+ATT
6 FAM
134
83 (61.9%)
0.26
E45/M36
E+ATG/M+ACC
6 FAM
97
73 (75.3%)
0.20
483
340 (avg = 70.4%)
Total
Primer core sequence specific for EcoRI site: 5´-GACTGCGTACCAATTC-3’;
Primer core sequence specific for MseI site: 5´-GATGAGTCCTGAGTA A-3´
a
b
809
BOLARIĆ et al. / Turk J Agric For
according to the formula described by Roldán-Ruiz et al.
(2000). The PIC value for dominant markers is up to 0.50
for fi = 0.50 (De Riek et al. 2001).
An AFLP binary matrix was used for calculation of
pairwise differences based on the square Euclidean distance
coefficient (EucSQ) of all carob genotypes (Excoffier et al.,
1992). Distance matrix was used for cluster analysis based
on the unweighted pair-group method (UPGMA; Sneath
and Sokal, 1973) and for analysis of molecular variance
(AMOVA; Excoffier et al., 1992). The average genetic
distance between two carob populations is designed as the
ΦST value, representing the interpopulation distance (Huff,
1997).
UPGMA analysis on the level of individual carob trees
and bootstrap analysis based on 1000 resampling of the data
set were computed using software NTSYSpc ver. 2.21L (Rohlf,
2008). AMOVA and ΦST values were computed using the
programme AMOVA which is incorporated into the software
package ARLEQUIN ver. 3.5.2.2. (Excoffier and Lischer,
2010). Cluster analysis based on ΦST values and the UPGMA
method using Agglomerative hierarchical clustering (AHC)
were carried out using XLSTAT software1, Ver. 2013.2.01
(AddinsoftTM, 1995–2013). Computations of pairwise
genetic distance matrix between populations was estimated
in AFLP-SURV with bootstrapping (1000 replicates) over
AFLP loci (Vekemans et al., 2002) for computation bootstrap
confidence values on tree branches using PHYLIP ver. 3.69
phylogenetic software (Felsenstein, 1993).
The number of real populations K (the modal value
of DK) was investigated using STRUCTURE ver. 2.3.4
(Falush et al., 2007). STRUCTURE analyses included a
burn-in period of 100,000 replicates followed by 200,000
Markov chain Monte Carlo (MCMC) replicates for each
run. Twenty repeat runs were carried out to quantify the
amount of variation of the likelihood for each K (from
K = 1 to K = 12), using an ADMIXTURE model and
correlated allele frequencies and allowing for recessive
alleles (Falush et al., 2003). The posterior probability of the
data lnP(K) for a given K can be used as an indication of
the most likely number of real populations (Evanno et al.,
2005). Therefore, the height of the modal value of the DK
distribution was calculated to detect the number of real
populations K using Structure Harvester v 0.6.94 (Earl
and von Humboldt, 2012). The K that best described the
data was chosen by examining the lnP(K) (Pritchard et al.,
2000) and by calculating DK as described by Evanno et al.
(2005). The value of K with the highest mean log likelihood
[lnP(K)] and DK statistic was selected.
2.4.2. Morphological data
Morphological traits were tested for normality and
homogeneity of variance and subjected to one-way analysis
1
2
810
of variance (ANOVA). Differences between population
means of morphological variables were tested with Tukey’s
HSD post hoc tests. Descriptive statistics (minimum,
maximum, mean, standard deviation—SD, and coefficient
of variation—CV) were calculated for all morphological
traits.
Mean values of all morphological traits of 12 carob
populations were standardized as described in RoldánRuiz et al. (2001), and were subjected to cluster analysis
based on Euclidean distances and UPGMA method using
AHC clustering. Principal component analysis (PCA) was
performed on the matrix of Euclidean distance coefficients.
One-way ANOVA, descriptive statistics, AHC, Pearson’s
correlation coefficient among all morphological traits
(r), and PCA were carried out using XLSTAT software2,
ver. 2013.2.01 (AddinsoftTM, 1995–2013). The 3D-score
plot of the first three components was constructed using
NTSYSpc ver. 2.21L software (Rohlf, 2008).
2.4.3. Mantel test
Correlations significance between each single
morphological trait and AFLP data, and between groups
of morphological traits (leaves, pod, and seed traits) and
AFLP data were calculated using the Mantel test (Mantel,
1967) using XLSTAT and NTSYSpc software.
3. Results
3.1. Molecular variability
Molecular variability of 120 carob genotypes was analysed
using AFLP molecular markers, and four primer pair
combinations. A total of 483 AFLP fragments (bands)
were amplified, of which 340 (70.4%) were polymorphic.
The percentages of polymorphic fragments by AFLP
primer pair combinations ranged from 61.9% (E45/M46)
to 76.1% (E36/M36). The primer combination E45/M46
showed the highest PIC value (0.26), while the lowest
PIC values (0.20) were detected in the primer pairs E45/
M36, with an average 0.23 per primer pair combinations
(Table 1). The total number of fragments per population
determined by the four AFLP primer pair combinations
ranged from 210 to 291. Of these combinations, the
percentage of polymorphic fragments ranged from 30.0%
in population Vi to 75.9% in population Po (Table 2).
The average value of the squared Euclidean distance
coefficient ( x EucSQ ) within carob populations ranged from
18.76 (Vi) to 48.69 (Ko). The highest diversity between
pairs of carob tree was found within the populations Si (
5 (Table S3).
max EucSQ = 7878), and Ko (max EucSQ = 775)
3.2. Interpopulation distances, AMOVA, and
STRUCTURE analysis
The highest and significant interpopulation distance (ΦST)
was found between carob populations from Vis island
BOLARIĆ et al. / Turk J Agric For
Table 2. Number of monomorphic and polymorphic fragments within carob populations by primer combination.
AFLP primer
combinations
E36/M46
E36/M36
E45/M46
E45/M36
Total
No. of monomorphic and polymorphic fragments within populations
Br
Hv
Ko
La
Mlj
Mo
Or
Pe
Po
Si
So
Vi
m
35
36
26
29
39
20
41
31
18
38
33
40
**
p
32
28
50
36
27
49
22
37
67
24
30
18
m
30
34
28
33
30
17
33
28
21
17
35
36
p
28
9
25
23
19
41
18
21
51
34
16
13
m
33
35
31
32
35
15
33
30
16
31
35
37
p
31
28
36
33
26
58
28
35
63
33
25
21
m
29
33
12
28
30
19
32
30
15
19
34
34
p
22
8
42
16
12
33
13
17
40
28
10
11
m
127
138
97
122
134
71
139
119
70
105
137
147
p
113
73
153
108
84
181
81
110
221
119
81
63
47.1
34.6
61.2
47.0
38.5
71.8
36.8
48.0
75.9
53.1
37.2
30.0
*
p%
***
m = no. of monomorph. fragments; **p = no. of polymorph. fragments; ***p % = percent of polymorph.
fragments; codes of carob populations were explained in Table 1.
*
(Vi) and Orašac (Or) (ΦST = 0.53, p < 0.001), while the
interpopulation distance was smallest between the carob
populations Vi and So and was not significant (ΦST = 0.01;
p = 0.239) (Table S3). According to the given results, the
carob populations Vi and So likely belong to the same
population. The populations La, Ko, and Pe are genetically
very similar and vary significantly at the 5% level (Table 3).
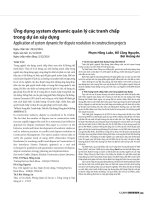
AMOVA revealed significant differences among
the 12 carob populations (22.49%, p < 0.001) (Table
4). According to the results of UPGMA analysis, based
on interpopulation distances, carob populations were
clustered into three main groups: GRP 1 (La, Ko, Pe, Mo,
Po, Br), GRP 2 (Hv, Vi, So), and GRP 3 (Si, Mlj, Or) (Figure
2). AMOVA also revealed significant differences between
the these three main groups of carob populations (14.53%,
p < 0.001) (Table 4).
Bayesian STRUCTURE analysis revealed three existing
real genetic populations of the 12 initial populations, with
the populations Si, Mlj, and Or belonging to the first; Vi,
So, and Hv to the second; and the populations Ko, La, Pe,
Mo, Br, and Po to third genetic population (Figure 3).
3.3. Morphological variability
Descriptive statistics of the analysed morphological
traits in 12 Croatian carob tree populations are shown
in Tables S4–S6. The highest variability among carob
trees for the traits WL, LLp, WLfl, TS, WS, and WgtS
was recorded within population La. The traits NoLfl, WP,
NoS, and l/w-S were the most variable within population
Po. The highest variability for the traits LL and LLfl was
found within population Pe, then for the traits LP and
LS within population Mlj, while the highest variability
for LPP was recorded within population Ko. The lowest
variability for the traits LL, WP, TP, WgtP, TS, LS, and
WS was recorded within population Vi. The traits WL,
LLP, NoLfl, LLfl, WLfl, and l/w-Lfl were the least variable
within population So, while the traits LP, NoS, and l/w-S
showed the least variability in the population Or. The
weight of pods was lowest in population Or, and highest
in populations Vi and Pe (Table S5). The populations Or
and Pe were characterized by the shortest and the longest
pods, respectively. Although the pods from the population
Vi belong to those with shorter pods, their width and
thickness was the highest. Among seed traits, the width of
the seeds was highly variable (Table S6).
All carob populations showed significant differences
(at p < 0.01) based on the morphological traits, as revealed
by ANOVA (Tables S7–S9). Differences were observed in
all morphological traits and were particularly significant
in the pod traits. The Pearson’s correlation matrix among
19 morphological traits is summarized in Table S10. The
highest positive and significant correlation (>0.90) was
recorded between the length of leaves and length of leaf
petiole (0.98), the width of seeds and weight of seeds
(0.96), and the width of leaves and length of leaflets (0.94).
The dissimilarity coefficient based on morphological data
varied from 0.16 to 0.46.
All populations were grouped into five significant
groups at the 0.12 coefficient. The populations Po, Hv, So,
and Br from cluster I had wider leaves, longer leaflets, and
wider pods than populations Pe, La, Ko, Si, and Mo which
811
BOLARIĆ et al. / Turk J Agric For
Table 3. Interpopulation distances (ΦST) of investigated carob populations (lower triangle) and probability value, after 1000 permutations
(upper triangle). Codes of carob populations are explained in Table 1.
Br
Br
Hr
Ko
La
Mlj
Mo
Or
Pe
Po
Si
So
Vi
< 0.001
< 0.001
< 0.001
< 0.001
< 0.001
< 0.001
< 0.001
< 0.001
< 0.001
< 0.001
< 0.001
< 0.001
< 0.001
< 0.001
< 0.001
< 0.001
< 0.001
< 0.001
< 0.001
< 0.001
< 0.001
0.032
< 0.001
0.003
< 0.001
0.013
< 0.001
< 0.001
< 0.001
< 0.001
< 0.001
< 0.001
< 0.001
0.006
< 0.001
< 0.001
< 0.001
< 0.001
< 0.001
< 0.001
< 0.001
< 0.001
0.005
< 0.001
< 0.001
< 0.001
< 0.001
< 0.001
< 0.001
< 0.001
< 0.001
< 0.001
< 0.001
< 0.001
< 0.001
< 0.001
< 0.001
< 0.001
< 0.001
< 0.001
< 0.001
< 0.001
< 0.001
< 0.001
< 0.001
Hr
0.24
Ko
0.13
0.21
La
0.17
0.28
0.04
Mlj
0.25
0.37
0.16
0.19
Mo
0.15
0.25
0.08
0.09
0.19
Or
0.38
0.50
0.30
0.33
0.13
0.23
Pe
0.14
0.11
0.05
0.09
0.22
0.13
0.37
Po
0.08
0.17
0.08
0.15
0.24
0.10
0.31
0.10
Si
0.26
0.38
0.17
0.20
0.12
0.17
0.28
0.24
0.21
So
0.16
0.21
0.22
0.28
0.40
0.23
0.50
0.14
0.15
0.38
Vi
0.23
0.26
0.26
0.33
0.43
0.27
0.53
0.18
0.21
0.41
0.239
0.01
Table 4. Results of analysis of molecular variance (AMOVA) for 120 carob genotypes.
Source of variation
d.f.
Sum of
squares
Variance
component
Percentage of
variation (%)
Φ
p(Φ)
Among populations
11
795
5.58
22.49
0.22
<0.001
Within populations
108
2001
18.53
77.51
Among groups (GRP 1 vs. GRP2 vs. GRP3)
2
368
3.64.
14.53
0.15
<0.001
Among populations within groups
9
427
2.89
11.54
0.14
<0.001
Total
119
2796
22.96
formed cluster II. The populations Or and Mlj had leaves
with elongated leaflets and narrow pods. The population
Or had shorter pods containing a higher number of small
seeds. The population Vi has shorter and wider leaflets,
and the heaviest pods whose average width and thickness
was the highest among the populations.
According to the PCA, the first four components
explained 84.65% of the variation. All morphological
traits showed the highest cumulative percentage (≥70%).
Morphological traits with the factor loading (PC) equal
to or higher than 0.70 were considered important for
the discrimination of the carob populations. The results
of the PCA, with discriminating traits in bold are given
in Table S11. Using the PCA, all carob populations were
grouped into five distinct groups (Figure 4). The grouping
of the carob populations based on PCA was similar to the
grouping obtained in the AHC-dendrogram based on
morphological traits (Figure 2B).
3.4. Mantel test
To interpret the correlations between AFLP and
morphological matrices of dissimilarity, the Mantel
812
test was used to detect which morphological trait
contributes most to the positive correlation with AFLP
data (Table 5). The Mantel test showed a significant
correlation between matrices based on AFLP and those
based on all morphological traits (r = 0.58). The test also
showed significant correlation between each of the six
morphological traits and AFLP (Table 5). The following
traits were found to give the highest contribution: lengthto-width ratio of leaflets, number of leaflets, and the width,
weight, and number of seeds in pods. Length of seeds also
statistically contributed to the positive correlation with
AFLP.
4. Discussion
The discriminatory power of AFLP markers has been used
in many studies of genetic variability of cross-pollinated
tree species. The mean PIC value among apricot accessions
was 0.21 (Geuna et al., 2003), among Jatropha curcas L.
was 0.26 (Tatikonda et al., 2009), 0.17 among papaya
genotypes (Oliviera et al., 2011), 0.09 among Himalayan
Chir pine (Rawat et al., 2014), and 0.21 among argan tree
BOLARIĆ et al. / Turk J Agric For
A
B
h=0.22
h=0.12
79
La
Ko
Pe
Mo
Po
Pe
La
Ko
Si
Mo
Po
78
72
83
68
Br
Hv
Vi
So
Si
58
99
Hv
So
Br
Or
89
65
99
Mlj
Or
Mlj
Vi
0
0.05
0.1
0.15
0.2
0.25
0.3
0.35
ST
0
0.05
0.1
0.15
0.2
0.25
Euclidean distances
Figure 2. Dendrograms of 12 investigated carob populations (Pe = Pelješac, La = Lastovo, Ko = Korčula, Si = Šipan, Mo = Molunat, Po
= Podgora, Hv = Hvar, So = Šolta, Br = Brač, Or = Orašac, Mlj = Mljet, Vi = Vis) obtained from (A) AHC clustering based on AFLP
markers interpopulation distances (ΦST), with the indication of bootstrap values over 50 based on 1000 resamplings of the data set,
Fig. 2. three distinct clusters obtained by the UPGMA method with interpopulation distance (Φ ), with a threshold (h) used to
revealing
ST
separate three clusters, and (B) AHC clustering based on Euclidean distances of 19 morphological traits obtained by UPGMA method
with Euclidean distance with a threshold (h) separating five clusters.
genotypes (Pakhrou et al., 2016). However, the number of
AFLP primer combinations used in these studies was even
higher, ranging from four in argan tree to 11 in papaya.
The similar PIC value of 0.23 with four AFLP primer
combinations was not high but showed discriminative
power sufficient to separate the populations in this study.
SSR markers (Viruel et al., 2018) are also appropriate for
the detection of fine levels of genetic variability within
narrow genepools of plant material, especially for the
detection of mutations and clones.
In this study, the percentage of polymorphic fragments
was 70.39%. Similar results were obtained in analyses of
natural carob populations in Tunisia (76.31%) (Afif et al.,
2008) and Syria (62.3%) (Mahfoud et al., 2018).
Barracosa et al. (2008) compared the genetic variability
of carob cultivars from the Algarve region in Portugal using
four AFLP primer pair combinations which generated less
polymorphic fragments (31.8%). The homogeneity of the
Algarve varieties could be explained by the composition
of samples mainly consisting of Portuguese varieties and
only a few wild carob genotypes. Caruso et al. (2008)
analysed varieties and wild forms of carobs in four regions
(Italy, Spain, Turkey, and Israel) using more AFLP primer
combinations obtaining similar results (36% polymorphic
markers). Generally, the Croatian carobs show higher
heterogeneity among populations, but also within some
populations (Ko, Si, Po, and Mo). However, considering
the rest of the populations, their variability is similar to
the variability of preselected genotypes and varieties
(Barracosa et al., 2008; Caruso et al., 2008). The carobs,
grown generatively at the place of germination, or taken
to another place when seedlings, may be considered crosspollinated genotypes, contrary to the report on clonal
varieties (Barracosa et al., 2008). The samples for this study
were taken from solitary trees or small group of trees, not
from plantations.
AMOVA detected significant variability, with 22.49%
referring to variability among and 77.51% to within
populations. A similar range of variations was detected
by RAPD in Lebanese and Tunisian populations (Talhouk
et al., 2005; Afif et al., 2008). High genetic variability
was explained by location remoteness and geographical
isolation of particular populations, which is also the
case in this study. Caruso et al. (2008) detected similar
variability in populations from four geographic regions by
AFLP (23.28% among, and 76.72% within populations).
The interpopulation distances (ΦST) in this study (0.01–
0.53) were wider than Tunisian populations (0.04–0.36)
(Afif et al., 2008), and were statistically significant with the
exception for populations Vi and So, indicating that these
plants might be of the same origin.
Croatian carob populations were grouped into
three main groups by UPGMA cluster analyses based
on interpopulation distances, which was confirmed by
AMOVA and STRUCTURE analysis. PCoA analyses of
Lebanese populations revealed three groups (Talhouk
813
BOLARIĆ et al. / Turk J Agric For
I
II
K = 3:
70
70
70
70
56
89 56
76
63
96
59
89
70
61
69
50.00
37.50
25.00
12.50
Cluster 3
94
Cluster 2
55
76
Cluster 1
70
1.0
89
67
C
0.8
76
0.4
73
66
B
0.6
72
Sp01
Sp05
Sp08
Sp09
Mlj09
Sp07
Sp06
Mlj07
Or01
Sp03
Sp04
Sp02
Mlj04
Mlj05
Sp10
Mlj08
Mlj01
Or06
Mlj02
Mlj03
Mlj10
Mlj06
Or04
Or02
Or10
Or03
Or07
Or08
Or09
Or05
So01
So05
So02
Vi05
Vi02
Vi03
Vi04
Vi06
So03
So08
So04
Vi10
Vi09
Vi01
Vi08
Vi07
So09
So10
So06
So07
Hv01
Hv02
Hv03
Hv05
Hv07
Hv09
Hv04
Hv08
Hv06
Hv10
Br01
Br03
Br04
Br05
Br06
Br08
Br09
Br07
Br10
Po06
Po08
Po09
Po01
Po10
Po07
Po05
Po03
Po04
Po02
Br02
La06
La04
Ko04
La02
La10
La03
La08
La09
La07
Ko05
Ko09
Ko02
Ko03
Ko01
La05
Pe02
Ko06
La01
Pe04
Pe07
Pe08
Pe10
Pe03
Pe01
Pe09
Pe06
Ko07
Ko10
Ko08
Pe05
Mo01
Mo07
Mo02
Mo08
Mo03
Mo05
Mo09
Mo10
Mo04
Mo06
0.2
0.0
77
A
0.00
Euclidean squared distance
Figure 3. Cluster analysis of carob populations from the Croatian Adriatic region based on four AFLP primer combinations. (I)
Dendrogram based on Euclidean square distance and UPGMA showing relationships among 120 carob trees. Bootstrap values over 50
based on 1000 resamplings of the data set are indicated. (II) STRUCTURE analysis of 120 carob trees (trees 1–10 for each population:
Or, Mlj, Vi, etc., as explained in the Materials and Methods section, and Table S1). Average proportions of membership for K = 3 real
populations are given as estimated by STRUCTURE. Each carob tree is represented by a horizontal box divided into colours. The colours
represent different potential genetic backgrounds.
814
BOLARIĆ et al. / Turk J Agric For
2.60
1.30
Ko
Pe
Mlj
Or
La
Vi
Mo
PC3
(16.31%)
Si
0.00
Br
-1.30
So
-2.60
-6.00
Po
Hv
4.00
4.00
2.00
PC2
0.00
(26.51%)
-2.00
-3.00
0.00
PC1
(34.76%)
3.00
6.00
-4.00
Figure 4. 3D-score plot based on the first three components of PCA from the morphological data. Pe = Pelješac, La = Lastovo, Ko =
Korčula, Si = Šipan, Mo = Molunat, Po = Podgora, Hv = Hvar, So = Šolta, Br = Brač, Or = Orašac, Mlj = Mljet, Vi = Vis.
et al., 2005), while Tunisian (Afif et al., 2008) and Syrian
(Mahfoud et al., 2018) populations were grouped into two
main groups.
The morphological variations of 12 carob populations
from the southern Adriatic based on 19 phenotypic
traits showed significant variability of nongrafted and
spontaneously propagated populations, supporting the
assumption by Barracosa et al. (2007) of the evaluation
of nongrafted carob biodiversity as a fundamental step
for the implementation of a conservation strategy,
presumably to alleviate the negative consequences of
genetic erosion. However, the same authors reported high
fruit morphological polymorphism even within the most
widespread cultivar from the Algarve region (cv. ‘Mulata’),
comparing it to cv. ‘Negra’, the most common Spanish
cultivar (Sanchez-Capuchino et al., 1988).
The high morphological differentiation between the
Vi and So populations, while remaining genetically very
close, could be explained by the morphological plasticity
and environmental influence on genetically very close
genotypes (De Kroon et al., 1994; Mousavi et al., 2019),
opening the possibility that individuals from one site
could have been clonally propagated at another site. This
is also consistent with the report of Barracosa et al. (2007)
regarding higher morphological variability in cv. ‘Mulata’,
but relatively low variability derived from AFLP markers.
Contrary to the data for cultivars, Russo and Polignano
(1996) analysed 54 carob ecotypes in southern Italy,
showing the diversity of morphological traits clustering
into six groups according to similarity and origin. Our
results are in accordance with this. We found a strong
correlation between two traits of different plant organs,
such as number of leaflets (NoLfl) and number of seeds
Table 5. Results of Mantel tests on carob populations, showing the
correlations between matrices of AFLP and each morphological
trait. p-values indicate the significance of two-tailed tests
following 1000 permutations; bold type letters indicate significant
differences (p < 0.05).
Morphological traits
AFLP
p-value
Length of leaves
0.01
0.437
Width of leaves
–0.07
0.620
Length of leaf petiole
–0.07
0.605
Number of leaflets
0.43
0.012
Length/width ratio of leaflets
0.74
<0.001
Length of leaflet petiole
–0.10
0.645
Length of leaflets
0.14
0.187
Width of leaflets
0.28
0.061
Length of pods
0.19
0.099
Width of pods
0.55
0.004
Length of pod pedicel
0.06
0.350
Number of seeds per pod
0.47
0.008
Weight of pod
0.56
0.003
Thickness of pods
0.36
0.074
Thickness of seeds
0.10
0.266
Length/width ratio of seeds
0.34
0.095
Length of seeds
0.38
0.040
Width of seeds
0.16
0.187
Weight of seed
0.16
0.201
815
BOLARIĆ et al. / Turk J Agric For
(NoS) (r = 0.81), but also between width-to-length ratio
of leaflet (l/w-Lfl) and width of pod (WP), or weight of
pod (WgtP), with values of 0.79 and 0.76, respectively.
There are no previous reports that examine the relations
between leaf or leaflet morphological characteristics and
other traits.
We found a strong correlation between weight of seeds
and length of pod (r = 0.76). These results agree with the
reports of Albanell et al. (1996) for Spanish cultivars, and
Boublenza et al. (2019) for cultivars from northern Algeria.
According to Tous et al. (2009), cultivars with large pods
and high pulp contents have a lower seed yield, with a
negative correlation of –0.79. The weight of seeds was
related with pod weight related with a correlation of 0.41
(nonsignificant), and with pod width with a nonsignificant
by correlation of 0.12.
The 12 populations from the southern Croatian
Adriatic are separated into five groups according to their
morphologic traits. Some of these populations, like Pe,
La, and Ko follow the clustering obtained by AFLP, where
these three populations also belong to the same cluster.
A similar pattern is valid for the populations Mlj, and
Or which clustered together according to phenotypic
characterisation, but also clustered in a similar way on the
basis of AFLP, including one more population (Si).
The Mantel test showed significant correlation between
morphological and genetic differentiations of the carob
populations. The highest correlation was found between
AFLP and the length-to-width ratio of leaflets. This was not
unexpected since environmental conditions have a greater
influence on plant organ dimensions than on organ shape.
However, Reyment (1985) showed that shape characters
give a much better representation of the phylogenetic
and genetic relations between living organisms. Beyene
et al. (2006) reported significant and positive relationship
between morphological and molecular (AFLP) diversity
in traditional Ethiopian highland maize accessions.
According to Persson and Gustavsson (2001), the
relationship between molecular markers and phenotypic
traits could be significant if the markers were linked to
selected loci.
The analyses of morphological and AFLP variability of
12 distinct populations in the eastern Adriatic resulted in
the clustering of these populations into three main groups.
Group 1 consists of the carob populations on the islands
of Brač, Korčula, and Lastovo, and the Pelješac Peninsula,
with the mainland populations Molunat and Podgora.
Group 2 is formed by populations of the islands of Hvar,
Šolta, and Vis. Finally, group 3 consists of populations
from the islands of Mljet and Šipan, and the mainland
locality Orašac. Molecular and morphological analysis
showed high variation among Croatian carob populations,
indicating the need for detailed study of their agronomic
traits and performance under controlled orchard
environments. They could also be utilised as a material
for genetic conservation, and a gene pool for potential
breeding programmes. Moreover, future research through
collaborations in comprehensive studies throughout the
Mediterranean are required to achieve conservation of
carob trees, not only in their natural habitats, but also
in gene banks, with the purpose of creating new carob
cultivars through breeding programmes.
Acknowledgement
The research is funded by the Croatian Science Foundation
(grant number IP-11-2013-3304-TEUCLIC).
References
Afif M, Messaoud C, Baoulila A, Chougrani H, Bejaoui A et al. (2008).
Genetic structure of Tunisian natural carob tree (Ceratonia
siliqua L.) populations inferred from RAPD markers. Annals
of Forest Science 65: 710–719. doi: 10.1051/forest:2008057
Barracosa P, Lima P, Lima MB, Cravador A (2008). Analysis of genetic
diversity in Portuguese Ceratonia siliqua L. cultivars using
RAPD and AFLP markers. Scientia Horticulturae 118, 189–199.
doi: 10.1016/j.scienta.2008.06.020
Albanell E, Caja G, Plaixats J (1996). Characterization of
carob fruits (Ceratonia siliqua L.), cultivated in Spain for
agroindustrial use. International Tree Crops Journal 9: 1–9.
doi: 10.1080/01435698.1996.9752955
Beyene Y, Botha A-M, Myburg AA (2006). Genetic diversity among
traditional Ethiopian highland maize accessions assessed by
simple sequence repeat (SSR) markers. Genetic Resources and
Crop Evolution 53: 1579–1588. doi: 10.1007/s10722-005-8509-y
Azab A (2017). Carob (Ceratonia siliqua): health, medicine and
chemistry. European Chemical Bulletin 6: 456–469. doi:
10.17628/ecb.2017.6.456-469
Boublenza I, El Haitoum A, Ghezlaoui S, Mahdad M, Vasai F et al.
(2019). Algerian carob (Ceratonia siliqua L.) populations.
Morphological and chemical variability of their fruits and
seeds. Scientia Horticulturae 256: 108537. doi: 10.1016/j.
scienta.2019.05.064
Barracosa P, Osório J, Cravador A (2007). Evaluation of fruit and
seed diversity and characterization of carob (Ceratonia siliqua
L.) cultivars in Algarve region. Scientia Horticulturae 114:
250–257. doi: 10.1016/j.scienta.2007.06.024
816
Tous J, Romero A, Hermoso JF, Ninot A, Plana J et al. (2009).
Agronomic and commercial performance of four Spanish
carob cultivars. HortTechnology 19: 465–470. doi: 10.21273/
HORTSCI.19.2.465
BOLARIĆ et al. / Turk J Agric For
Caruso M, La Malfa S, Pavlíček T, Frutos Tomás D, Gentile
A et al. (2008). Characterisation and assessment of
genetic diversity in cultivated and wild carob (Ceratonia
siliqua L.) genotypes using AFLP markers. Journal of
Horticultural Science and Biotechnology 83: 177–182. doi:
10.1080/14620316.2008.11512367
De Riek J, Calsyn E, Everaert I, Van Bockstaele E, De Loose M (2001).
AFLP based alternatives for the assessment of distinctness,
uniformity and stability of sugar beet varieties. Theoretical
Applied Genetics 103: 1254–1265. doi: 10.1007/s001220100710
Di Guardo M, Scollo F, Ninot A, Rovira M, Hermoso JF et al. (2019).
Genetic structure analysis and selection of a core collection
for carob tree germplasm conservation and management. Tree
Genetics and Genomes 15: 41–54. doi: 10.1007/s11295-0191345-6
Durazzo A, Turfani V, Narducci V, Azzini E, Maiani G et al. (2014).
Nutritional characterisation and bioactive components of
commercial carobs flours. Food Chemistry 153: 109–113. doi:
10.1016/j.foodchem.2013.12.045
Earl DA, von Holdt BM (2012). Structure harvester: a website and
program for visualizing Structure output and implementing
the Evanno method. Conservation Genetics Resources 4: 359–
361. doi: 10.1007/s12686-011-9548-7
Evanno G, Regnaut S, Goudet J (2005). Detecting the number of
clusters of individuals using the software Structure: a simulation
study. Molecular Ecology 14: 2611–2620. doi: 10.1111/j.1365294X.2005.02553.x
Excoffier L, Lischer HE (2010). Arlequin suite ver 3.5: A new series of
programs to perform population genetics analyses under Linux
and Windows. Molecular Ecology Resources 10: 564–567. doi:
10.1111/j.1755-0998.2010.02847.x
Falush D, Stephens M, Pritchard JK (2003). Inference of population
structure using multilocus genotype data: linked loci and
correlated allele frequencies. Genetics 164: 1567–1587.
Falush D, Stephens M, Pritchard JK (2007). Inference of population
structure using multilocus genotype data: dominant markers
and null alleles. Molecular Ecology Notes 7: 574–578. doi:
10.1111/j.1471-8286.2007.01758.x
Felsenstein J (1993). Phylip (Phylogeny Inference Package) version
3.5c. Distributed by the author. Department of Genetics,
University of Washington, Seattle.
Geuna F, Toschi M, Bassi D (2003). The use of AFLP markers for
cultivar identification in apricot. Plant Breeding 122: 526–531.
doi: 10.1111/j.1439-0523.2003.00897.x
Herrmann D, Poncet BN, Manel S, Rioux D, Gielly L et al. (2010).
Selection criteria for scoring amplified fragment length
polymorphisms (AFLPs) positively affect the reliability of
population genetic parameter estimates. Genome 53: 302–310.
doi: 10.1139/G10-006
Huff DR (1997). RAPD characterization of heterogenous perennial
ryegrass cultivars. Crop Science 37: 557–564. doi: 10.2135/cro
psci1997.0011183X003700020041x
Konate I, Maltouf AF, Berraho EB (2007). Diversity analysis of
moroccan carob (Ceratonia siliqua L.) accessions using
phenotypic traits and RAPD markers. Acta Botanica
Malacitana 32: 79–90. doi: 10.24310/abm.v32i0.7031
de Kroon H, Stuefer JF, Dong M, During HJ (1994) On plastic and
non-plastic variation in clonal plant morphology and its
ecological significance. Folia Geobotanica & Phytotaxonomica
29: 123–138. doi: 10.1007/BF02803790
La Malfa, CS, Douglas AB, Brugaletta M, Caruso M, Gentile A (2014).
Genetic diversity revealed by EST-SSR markers in carob tree
(Ceratonia siliqua L.). Biochemical Systematics and Ecology 55:
205–211. doi: 10.1016/j.bse.2014.03.022
Mahfoud H, Ameen T, Kazngi F, Nasser S (2018). Morphological and
genetic variability of natural Syrian carob (Ceratonia siliqua L.).
SSRG International Journal of Agriculture & Environmental
Science 5: 70–76. doi: 10.14445/23942568/IJAES-V5I2P110
Mantel N (1967). The detection of disease clustering and a generalized
regression approach. Cancer Research 27: 209–220. PMID:
6018555
Mousavi S, de la Rosa R, Moukhli A, Riachy ME, Mariotti R et al.
(2019). Plasticity of fruit and oil traits in olive among different
environments. Scientific Reports 9: 16968. doi: 10.1038/s41598019-53169-3
Oliveira E, Costa JL, Santos LF, Carvalho FM, Silva et al. (2011).
Molecular characterization of papaya genotypes using AFLP
markers. Revista Brasileira de Fruticultura 33: 848–858. doi:
10.1590/S0100-29452011000300020
Pakhrou O, Medraoui L, Yatrib C, Alami M, Souda-Kouraichi SI et al.
(2016). Study of genetic diversity and differentiation of argan
tree population (Argania spinosa L.) using AFLP markers.
Australian Journal of Crop Science 10: 990–999. doi: 10.21475/
ajcs.2016.10.07.p7680
Persson HA, Gustavsson BA (2001). The extent of clonality and
genetic diversity in lingonberry (Vaccinium vitis-idaea L.)
revealed by RAPDs and leaf-shape analysis. Molecular Ecology
10: 1385–1397. doi: 10.1046/j.1365-294X.2001.01280.x
Pritchard JK, Stephens M, Donnelly P (2000). Inference of population
structure using multilocus genotype data. Genetics 155: 945–
959.
Rawat A, Barthwal S, Ginwal HS (2014). Comparative assessment of
SSR, ISSR and AFLP markers for characterization of selected
genotypes of Himalayan Chir pine (Pinus roxburghii Sarg.)
based on resin yield. Silvae Genetica 63: 94–109. doi: 10.1515/
sg-2014-0013
Reyment RA (1985). Multivariate morphometrics and analysis
of shape. Mathematical Geology 17: 591–609. doi 10.1007/
BF01030855
Rohlf FJ (2008). NTSYS-pc: numerical taxonomy and multivariate
analysis system, ver. 2.2. Exeter Software: Setauket, NY.
Roldán-Ruiz I, Dendauw J, van Bockstaele E, Depicker A, De Loose
M (2000). AFLP markers reveal high polymorphic rates in
ryegrasses (Lolium spp.). Molecular Breeding 6: 125–134. doi:
10.1023/A:1009680614564
Roldán-Ruiz I, van Eeuwijk FA, Gilliland TJ, Dubreuil P, Dillmann C et
al. (2001). A comparative study of molecular and morphological
methods of describing relationships between perennial ryegrass
(Lolium perenne L.) varieties. Theoretical and Applied Genetics
103: 1138–1150. doi: 10.1007/s001220100571
817
BOLARIĆ et al. / Turk J Agric For
Russo G, Polignano GB (1996). Variation of seed and fruit characters
in Ceratonia siliqua L. cultivars. Genetic Resources and Crop
Evolution 43: 525–531. doi: 10.1007/BF00138829
Sánchez-Capuchino JA, Salazar D, García S, Martínez R, Melgarejo
P (1988). Tipificación morfológica de los algarrobos de la
Comunidad. Valenciana. In: Proc. of the II Intl. Carob Symp;
Valencia, Spain. pp. 69–78.
Sidina MM, El Hasanali M, Wahid N, Outamane A, Boulli A et
al. (2009). Fruit and seed diversity of domesticated carob
(Ceratonia siliqua L.) in Morocco. Scientia Horticulturae 123:
110–116. doi: 10.1016/j.scienta.2009.07.009
Sneath PHA, Sokal RR (1973). Numerical taxonomy. W.H. Freeman
and Co., San Francisco.
Talhouk SN, Breugel P, Zurayk R, Al-Khatib A, Estephan J et al.
(2005). Status and prospects for the conservation of remnant
semi natural carob Ceratonia siliqua L. populations in Lebanon.
Forest Ecology and Management 206: 49–59. doi: 10.1016/j.
foreco.2004.10.053
Tatikonda L, Wani SP, Kannan S, Beerelli N, Sreedevi TK et al. (2009).
AFLP-based molecular characterization of an elite germplasm
collection of Jatropha curcas L., a biofuel plant. Plant Science
176: 505–513. doi: 10.1016/j.plantsci.2009.01.006
818
Vekemans X, Beauwens T, Lemaire M, Roldan-Ruiz I (2002). Data
from amplified fragment length polymorphism (AFLP)
markers show indication of size homoplasy and of a relationship
between degree of homoplasy and fragment size. Molecular
Ecology 11: 139–151. doi: 10.1046/j.0962-1083.2001.01415.x
Vekiari SA, Ouzounidou G, Ozturk M, Görk G (2011). Variation
of quality characteristics in Greek and Turkish carob pods
during fruit development. The 2nd International Geography
Symposium GEOMED 2010. Procedia – Social and Behavioral
Sciences 19: 750–755. doi: 10.1016/j.sbspro.2011.05.194
Viruel J, Haguenauer A, Juin M, Mirleau F, Bouteiller
(2018). Advances in genotyping microsatellite
through sequencing and consequences of scoring
for Ceratonia siliqua (Leguminosae). Applications
Sciences 6: e01201. doi: 10.1002/aps3.1201
D et al.
markers
methods
in Plant
Viruel J, Haguenauer A, Juin M, Mirleau F, Bouteiller
(2018). Advances in genotyping microsatellite
through sequencing and consequences of scoring
for Ceratonia siliqua (Leguminosae). Applications
Sciences 6: e01201. doi: 10.1002/aps3.1201
D et al.
markers
methods
in Plant
Zohary M, Orshan G (1959). The maquis of Ceratonia siliqua in
Israel. Vegetatio 8: 285–297. doi: 10.1007/BF00518488
Table S1. Collection sites and geographic distribution of 12 carob populations from Croatia.
Population code
Carob tree code
Collecting site
Latitude (°N)
Longitude (°W)
Altitude (m
a.s.l.)
Br
Hv
Ko
La
Mlj
Mo
Or
Pe
Po
Si
So
Vi
Br01 to Br10
Hv01 to Hv10
Ko01 to Ko10
La01 to La10
Mlj01 to Mlj10
Mo01 to Mo10
Or01 to Or10
Pe01 to Pe10
Po01 to Po10
Si01 to Si10
So01 to So10
Vi01 to Vi10
Brač Island
Hvar Island
Korčula Island
Lastovo Island
Mljet Island
Molunat
Orašac
Pelješac Peninsula
Podgora
Šipan Island
Šolta Island
Vis Island
43°22′47.8″
43°07′30.1″
42°45′32.2″
42°46′06.9″
42°46′04.6″
42°27′11.1″
42°41′48.6″
42°58′30.1″
43°14′41.2″
42°42′42.6″
43°23′45.7″
43°02′34.0″
16°31′00.9″
17°11′45.8″
16°31′10.9″
16°53′54.4″
17°23′26.9″
18°25′55.3″
18°01′10.9″
17°09′55.9″
17°04′36.5″
17°54′56.9″
16°18′15.8″
16°06′22.4″
34
11
17
101
13
120
16
18
17
48
6
96
Table S2. List of morphological traits used for the characterisation of 12 carob populations from Croatia.
Leaf traits
Length of leaves (mm)
Code
LL
Pod traits
Length of pods (mm)
Code
LP
Seed traits
Length of seeds (mm)
Width of leaves (mm)
WL
Width of pods (mm)
WP
Width of seeds (mm)
Length of leaf petioles (mm)
LLP
Thickness of pods (mm)
TP
Thickness of seeds (mm)
Number of leaflets
Length of leaflets (mm)
Width of leaflets (mm)
Length of leaflet petioles (mm)
Length/width ratio of leaflets
NoLfl
LLfl
WLfl
LLflP
l/w-Lfl
Length of pod pedicels (mm)
Weight of pods (g)
Number of seeds per pod
LPP
WgtP
NoS
Weight of seeds (g)
Length/width ratio of seeds
Code
LS
WS
TS
WgtS
l/w-S
Table S3. Range of minimum value ( min EucSQ ), maximum value ( max EucSQ ), and average value ( xEucSQ ) of
squared Euclidean distances estimated within carob populations.
Code of carob population
min EucSQ
max EucSQ
x EucSQ
Br
7
59
36.33
Hv
3
43
23.51
Ko
21
75
48.69
La
15
53
39.64
Mlj
6
46
31.04
Mo
23
51
39.93
Or
10
39
25.13
Pe
14
64
37.84
Po
21
65
46.32
Si
11
78
36.80
So
5
43
25.64
Vi
5
35
18.76
Table S4. Descriptive statistics of eight morphological traits of leaves from 12 carob populations from Croatia.
Carob
population
Brač
Hvar
Korčula
Lastovo
Mljet
Molunat
Min
Length of
leaves (mm)
138.00
Width of
leaves (mm)
79.00
Length of leaf
petioles (mm)
74.00
Number of
leaflets
6.00
Length of leaflet
petioles (mm)
1.67
Length of
leaflets (mm)
39.00
Width of
leaflets (mm)
29.00
Length/width
ratio of leaflets
0.56
Max
Mean
SD
CV
265.00
192.75
30.61
0.16
149.00
114.84
17.13
0.15
198.00
135.96
28.29
0.21
10.00
7.60
1.34
0.18
4.00
2.67
0.59
0.22
75.38
57.45
7.86
0.14
51.90
38.66
5.42
0.14
0.83
0.68
0.07
0.10
Min
Max
144.00
279.00
87.00
158.00
95.00
205.00
6.00
10.00
2.50
3.38
49.33
71.50
29.00
53.00
0.57
0.92
Mean
SD
CV
210.16
29.46
0.14
118.22
16.97
0.14
151.31
27.57
0.18
7.42
1.21
0.16
2.93
0.20
0.07
59.29
5.35
0.09
40.93
5.66
0.14
0.69
0.07
0.10
Min
120.00
77.00
68.00
6.00
2.00
42.80
27.40
0.55
Max
Mean
SD
CV
252.00
193.38
30.37
0.16
142.00
112.66
16.84
0.15
196.00
135.04
30.26
0.22
10.00
7.86
1.28
0.16
3.75
2.74
0.39
0.14
70.33
55.24
7.29
0.13
46.83
37.28
4.26
0.11
0.81
0.68
0.06
0.09
Min
114.00
69.00
65.00
6.00
1.88
35.50
21.38
0.51
Max
Mean
279.00
197.80
155.00
103.46
232.00
143.98
12.00
7.84
3.80
2.85
72.17
52.68
48.67
35.04
0.87
0.67
SD
CV
41.74
0.21
22.76
0.22
39.61
0.28
1.39
0.18
0.57
0.20
8.37
0.16
6.12
0.17
0.07
0.10
Min
139.00
78.00
82.00
5.00
1.00
41.83
25.50
0.51
Max
Mean
SD
CV
275.00
197.20
31.40
0.16
154.00
114.76
17.74
0.15
210.00
140.76
28.41
0.20
10.00
8.00
1.51
0.19
4.33
2.62
0.62
0.24
80.83
58.29
8.43
0.14
47.50
35.52
4.97
0.14
0.78
0.61
0.06
0.10
Min
Max
Mean
142.00
280.00
208.33
71.00
155.00
112.26
78.00
231.00
153.52
6.00
12.00
8.62
1.75
4.40
3.05
38.50
71.50
55.04
25.50
48.80
36.16
0.52
0.80
0.66
SD
29.74
18.97
33.62
1.26
0.68
8.20
5.75
0.06
CV
0.14
0.17
0.22
0.15
0.22
0.15
0.16
0.09
Orašac
Min
Max
Mean
SD
CV
135.00
265.00
209.20
30.60
0.15
95.00
144.00
121.82
11.48
0.09
86.00
202.00
149.50
27.29
0.18
6.00
11.00
8.58
1.33
0.16
2.00
3.63
2.76
0.51
0.18
44.50
79.80
61.50
8.57
0.14
25.70
48.00
36.88
5.51
0.15
0.48
0.72
0.60
0.06
0.10
Pelješac
Min
Max
112.00
312.00
68.00
141.00
71.00
210.00
5.00
10.00
1.00
4.00
31.88
78.33
23.50
47.83
0.52
0.81
Mean
SD
CV
192.74
43.90
0.23
105.53
18.74
0.18
136.68
34.11
0.25
7.68
1.24
0.16
2.68
0.64
0.24
52.63
10.91
0.21
35.33
5.64
0.16
0.68
0.07
0.10
Min
132.00
93.00
91.00
4.00
2.00
43.40
27.00
0.52
Max
Mean
SD
CV
302.00
212.37
37.73
0.18
152.00
120.37
13.84
0.11
230.00
151.58
33.51
0.22
12.00
8.22
1.88
0.23
4.70
3.38
0.62
0.18
75.78
58.78
8.06
0.14
48.38
37.54
5.14
0.14
0.74
0.64
0.05
0.08
Min
135.00
69.00
85.00
6.00
2.00
44.25
26.00
0.51
Max
290.00
148.00
240.00
11.00
4.20
69.88
46.29
0.82
Mean
208.68
113.00
150.50
8.30
3.02
56.40
36.68
0.65
SD
CV
35.66
0.17
17.82
0.16
36.43
0.24
1.43
0.17
0.62
0.21
6.12
0.11
4.36
0.12
0.08
0.12
Min
152.00
101.00
88.00
6.00
2.00
50.25
33.33
0.57
Max
Mean
264.00
207.70
148.00
122.81
200.00
150.56
10.00
7.92
4.00
2.72
67.50
59.04
50.50
41.80
0.80
0.71
SD
CV
28.06
0.14
10.58
0.09
25.77
0.17
1.05
0.13
0.51
0.19
4.36
0.07
3.90
0.09
0.05
0.07
Min
Max
Mean
128.00
221.00
177.76
90.00
140.00
109.72
82.00
172.00
124.31
6.00
10.00
7.18
1.50
3.50
2.47
41.38
69.75
54.00
27.38
50.33
39.10
0.61
0.95
0.73
SD
CV
21.27
0.12
12.19
0.11
22.82
0.18
1.08
0.15
0.50
6.65
0.12
5.12
0.13
0.06
0.08
Podgora
Šipan
Šolta
Vis
0.20
Min = minimum value, Max = maximum value, Mean = mean value, SD = standard deviation, CV = coefficient of variation.
Table S5. Descriptive statistics of six morphological traits of pods from 12 carob populations from Croatia.
Carob
population
Brač
Hvar
Korčula
Lastovo
Mljet
Molunat
Min
Length of
pods (mm)
76.31
Width of pods
(mm)
17.97
Thickness of
pods (mm)
6.11
Length of pod
pedicels (mm)
4.44
Weight of
pods (g)
10.12
Number of
seeds per pod
3.00
Max
Mean
SD
CV
180.30
126.31
24.35
0.19
27.20
22.99
1.97
0.09
11.92
9.20
1.19
0.13
10.63
7.16
1.27
0.18
28.72
17.58
4.37
0.25
14.00
8.05
2.52
0.31
Min
Max
86.37
200.51
17.78
25.83
6.23
10.91
3.45
13.25
6.62
30.33
4.00
14.00
Mean
SD
CV
149.18
26.22
0.18
22.35
1.88
0.08
8.97
1.04
0.12
8.34
1.97
0.24
18.75
5.15
0.27
8.62
2.41
0.28
Min
94.34
17.68
4.42
3.35
10.12
4.00
Max
Mean
SD
CV
205.46
144.39
26.36
0.18
25.85
21.70
1.80
0.08
11.87
8.12
1.66
0.20
12.44
7.65
2.23
0.29
27.68
17.61
4.23
0.24
15.00
9.81
2.74
0.28
Min
93.06
15.54
4.78
5.30
5.17
4.00
Max
Mean
215.57
143.53
26.56
20.84
10.71
7.54
11.88
7.81
23.48
14.07
16.00
9.33
SD
CV
29.50
0.21
2.42
0.12
1.20
0.16
1.68
0.22
3.76
0.27
2.63
0.28
Min
74.93
16.55
6.12
4.62
7.39
5.00
Max
Mean
SD
CV
196.83
136.82
28.40
0.21
24.89
20.50
1.85
0.09
11.66
8.63
1.07
0.12
12.50
7.68
1.67
0.22
25.76
15.43
4.61
0.30
15.00
10.78
2.43
0.23
Min
Max
Mean
108.25
201.22
152.47
17.59
25.90
21.63
5.50
10.91
8.01
4.18
9.79
6.80
10.19
28.47
17.26
6.00
16.00
11.38
SD
20.56
1.93
1.23
1.33
4.39
2.37
CV
0.13
0.09
0.15
0.20
0.25
0.21
Orašac
Min
Max
Mean
SD
CV
101.29
148.00
123.79
10.65
0.09
16.12
21.78
18.99
1.25
0.07
4.96
10.91
7.77
1.30
0.17
5.40
11.55
8.03
1.27
0.16
7.01
19.66
12.41
3.08
0.25
8.00
16.00
12.23
1.73
0.14
Pelješac
Min
Max
98.32
212.10
17.88
26.41
5.46
12.48
4.81
12.90
8.91
31.71
4.00
15.00
Mean
SD
CV
153.62
26.80
0.17
21.96
2.00
0.09
9.05
1.58
0.17
9.07
1.67
0.18
19.64
6.17
0.31
10.32
2.18
0.21
Min
95.28
16.82
5.86
5.12
7.09
2.00
Max
Mean
SD
CV
198.82
141.91
23.20
0.16
30.90
23.50
2.98
0.13
10.68
8.40
1.07
0.13
11.37
7.68
1.41
0.18
30.22
17.59
5.18
0.29
14.00
8.65
2.64
0.31
Min
93.10
15.94
3.88
5.96
5.57
6.00
Max
217.15
27.13
12.34
13.22
38.96
16.00
Mean
147.92
21.77
8.36
9.41
18.71
10.72
SD
CV
29.24
0.20
2.64
0.12
2.05
0.25
1.49
0.16
7.38
0.39
2.53
0.24
Min
78.85
17.69
6.15
4.17
8.29
5.00
Max
Mean
179.30
128.81
28.53
23.61
12.08
9.45
9.85
6.56
28.58
18.03
14.00
9.48
SD
CV
23.06
0.18
2.54
0.11
1.34
0.14
1.33
0.20
5.03
0.28
2.49
0.26
Min
Max
Mean
100.13
168.25
129.93
23.03
30.70
26.64
10.09
13.93
11.94
4.28
10.07
6.96
13.65
28.09
21.04
5.00
15.00
9.25
SD
CV
13.82
0.11
1.60
0.06
0.83
0.07
1.21
0.17
3.73
0.18
1.91
0.21
Podgora
Šipan
Šolta
Vis
Min = minimum value, Max = maximum value, Mean = mean value, SD = standard deviation, CV = coefficient of variation.
Table S6. Descriptive statistics of five morphological traits of seeds from 12 carob populations from Croatia.
Carob
population
Brač
Hvar
Korčula
Lastovo
Mljet
Molunat
Orašac
Pelješac
Podgora
Šipan
Min
Thickness of
seeds (mm)
2.87
Length of
seeds (mm)
7.85
Width of seeds
(mm)
5.72
Length/width
ratio of seeds
0.59
Weight of
seeds (g)
0.12
Max
Mean
SD
CV
4.65
3.70
0.35
0.09
10.67
9.46
0.62
0.07
7.84
6.88
0.43
0.06
0.88
0.73
0.04
0.05
0.21
0.17
0.02
0.12
Min
Max
3.35
4.48
8.20
10.29
5.91
7.43
0.64
0.83
0.14
0.20
Mean
SD
CV
3.94
0.22
0.06
9.17
0.42
0.05
6.66
0.30
0.05
0.73
0.04
0.05
0.17
0.01
0.06
Min
3.12
7.54
6.42
0.68
0.14
Max
Mean
SD
CV
4.93
4.01
0.42
0.10
10.96
9.22
0.68
0.07
8.24
7.37
0.36
0.05
0.94
0.80
0.06
0.08
0.24
0.19
0.02
0.11
Min
Max
Mean
2.75
4.57
3.70
7.91
11.39
9.64
5.46
8.64
7.12
0.60
0.87
0.74
0.12
0.26
0.18
SD
CV
0.40
0.11
0.68
0.07
0.66
0.09
0.05
0.07
0.03
0.17
Min
3.07
7.35
5.32
0.63
0.12
Max
Mean
SD
CV
4.81
3.96
0.35
0.09
10.55
8.77
0.82
0.09
7.90
6.57
0.49
0.07
0.86
0.75
0.05
0.07
0.22
0.16
0.02
0.13
Min
Max
Mean
3.41
4.46
3.94
8.32
11.46
9.79
6.25
8.09
7.22
0.62
0.87
0.74
0.14
0.23
0.19
SD
CV
0.22
0.06
0.64
0.07
0.40
0.06
0.05
0.07
0.02
0.11
Min
3.55
7.55
5.57
0.65
0.13
Max
4.85
9.13
6.76
0.82
0.17
Mean
SD
CV
4.21
0.27
0.06
8.35
0.34
0.04
6.18
0.23
0.04
0.74
0.03
0.04
0.15
0.01
0.07
Min
3.43
8.38
6.11
0.61
0.15
Max
Mean
4.45
3.94
10.31
9.34
7.92
6.86
0.87
0.74
0.21
0.18
SD
CV
0.22
0.06
0.40
0.04
0.37
0.05
0.05
0.07
0.01
0.06
Min
Max
3.02
4.83
7.79
10.93
5.85
7.83
0.58
0.89
0.12
0.21
Mean
3.89
9.30
6.77
0.73
0.17
SD
CV
0.35
0.09
0.63
0.07
0.38
0.06
0.06
0.08
0.02
0.12
Min
3.16
8.01
6.27
0.64
0.13
Max
4.35
11.07
8.01
0.85
0.22
Šolta
Vis
Mean
3.74
9.70
7.08
0.73
0.18
SD
CV
0.25
0.07
0.67
0.07
0.37
0.05
0.04
0.05
0.02
0.11
Min
Max
3.23
4.62
7.81
10.17
5.68
7.13
0.60
0.87
0.13
0.20
Mean
SD
CV
3.92
0.28
0.07
8.94
0.46
0.05
6.36
0.30
0.05
0.71
0.05
0.07
0.16
0.01
0.06
Min
Max
Mean
SD
CV
3.50
4.52
4.02
0.21
0.05
8.04
9.63
8.82
0.36
0.04
6.32
7.56
6.94
0.26
0.04
0.70
0.89
0.79
0.04
0.05
0.14
0.21
0.17
0.01
0.06
Min = minimum value, Max = maximum value, Mean = mean value, SD = standard deviation, CV = coefficient of
variation.
Table S7. Mean squares (MS) of analysis of variance and results of means and Tukey’s HSD post hoc tests at the 0.05 level for five morphological traits of leaves from 12 carob
populations from Croatia.
Source
Locality
Error
Means
Brač
Hvar
Korčula
Lastovo
Mljet
Molunat
Orašac
Pelješac
Podgora
Šipan
Šolta
Vis
DF
11
588
LL
5436.51**
1094.80
192.75
210.16
193.38
197.80
197.20
208.33
209.20
192.74
212.37
208.68
207.70
177.76
WL
1841.43**
275.85
ab
a
ab
ab
ab
a
a
ab
a
a
a
b
114.84
118.22
112.66
103.46
114.76
112.26
121.82
105.53
120.37
113.00
122.81
109.72
LLP
4145.71**
960.60
abc
ab
abcd
d
abc
abcd
a
cd
ab
abcd
a
bcd
135.96
151.31
135.04
143.98
140.76
153.52
149.50
136.68
151.58
150.50
150.56
124.31
NoLfl
9.69**
1.82
ab
a
ab
ab
ab
a
a
ab
a
a
a
b
7.60
7.42
7.86
7.84
8.00
8.62
8.58
7.68
8.22
8.30
7.92
7.18
LLflP
2.92**
0.304
bc
bc
abc
abc
abc
abc
abc
bc
ab
ab
abc
c
2.67
2.93
2.74
2.85
2.62
3.05
2.76
2.68
3.38
3.02
2.72
2.47
LLfl
398.46**
59.173
bcd
bc
bcd
bcd
cd
ab
bcd
bcd
a
abc
bcd
d
57.45
59.29
55.24
52.68
58.29
55.04
61.50
52.63
58.78
56.40
59.04
54.00
WLfl
235.00**
26.972
abc
ab
bc
c
abc
bc
a
c
ab
abc
ab
bc
38.66
40.93
37.28
35.04
35.52
36.16
36.88
35.33
37.54
36.68
41.80
39.10
l/w-Lfl
0.06**
0.004
abcd
ab
bcd
d
cd
cd
cd
cd
bcd
cd
a
abc
** = significant at 0.01 level, DF = degrees of freedom, LL = length of leaves, WL = width of leaves, LLP = length of leaf petioles, NoLfl = number of leaflets, LLflP = length of leaflet
petioles, LLfl = length of leaflets, WLfl = width of leaflets, l/w-Lfl = length/width ratio of leaflets.
0.68
0.69
0.68
0.67
0.61
0.66
0.60
0.68
0.64
0.65
0.71
0.73
bcd
abc
abcd
bcd
ef
cde
abcd
def
cde
ab
a
Table S8. Mean squares (MS) and F-values of analysis of variance and results of means and Tukey’s HSD post hoc tests at the 0.05 level for six morphological traits of pod from 12 carob
populations from Croatia.
Source
Locality
Error
Means
Brač
Hvar
Korčula
Lastovo
Mljet
Molunat
Orašac
Pelješac
Podgora
Šipan
Šolta
Vis
DF
11
1188
WgtP
565.21**
23.86
17.58
18.75
17.61
14.07
15.43
17.26
12.41
19.64
17.59
18.71
18.03
21.04
LP
11002.49**
585.17
bcd
bc
bcd
ef
de
cd
f
ab
bcd
bc
bc
a
126.31
149.18
144.39
143.53
136.82
152.47
123.79
153.62
141.92
147.92
128.81
129.93
WP
362.48**
4.51
de
ab
abc
abc
cd
ab
e
a
bc
abc
de
de
22.99
22.35
21.69
20.84
20.50
21.63
18.99
21.96
23.50
21.77
23.61
26.64
TP
133.46**
1.78
bc
cd
de
ef
f
de
g
de
b
de
b
a
9.20
8.97
8.12
7.54
8.63
8.01
7.77
9.05
8.40
8.36
9.45
11.94
LPP
74.73**
2.47
bc
bcd
efgh
h
cde
fgh
gh
bc
def
defg
b
a
** = significant at 0.01 level, DF = degrees of freedom, WgtP = weight of pods, LP = length of pods, WP = width of pods,
TP = thickness of pods, LPP = length of pod pedicels, NoS = number of seeds per pod.
7.16
8.34
7.65
7.81
7.68
6.80
8.03
9.07
7.68
9.41
6.56
6.96
NoS
152.66**
5.75
cde
b
bcd
bc
bcd
e
b
a
bcd
a
e
de
8.05
8.62
9.81
9.33
10.78
11.38
12.23
10.32
8.65
10.72
9.48
9.25
f
ef
cd
de
bc
ab
a
bcd
ef
bc
de
de