Photocatalytic Degradation of Isoproturon Pesticide on C, N and S Doped TiO2
Bạn đang xem bản rút gọn của tài liệu. Xem và tải ngay bản đầy đủ của tài liệu tại đây (1.5 MB, 10 trang )
J. Water Resource and Protection, 2010, 2, 235-244
doi:10.4236/jwarp.2010.23027 Published Online March 2010 (
Copyright © 2010 SciRes. JWARP
Photocatalytic Degradation of Isoproturon Pesticide
on C, N and S Doped TiO
2
Police Anil Kumar Reddy, Pulagurla Venkata Laxma Reddy, Vutukuri Maitrey Sharma,
Basavaraju Srinivas, Valluri Durga Kumari, Machiraju Subrahmanyam
*
Inorganic and Physical Chemistry Division, Indian Institute of Chemical Technology,
Hyderabad, India
E-mail:
Received December 15, 2009; revised December 29, 2009; accepted January 22, 2010
Abstract
TiO
2
doped with C, N and S (TCNS photocatalyst) was prepared by hydrolysis process using titanium iso-
propoxide and thiourea. The prepared samples were characterized by X-ray diffraction (XRD), scanning
electron microscopy (SEM), X-ray photo electron spectroscopy (XPS), BET surface area, FTIR and diffuse
reflectance spectra (DRS). The results showed that the prepared catalysts are anatase type and nanosized par-
ticles. The catalysts exhibited stronger absorption in the visible light region with a red shift in the adsorption
edge. The photocatalytic activity of TCNS photocatalysts was evaluated by the photocatalytic degradation of
isoproturon pesticide in aqueous solution. In the present study the maximum activity was achieved for
TCNS5 catalyst at neutral pH with 1 g L
-1
catalyst amount and at 1.14 x 10
-4
M concentration of the pesticide
solution. The TCNS photocatalysts showed higher phtocatalytic activity under solar light irradiation. This is
attributed to the synergetic effects of red shift in the absorption edge, higher surface area and the inhibition
of charge carrier recombination process.
Keywords:
Isoproturon, Pesticide Degradation, C, N and S Doped TiO
2
, Visible Light Active Catalysts
1. Introduction
Organic compounds are widely used in industry and in
daily life, have become common pollutants in water
bodies. As they are known to be noxious and carcino-
genic, an effective and economic treatment for eliminat-
ing the organic pollutants in water has been found to be
an urgent demand. The treatment of water contaminated
with recalcitrant compounds is an important task to at-
tend every country in the world. To attain the standards,
there is a need for new treatment. It is very much impor-
tant that the treatment should be safe and economically
feasible. The wastewater purification technologies are
classified as physical, biological, and chemical methods.
All the above processes are having some flaws during
their usage. The limitations include relative slow degra-
dation, incomplete transformations and their inability to
cover many organic compounds that do not occur natu-
rally. Several chemical processes which use oxidizing
agents such as ozone, hydrogen peroxide, H
2
O
2
/UV,
H
2
O
2
/ozone/UV etc. have been carried out to mineralize
many synthetic organic chemicals. Sometimes interme-
diates formed are more hazardous than the parent com-
pound. Therefore, alternative technologies are in demand
for development to treat recalcitrant compounds in
wastewater effluents. Photocatalytic process has been
found to be very active in the treatment of wastewaters
for the mineralization of broad range of organic pollu-
tants. Thus, heterogeneous mediated photocatalysis treat-
ment technique gained noteworthy importance for the
treatment of wastewaters.
Semiconductor mediated photocatalytic oxidation of
water pollutants offers a facile and cheap method.
Among various oxide semiconductor phtocatalysts, TiO
2
has proved to be the most suitable catalyst for wide
spread environmental applications because of its bio-
logical and chemical inertness, strong oxidizing power,
non toxicity, long term stability against photo and
chemical corrosion [1,2]. However, its applications
seems to be limited by several factors, among which
the most restrictive one is the need of using an UV
wavelength of < 387 nm, as excitation source due to its
wide band gap (3.2 eV), and this energy radiation avail-
ability is less than 5 % in solar light.
P. A. K. REDDY ET AL.
236
Several works reported that doping TiO
2
with anions
such as carbon, nitrogen, sulphur, boron and fluorine shifts
the optical absorption edge of TiO
2
towards lower energy,
there by increasing the photocatalytic activity in visible
light region [3–9]. The preparation of doped TiO
2
resulting
in a desired band gap narrowing and an enhancement in
the phtocatalytic activity under visible light.
In earlier reported studies, N doping of TiO
2
is
achieved by different methods such as sputtering of TiO
2
in a gas mixture followed by annealing at higher tem-
peratures [3], treating anatase TiO
2
powders in an NH
3
/
Ar atmosphere [10], solution based methods like precipi-
tation [11,12], sol-gel [13,14], solvothermal [15], hydro-
thermal processes [16] and direct oxidation of the dopent
containing titanium precursors at appropriate tempera-
tures [17]. In our earlier studies, we have concentrated on
degradation of isoproturon using TiO
2
supported over
various zeolites. The main idea of using Zeolite support
for TiO
2
is to enhance the adsorption capacity of the
pollutant over the combinate photo catalyst systems
[18–20]. In the present case the main focus is on shifting
the absorption edge of TiO
2
to visible light region by
introducing C, N and S into the TiO
2
lattice structure.
The present results obtained provides a simple route for
the preparation of C, N and S doped TiO
2
with enhanced
photocatalytic activity under visible light irradiation for
isoproturon pesticide degradation.
2. Experimental Details
2.1. Materials and Methods
All the chemicals in the present work are of analytical
grade and used as such without further purification. Iso-
proturon (IPU) (>99% pure, Technical grade) was ob-
tained from Rhône-Poulenc Agrochemie, France and
titanium isopropoxide was from Sigma-Aldrich chemie
GmbH, Germany. HCl, NaOH and acetonitrile were ob-
tained from Ranbaxy Limited, India. All the solutions
were prepared with deionized water obtained using a
Millipore device (Milli-Q).
2.2. Preparation of C, N and S Doped TiO
2
Photocatalyst
C, N and S doped TiO
2
photocatalyst was prepared by a
simple hydrolysis process using titanium isopropoxide as
the precursor for titanium and thiourea as the source for
carbon, nitrogen and sulphur [26,34]. In a typical pre-
paration, 10 mL of titanium isopropoxide solution was
mixed with 30 mL of isopropyl alcohol solution. This
solution was added drop wise to 20 mL deionized water
containing in a 250 mL beaker. The solution was tho-
roughly mixed using a magnetic stirrer for 4 h. To this
solution, required amount of thiourea, dissolved in 5 mL
deionized water was added. The mixture was stirred for 6
h and dried in oven at 80
0
C for 12 h. The solid product
formed was further calcined at 400
0
C temperature for 6
h in air to get C, N, and S doped TiO
2
photocatalyst. The
weight (%) of thiourea doped TiO
2
was controlled at 0, 1,
3, 5, 10 and 15 wt% and the samples obtained were la-
beled as TCNS0, TCNS1, TCNS3, TCNS5, TCNS10 and
TCNS15 respectively.
2.3. Characterization
The catalysts were characterized by various techniques
like XRD, XPS, FTIR, SEM, BET surface area and
UV-Vis DRS. The XRD of catalysts were obtained by
Siemens D 5000 using Ni Filtered Cu K α radiation (√ =
1.5406 A
0
) from 2θ = 1-60
0
. XPS spectra were recorded
on a KRATOS AXIS 165 equipped with Mg Kα radia-
tion (1253.6 eV) at 75 W apparatus using Mg Kα anode
and a hemispherical analyzer, connected to a five chan-
nel detector. The C 1s line at 284.6 eV was used as an
internal standard for the correction of binding energies.
The Fourier transform-infra red spectra (FTIR) were re-
corded on a Nicolet 740 FTIR spectrometer (USA) using
KBr self-supported pellet technique. The SEM analysis
samples were mounted on an aluminum support using a
double adhesive tape coated with gold and observed in
Hitachi S-520 SEM unit. BET data was generated on
(Auto Chem) Micro Maritics 2910 instrument. UV–Vis
diffused reflectance spectra (UV–Vis DRS) was from
UV–Vis Cintra 10e spectrometer.
2.4. Photocatalytic Experiments
IPU solution (0.114 mM) was freshly prepared by dis-
solving in double distilled water. All the phtocatalytic
experiments were carried out at same concentration until
unless stated. The pH of the solution was adjusted with
HCl and NaOH. Prior to light experiments, dark (adsorp-
tion) experiments were carried out for better adsorption
of the herbicide on the catalyst. For solar experiments,
isoproturon solution of 50 mL was taken in an open glass
reactor with known amount of the catalyst. The solution
was illuminated under bright solar light. Distilled water
was added periodically to avoid concentration changes
due to evaporation. The solar experiments were carried
out during 10.00 A.M. to 3.00 P.M. in May and June
2009 at Hyderabad.
2.5. Analyses
The IPU degradation was monitored by Shimadzu
SPD-20A HPLC using C-18 phenomenex reverse phase
column with acetonitrile/water (50/50 v/v %) as mobile
phase at a flow rate of 1 mL min
-1
. The samples were
collected at regular intervals, filtered through Millipore
Copyright © 2010 SciRes. JWARP
P. A. K. REDDY ET AL.
237
micro syringe filters (0.2 μm)
.
3. Results and Discussion
3.1. Characterization
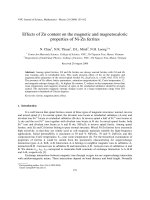
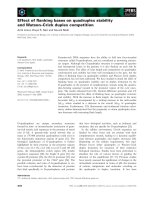
3.1.1. XRD
To investigate the phase structure of the prepared sam-
ples XRD was used and the results are shown in Figure
1. It can be seen that TCNS exhibits only the characteris-
tic peaks of anatase (major peaks at 25.41
0
, 38
0
, 48
0
, 55
0
)
and no rutile phase is observed. The results are in good
agreement with earlier studies [21]. By applying Debye-
Scherrer equation, the average particle size of the TCNS
catalysts is found to be about 3.8 to 5.8 nm. It can be
inferred that the ratio of thiourea to titania slightly influ-
ence the crystallization of the mesoporous titania. Also
the peak intensity of anatase decreases and the catalyst
becomes more amorpous. It might be due to the fact that
the doped nonmetals can hinder the phase transition
(anatase to rutile) and restricts the crystal growth. It is
noteworthy that, even the doped samples exhibit typical
structure of TiO
2
crystal without any detectable dopant
related peaks. This may be caused by the lower concen-
tration of the doped species, and moreover, the limited
dopants may have moved into either the interstitial posi-
tions or the substitutional sites of the TiO
2
crystal struc-
ture [22,23].
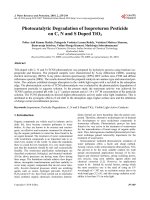
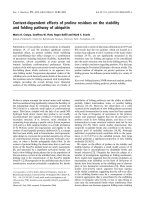
3.1.2. XPS
To investigate the chemical sates of the possible dopants
incorporated into TiO
2
, Ti2p, O1s, C1s, N1s, and S2p
binding energies are studied by measuring the XPS spec-
tra. The results are shown in Figure 2.
The high resolution spectra of Ti2p
3/2
and Ti2p
1/2
core
levels are given in the Figure 2(a). The binding energy
for the Ti2p
3/2
and Ti2p
1/2
core level peaks for TCNS0
appeared at 458.8 and 464.5 eV respectively which are
attributed to O-Ti-O linkages in TiO
2
. Ti2p
3/2
and Ti2p
1/2
core level peaks for TCNS5 are observed at 458.4 and
464.1 eV with a decrease in the binding energy value
compared to TiO
2
indicating that the TiO
2
lattice is con-
siderably modified due to C, N and S doping [24].
The chemical environment of carbon is investigated by
the XPS of C1s core levels as shown in the Figure 2(b).
Three peaks are observed for the C1s at 284.6, 286.2 and
288.8 eV. The first peak observed at 284.6 eV is as-
signed to elemental carbon present on the surface, which
is also in agreement with the reported studies [25]. The
second and third peaks at 286.2, 288.8 eV are attributed
to C-O and C=O bonds respectively [21,26].
The high resolution XPS spectra of N1s core level is
shown in Figure 2(c). Generally, N1s core level in N
doped TiO
2
shows binding energies around 369-397.5
10 20 30 40 50 60
f
e
d
c
b
a
Intensity (a.u)
2
Figure 1. XRD patterns of TCNS catalysts: (a) TCNS0, (b)
TCNS1, (c) TCNS3, (d) TCNS5, (e) TCNS10, (f) TCNS15.
eV that are attributed to substitutionally doped N into the
TiO
2
lattice or β nitrogen [3,27]. N1s peaks, with high
intensity observed at and above 400 eV are assigned to
NO, N
2
O, NO
2
-
, NO
3
-
. Sakthivel et al. [28] observed an
intense peak at 400.1 eV that was assigned to hyponitrile
species and concluded that the higher binding energy is
due to the lower valence state of N in N doped TiO
2
.
Many researches pointed out that intense peak at 400 eV
are due to oxidized nitrogen like Ti-O-N or Ti-N-O
linkages. Dong et al. [26] observed three peaks of N1s at
397.8, 399.9 and 401.9 eV and has attributed to N-Ti-N,
O-Ti-N and Ti-N-O linkage respectively. Recently,
Gopinath observed N1s binding energy at 401.3 eV and
claimed the presence of Ti-N-O linkage on the surface of
N doped TiO
2
nano particles [29]. Figure 2(c) shows the
N1s spectra of TCNS5 catalyst and three peaks are ob-
served at 397.8, 399.9 and 401.2 eV. Taking the litera-
ture support, here in the present investigation, the first
peak at 397.8 eV is attributed to N-Ti-N linkages and the
second and third peaks at 399.9 and 401.2 eV are as-
cribed to O-Ti-N, Ti-N-O linkages in the TiO
2
lattice
respectively.
The O1s spectra of TCNS0 and TCNS5 are shown in
Figure 2(d). The O1s peak for TCNS0 is observed at
529.7 and 531.6 eV. The corresponding values are 530.2
and 531.7 eV for the TCNS5 sample. The first peak is
mainly attributed to the O-Ti-O linkage in the TiO
2
lat-
tice, and the second peak is closely related to the hy-
droxyl groups (-OH) resulting mainly from chemisorbed
water. It can be seen that the content of surface hydroxyl
groups is much higher in the TCNS5 sample than in the
TCNS0 sample. The increase in surface hydroxyl content
is advantageous for trapping more photogenerated holes
and thus preventing electron–hole recombination [26].
Copyright © 2010 SciRes. JWARP
P. A. K. REDDY ET AL.
Copyright © 2010 SciRes. JWARP
238
(a) (b)
(c) (d)
(e)
Figure 2. High resolution XPS of TCNS5 catalyst: (a)Ti2p, (b)C1s, (c)N1s, (d)O1s, (e)S2p.
S2p XPS spectra for TCNS5 are shown as Figure 2(e).
The oxidation state of the S-dopant is dependent on the
preparation routes and sulfur precursors. Previous studies
have reported that if thiourea was used, the substitution
of Ti
4+
by S
6+
would be more favorable than replacing
O
2−
with S
2−
[4]. S2p spectra can be resolved into four
P. A. K. REDDY ET AL.
239
peaks, S2p
1/2
6+
, S2p
3/2
6+
, S2p
1/2
4+
and S2p
3/2
4+
. The Fig-
ure 2(e) shows two peaks at 168.3 and 169.6 eV corre-
sponding to S2p
3/2
6+
, S2p
1/2
6+
binding energies [30]. It is
clear from the figure that S was doped mainly as S
6+
and
not S
4+
or S
2−
peaks. The sulfur doping further can be
substantiated by the decrease in binding energies of the
Ti2p
1/2
and Ti2p
3/2
of TCNS5 sample compared to the
binding energies Ti2p
1/2
and Ti2p
3/2
of the TCNS0 sam-
ple respectively (Figure 2(a)). This may be caused due
to the difference of ionization energy of Ti and S.
Therefore, it could be concluded that the lattice titanium
sites of TiO
2
were substituted by S
6+
and formed as a
new band energy structure.
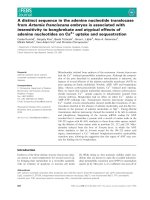
3.1.3. FTIR Spectra
Figure 3 shows the FTIR spectra of TCNS0 and TCNS5
catalysts calcined at 400
◦
C. The absorption bands
2800–3500 cm
-1
, 1600–1680 cm
-1
are assigned to the
stretching vibration and bending vibration of the hy-
droxyl group respectively present on the surface of TiO
2
catalyst [31,32]. The presence of surface hydroxyl
groups are substantiated by XPS of O1s spectra (Figure
2(d)). The band around 1730 cm
-1
is attributed to car-
bonyl group and bands at 1130, 1040 cm
-1
are corre-
sponding to nitrite and hyponitrite groups present in
TCNS5 and they are absent in TCNS0 which shows suc-
cessful doping of nitrogen into the lattice of TiO
2
[33,34]. No peak corresponding to NH
4
+
absence (3189
and 1400 cm
-1
) shows that N is present only in the form
of nitrite and hyponitrite species [32].
3.1.4. SEM
The surface morphology of TCNS photocatalyst is stud-
ied by scanning electron microscopy and the micro-
graphs are presented in Figure (4). The samples ap-
peared are agglomeration of smaller particles. From this
image, we can see that the surface is rough and large
number of pores found to be seen. SEM images for the
undoped (TCNS0) and CNS-doped (TCNS5) shows that
Figure 3. FTIR spectra of TCNS catalysts.
Figure 4. SEM images of (a) TCNS0 and (b) TCNS5 cata-
lysts.
the particle morphology seems to be as spherical in both
the images and there is no considerable change in mor-
phology of both. The photograph of thiourea doped TiO
2
(TCNS5) sample is exhibiting well-dispersed crystals
and the particle is homogeneous with the formation of
fine and well dispersed particles.
3.1.5. UV-VIS DRS
The UV-Vis diffuse reflectance spectra (DRS) of TCNS
catalysts are shown in Figure 5. It is seen from Figure 5(a)
that the undoped TiO
2
nano catalyst (TCNS0) showed
strong absorption band around 380 nm in the ultraviolet
region. But, TCNS sample is showing absorbance at
400-470 nm with red shift (about 100 nm) towards visi-
ble region. This shift in the absorption edge decreases the
direct band gap of TCNS catalyst compared to undoped
TiO
2
(TCNS0) and this may be due to the insertion of C,
N and S into the TiO
2
lattice [13,25,35]. Furthermore, the
red shift in the DRS band increases with the increase in
doped elements content into TiO
2
lattice. Band gap en-
ergy (Eg value) of all the catalysts is estimated from the
plot of absorbance versus photon energy (hv). The
Copyright © 2010 SciRes. JWARP
P. A. K. REDDY ET AL.
Copyright © 2010 SciRes. JWARP
240
400 500 600 700 800
(a)
TCNS0
TCNS1
TCNS3
TCNS5
TCNS10
TCNS15
Absorbance (a.u)
Wavelength ( nm )
1.61.82.02.22.42.62.83.03.23.43.63.84.0
(b)
TCNS0
TCNS1
TCNS3
TCNS5
TCNS10
TCNS15
Absorbance (a.u)
Bandgap (eV)
(a) (b)
Figure 5. UV-Vis diffusion reflectance spectra of TCNS catalysts.
(a) Absorbance versus Wavelength; (b) Absorbance versus Bandgap.
absorbance is extrapolated to get the bandgap energy for
the TCNS catalyst with good approximation as observed
in Figure 5(b). The estimated bandgap energies of TCNS0,
TCNS1, TCNS3, TCNS5, TCNS10 and TCNS15 are
3.05, 2.91, 2.82, 2.7, 2.6 and 2.41 respectively. From the
DRS results, it is clear that the C, N and S doping can
shift the absorption edge of TiO
2
to the visible range and
reduce the band gap, which is beneficial for improving
the photo absorption and ultimately photo catalytic per-
formance of TiO
2
.
3.1.6. BET Surface Area
The surface area of TCNS catalysts calcined at 400
0
C is
shown in Table 1. The TCNS catalysts are showing high
surface area. The high surface area of the prepared cata-
lysts is due to nanosize of the particles. It is also ob-
served that the surface area of the catalysts increases
with the increase in the ratio of thiourea to TiO
2
. This
can be attributed to decreasing of the crystallite sizes, as
discussed in XRD analysis.
3.2. Photocatalytic Activity
3.2.1. Adsorption Studies
Prior to photocatalytic experiments adsorption and pho-
tolysis studies are carried out. The isoproturon solution
was kept in dark without catalyst for 10 days and no
degradation is observed. Fifty milligrams of the catalyst
in 50 mL of isoproturon (1.14×10
−4
M) solution is al-
lowed under stirring in dark. Aliquots were withdrawn at
regular intervals and the change in isoproturon concen-
tration is monitored by HPLC. Maximum adsorption is
reached within 30 min for all the catalysts prepared. This
illustrates the establishment of adsorption equilibrium as
30 min and is chosen as the optimum equilibrium time
for all the future experiments. The photolysis (without
catalyst) experiment is carried out under the solar light
taking 50 mL of isoproturon solution in glass reactor and
only 2–4 % of degradation is observed after 10 h of solar
irradiation.
3.2.2. Determination of Thiourea Loading over TiO
2
To compare the phtotcatalytic activity of the as-prepared
samples, phtocatalytic degradation of isoproturon under
solar light irradiation is performed. All the studies are
carried out at 1 g L
−1
catalyst amount in 1.14×10
−4
M
isoproturon solution. The photocatalytic activity of
TCNS catalysts under solar light irradiation is shown in
Figure 6. Among all the catalysts prepared, TCNS5 is
showing better phtocatalytic activity and complete deg-
radation. The visible light activity of the samples has
increased gradually with the increasing amount of dopent
and it reaches optimum at 5 wt % loading (TCNS5) and
further increase results an activity decrease gradually.
Table 1. BET surface area and particle size of the TCNS
catalysts.
Catalyst
Particle size by
XRD (nm)
BET surface area
(m
2
/g)
TCNS0 5.8 80.53
TCNS1 5.2 82.47
TCNS3 5.1 83.97
TCNS5 4.6 89.14
TCNS10 4.2 92.98
TCNS15 3.8 124.28
P. A. K. REDDY ET AL.
241
TCNS0 TCNS1 TCNS3 TCNS5 TCNS10 TCNS15
0.000
0.005
0.010
0.015
0.020
0.025
0.030
0.035
Rate constant k min
-
1
Figure 6. Photocatalytic activity of C, N and S doped TiO
2
for the degradation of isoproturon aqueous solution (1.14
×10
-4
M) under solar-light irradiation.
The different samples photo catalytic activity can be
attributed to the following factors. It is known that the
doping of C, N and S elements in titania brings visible
light absorption photocatalytic activity of titania. It can
be seen from the DRS spectra that C, N, and S doping
resulted in an intense increase in absorption in the visible
light region and a red shift in the absorption edge of the
titania (Figure 5(a)). The band-gap narrowing of titania
by C, N, S doping lead to enhanced photocatalytic activ-
ity of the titania under visible light. Because the prepared
doped samples can be activated by visible light, thus
more electrons and holes can be generated and partici-
pate in the photocatalytic redox reactions [21]. All to-
gether, the C, N, and S doped samples show much higher
photocatalytic activity than undoped tiantia. But we can
also see that at higher loadings photocatalytic activity of
TCNS samples has decreased though they show more red
shift in the absorption edge. It might be due to the fact
that, the excess dopent acts as recombination centers
which facilitates electron-hole recombination thus low-
ering the activity. So, the photocatalytic activity is de-
pressed to a certain extent. To conclude, the higher activ-
ity of the TCNS5 sample can be ascribed to the high sur-
face area, strong adsorption in visible region and lower
recombination of electron-hole pair due to high concen-
tration of surface hydroxyl groups (Figure 2(d)) which
can trap the photo generated holes and thus decreasing
the electron hole recombination process [26].
3.2.3. Effect of Substrate Concentration
The effect of substrate concentration is an important pa-
rameter for photocatalytic degradation activity over
known catalyst amount. The 7.28×10
−5
, 1.14×10
−4
and
2.42×10
−4
M concentrations of isoproturon are studied
over TCNS5 catalyst with 1.0 g L
−1
catalyst amount. It is
seen from Figure 7 a slight difference in degradation rate
over titania supported catalyst for 7.28×10
−5
, 1.14×10
−4
M concentrations are observed compared to 2.42×10
−4
M.
This indicates, at higher concentrations OH radicals
produced by the catalyst are not sufficient to degrade the
pollutant molecules which are adsorbed or near to the
catalyst surface. Hence, 1.14 × 10
−4
M solutions is cho-
sen for the degradation as there is an equilibrium be-
tween adsorption of reactant molecules and the gene-
ration of OH radicals from the active sites.
3.2.4. Effect of Catalyst Amount
The catalyst amounts 0.5, 1.0 and 2.0 g L
−1
of TCNS5
are investigated for effective isoproturon degradation
(Figure 8). It is observed that, increasing amounts
0.5–1.0 g L
−1
, the photocatalytic activity has increased
and at the higher amounts the activity trend is not en-
couraging. This is due to the higher amounts of the cata-
lyst makes the solution turbid which obstructs the light
path into the solution and inturn reducing the formation
of OH radicals. In the present study, 1.0 g L
−1
is found to
be the optimum catalyst amount for efficient degradation
of isoproturon.
3.2.5. Effect of pH
The effect of pH is an important parameter because it
commands the surface charge properties of the catalyst
and therefore the adsorption of the pollutant. The pH
studies at 3–10 are carried over TCNS5 catalyst using
1.0 g L
−1
of 1.14×10
−4
M isoproturon solution. The ad-
sorption capacity of the catalyst in different pH ranges is
not much affected due to the non-ionic nature of isopro-
turon. The results depicted in Figure 9 are showing that
at neutral pH, the rate of degradation is faster compared
to acidic or basic medium [36]. This may be due to the
non-ionic nature of isoproturon. In basic medium, there
is a slight increase in degradation rate and is observed
when compared to the acidic medium. This may be because,
the OH radicals are mainly attacking methyl groups
0.000
0.005
0.010
0.015
0.020
0.025
0.030
0.035
0.040
2.42 x 10
-4
M
1.14 x 10
-4
M
7.28 x 10
-5
M
Rate constant k min
-1
Figure 7. Effect of initial concentration on the rate of solar
photocatalytic degradation of isoproturon over TCNS5.
Copyright © 2010 SciRes. JWARP
P. A. K. REDDY ET AL.
Copyright © 2010 SciRes. JWARP
242
y = 0.0334x
y = 0.0129x
y = 0.0207x
0
1
2
3
4
5
6
0 50 100 150 20
0
Time (min)
Ln(Co/C)
pH3 pH5 pH7 pH8 pH10
0.0
0.5
1.0
1.5
2.0
2.5
3.0
3.5
Rate constant x 10
-2
min
-1
Figure 8. Effect of catalyst amount on photocatalytic degra-
dation of isoproturon over TCNS5 catalyst under solar light
irradiation: 0.5 g L
-1
(●), 1g L
-1
(■) and 2 g L
-1
(▲).
Figure 9. Effect of pH on solar photocatalytic isoproturon
degradation ov
er TCNS5. (Experimental conditions: C
0
=1.14×10
−4
M; catalyst amount = 1.0 g L
−1
.)
0 50 100 150 200 250 300
0.0
0.2
0.4
0.6
0.8
1.0
% Isoproturon (C/C
0
)
Time (min)
Cycle i
Cycle ii
Cycle iii
Cycle iv
300 400 500 600 700 800
(i)
(ii)
Absorbance (a.u)
Wavelength (nm)
(a) (b)
(c)
Figure 10. Isoproturon degradation over TCNS5 catalyst. (a) Recycling activity studies. (Experimental conditions: C
0
=1.14×10
−4
M; pH 7; catalyst amount = 1.0 g L
−1
.) Characterization of 1) Fresh and 2) Used (after 4th cycle) catalysts (b)
UV–Vis DRS spectra and (c) SEM photographs.
P. A. K. REDDY ET AL.
243
and the hydroxylation of aromatic ring is clearly unfa-
vored with decrease in pH, whereas in basic medium the
hydroxylation of aromatic ring is favored but not the
methyl groups. In neutral medium, the OH radicals at-
tack both on the aromatic ring and on the methyl groups.
This cumulative effect results a maximum degradation
rate of the pollutant [20].
3.2.6. Catalyst Recycling Studies
To evaluate stability/activity of the catalyst for photo-
catalytic degradation, the recycling studies are conducted
over TCNS5 using 1.0 g L
−1
catalyst and the results are
provided in Figure 10(a). After completion of the 1
st
cy-
cle, the catalyst is recovered, dried and is reused as such
(without any calcination) for the 2
nd
cycle, a slight de-
crease in the rate of degradation is observed compared to
the first cycle. When same catalyst is reused without cal-
cination for the third cycle, there is a slight decrease in
degradation rate observed compared to first and second
cycle. The differences in rates are due to the accumulated
organic intermediates on the surface of the catalyst, af-
fecting the adsorption in turn reducing the activity. This is
confirmed by calcining the 3
rd
cycle used sample at 400
0
C for 3 h and reused for the 4
th
cycle activity. The origi-
nal activity of the catalyst for degradation is restored.
This indicates that calcination of the used catalyst is nec-
essary in order to regain the activity. Furthermore, this is
substantiated by comparison of the surface characteri-
zation studies like SEM and UV–Vis DRS techniques on
the fresh and 4
th
cycle used samples Figures 10(b)-10(c).
The band gap as well as wavelength excitations are not
having any changes in the UV–Vis DRS spectra of the
fresh and used catalysts. From SEM photographs, it is
clear that the surface morphology is not changed much
and it indicates that catalyst is intact even after the 4
th
cycle. Thus, the above studies prove that the catalyst is
reusable for number of cycles without any loss in activity
and stable for longer life.
4. Conclusions
The present study demonstrates preparation of a C, N,
and S doped TiO
2
photocatalyst and its role in photo-
catalytic pesticide degradation. The results conclude that
5 wt% thiourea doped TiO
2
(TCNS5) is an efficient
catalyst for the photocatalytic degradation of isoproturon.
The higher activity of TCNS5 catalyst may be due to the
high surface area, lower electron-hole recombination and
the stronger adsorption in visible light region. The sub-
strate concentration of 1.14 × 10
−4
M, catalyst amounts 1
g L
−1
and neutral pH are found to be favorable for higher
degradation rates of isoproturon. The catalyst activity is
found to be sustainable even after the 4
th
cycle (as evi-
denced by SEM and UV–Vis DRS techniques).
5. Acknowledgements
The authors PAKR, MS thank CSIR, New Delhi for
funding this work under Emeritus Scientist Scheme.
6
. References
[1] A. Fujishima, K. Hashimoto, and T. Watanabe, “TiO
2
photocatalysis: Fundamentals and applications,” BKC,
Tokyo, 1999.
[2] L. Q. Wu, N. Xu, and J. Shi, “Leak growth mechanism in
composite Pd membranes,” Industrial & Engineering
Chemistry Research, Vol. 39, pp. 342–348, 2000.
[3] R. Asahi, T. Morikawa, T. Ohwaki, K. Aoki, and Y. Taga,
“Visible-light photocatalysis in Nitrogen-Doped titanium
oxides,” Science, Vol. 293, pp. 269–71, July 2001.
[4] T. Ohnoa, M. Akiyoshi, T. Umebayashi, K. Asai, T. Mit-
sui, and M. Matsumura, “Preparation of S-doped TiO
2
photocatalysts and their photocatalytic activities under
visible light,” Applied Catalysis A: General, Vol. 265, pp.
115–121, February 2004.
[5] X. Chen and S. S. Mao, “Titanium dioxide nano-mate-
rials: Synthesis, properties, modifications, and appli-
cations,” Chemical Review, Vol. 107, pp. 2891–2959,
2007.
[6] H. Irie, Y. Watanabe, and K. Hashimoto, “Carbon-doped
anatase TiO
2
powders as a visible-light sensitive photo-
catalyst,” Chemistry Letters, Vol. 32, pp. 772–773, May
2003.
[7] W. Ho, J. C. Yu, and S. Lee, “Synthesis of hierarchical
nanoporous F-doped TiO2 spheres with visible light
photocatalytic activity,” Chemical Communications, pp.
1115–1117, January 2006.
[8] L. Lin, W. Lin, Y. Zhu, B. Zhao, and Y. Xie, “Phosphor-
doped titania —A novel photocatalyst active in visible
light,” Chemistry Letters, Vol. 34, pp. 284–285, Novem-
ber 2004.
[9] T. Ohno, T. Mitsui, and M. Matsumura, “Photocatalytic
activity of S-doped TiO
2
photocatalyst under visible
light,” Chemistry Letters, Vol. 32, pp. 364–365, January
2003.
[10] H. Irie, Y. Watanabe, and K. Hashimoto, “Nitrogen-
concentration dependence on photocatalytic activity of
TiO
2-x
N
x
powders,” Journal of Physical Chemistry B, Vol.
107, pp. 5483–5486, January 2003.
[11] J. G. Yu, M. H. Zou, B. Cheng, and X. J. Zhao, “Prepara-
tion, characterization and photocatalytic activity of in situ
N, S-codoped TiO
2
powders,” Journal of Molecular Ca-
talysis A: Chemical, Vol. 246, pp. 176–184, December
2005.
[12] Y. Q. Wang, X. J. Yu, and D. Z. Sun, “Synthesis, charac-
teri- zation, and photocatalytic activity of TiO
2−x
N
x
nano-
catalysts,” Journal of Hazardous Materials, Vol. 144, pp.
328–333, October 2006.
[13] J. L. Gole and J. D. Stout, C. Burda, Y. Lou, and X. Chen,
“Highly efficient formation of visible light tunable
Copyright © 2010 SciRes. JWARP
P. A. K. REDDY ET AL.
244
TiO
2-x
N
x
photocatalysts and their transformation at the
nanoscale,” Journal of Physical Chemistry B, Vol. 108,
pp. 1230–1240, September 2003.
[14] C. Burda, Y. Lou, X. Chen, A. C. S. Samia, J. Stout, and
J. L. Gole, “Enhanced nitrogen doping in TiO
2
nanoparti-
cles,” Nano Letters, Vol. 3, pp. 1049–1051, June 2003.
[15] B. Chi, L. Zhao, and T. Jin, “One-step template-free route
for synthesis of mesoporous N-doped titania spheres,”
Journal of Physical Chemistry C, Vol. 111, pp. 6189–
6193, February 2007.
[16] X. W. Bao, S. S. Yan, F. Chen, and J. L. Zhang , “Prepa-
ration of TiO2 photocatalyst by hydrothermal method
from aqueous peroxotitanium acid gel,” Material Letters,
Vol. 59, pp. 412–415, October 2004.
[17] T. Morikawa, R. Asahi, T. Ohwaki, K. Aoki, and Y. Taga,
“Band-gap narrowing of titanium dioxide by nitrogen
doping,” Japan Journal of Applied Physics, Vol. 40, pp.
561–563, April 2001.
[18] M. V. Phanikrishna Sharma, V. Durgakumari, and M.
Subrahmanyam, “Solar photocatalytic degradation of
isoproturon over TiO
2
/H-MOR composite systems,”
Journal of Hazardous Materials, Vol. 160, pp. 568–575,
March 2008.
[19] M. V. Phanikrishna Sharma, V. Durga Kumari, and M.
Subrahmanyam, “Photocatalytic degradation of isopro-
turon herbicide over TiO
2
/Al-MCM-41 composite sys-
tems using solar light,” Chemosphere, Vol. 72, pp. 644–
651, April 2008.
[20] M. V. Phanikrishna Sharma, G. Sadanandam, A. Ratna-
mala, V. Durga Kumari, and M. Subrahmanyam, “An ef-
ficient and novel porous nanosilica supported TiO
2
photocatalyst for pesticide degradation using solar light,”
Journal of Hazardous Materials, Vol. 171, pp. 626–633,
June 2009.
[21] Y. Ao, J. Xu, D. Fu, and C. Yuan, “Synthesis of C,N,S-
tridoped mesoporous titania with enhanced visible light-
induced photocatalytic activity,” Microporous and
Mesoporous Materials, Vol. 122, pp. 1–6, November
2008.
[22] S. I. Shah, W. Li, C. P. Huang, O. Jung, and C. Ni,
“Study of Nd
3+
, Pd
2+
, Pt
4+
, and Fe
3+
dopant effect on
photo reactivity of TiO
2
nanoparticles,” Proceedings of
the National Academy of Sciences, Vol. 99, pp. 6482–
6486, January 2002.
[23] J. Sun, L. Qiao, S. Sun, and G. Wang, “Photocatalytic
degradation of orange G on nitrogen-doped TiO
2
catalysts
under visible light and sunlight irradiation,” Journal of
Hazardous Materials, Vol. 155, pp. 312–319, November
2007.
[24] F. Peng, L. Cai, H. Yu, H. Wang, and J. Yang, “Synthesis
and characterization of substitutional and interstitial ni-
trogen-doped titanium dioxides with visible light photo-
catalytic activity,” Journal of Solid State Chemistry, Vol.
181, pp. 130–136, November 2007.
[25] Y. Park, W. Kim, H. Park, T. Tachikawa, T. Majima, and
W. Choi, “Carbon-doped TiO
2
photocatalyst synthesized
without using an external carbon precursor and the visible
light activity,” Applied Catalysis B, Vol. 91, pp. 355–361,
June 2009.
[26] F. Dong, W. Zhao, and Z. Wu, “Characterization and
photocatalytic activities of C, N and S co-doped TiO
2
with
1
D nanostructure prepared by the nano-confinement
effect,” Nanotechnology, Vol. 19, pp. 365–607, July
2008.
[27] I. C. Kang, Q. Zhang, S. Yin, T. Sato, and F. Saito,
“Novel method for preparation of high visible active
N-doped TiO
2
photocatalyst with its grinding in solvent,”
Applied Catalysis B, Vol. 84, pp. 570–576, May 2008.
[28] S. Sakthivel and H. Kisch, “Daylight photocatalysis by
carbon-modified titanium dioxide,” Angewandte Chemie
International Edition, Vol. 42, pp. 4908–4911, 2003.
[29] C. Gopinath, “Comment on photoelectron spectroscopic
investigation of nitrogen-doped titania nanoparticles,”
Journal of Physical Chemistry B, Vol. 110, pp. 7079–
7080, January 2006.
[30] S. Liu and X. Chen, “A visible light response TiO
2
photocatalyst realized by cationic S-doping and its appli-
cation for phenol degradation,” Journal of Hazardous
Materials, Vol. 152, pp. 48–55, June 2007.
[31] J. Geng, D. Yang, J. Zhu, D. Chen, and Z. Jiang, “Nitro-
gen-doped TiO
2
nanotubes with enhanced photo- cata-
lytic activity synthesized by a facile wet chemistry
method,” Material Research Bulletin, Vol. 44, pp. 146–
150, March 2008.
[32] Y. Li, C. Xie, S. Peng, G. Lub, and S. Li, “Eosin
Y-sensitized nitrogen-doped TiO
2
for efficient visible
light photocatalytic hydrogen evolution,” Journal of Mo-
lecular Catalysis A: Chemical, Vol. 282, pp. 117–123,
December 2007.
[33] S. Sakthivel, M. Janczarek, and H. Kisch, “Visible light
activity and photoelectrochemical properties of nitro-
gen-doped TiO
2
,” Journal of Physical Chemistry B, Vol.
108, pp. 19384–19387, September 2004.
[34] Y. Yokosuka, K. Oki, H. Nishikiori, Y. Tatsumi, N. Ta-
naka, and T. Fujii, “Photocatalytic degradation of tri-
chloroethylene using N-doped TiO
2
prepared by a simple
sol–gel process,” Research on Chemical Intermediates,
Vol. 35, pp. 43–53, January 2009.
[35] J. A. Rengifo-Herrera, K. Pierzchała, A. Sienkiewicz, L.
Forro, J. Kiwi, and C. Pulgarin, “Abatement of organics
and escherichia coli by N, S co-doped TiO
2
under UV
and visible light. Implications of the formation of singlet
oxygen (
1
O
2
) under visible light,” Applied Catalysis B,
Vol. 88, pp. 398–406, November 2008.
[36] H. S. Lee, T. Hura, S. Kimb, J. H. Kima, and H. I. Lee,
“Effects of pH and surface modification of TiO
2
with
SiO
x
on the photocatalytic degradation of a pyrimidine
derivative,” Catalysis Today, Vol. 84, pp. 173–180, July
2003.
Copyright © 2010 SciRes. JWARP

![Lecture notes on c algebras and quantum mechanics [jnl article] n lamdsman](https://media.store123doc.com/images/document/14/rc/rt/medium_6PjfnHupCQ.jpg)